1 引言
2 资料来源与方法介绍
2.1 气象驱动数据
2.2 验证数据
2.3 模型描述
2.4 积雪物候的定义
3 结果分析
3.1 不同气象驱动数据集的对比
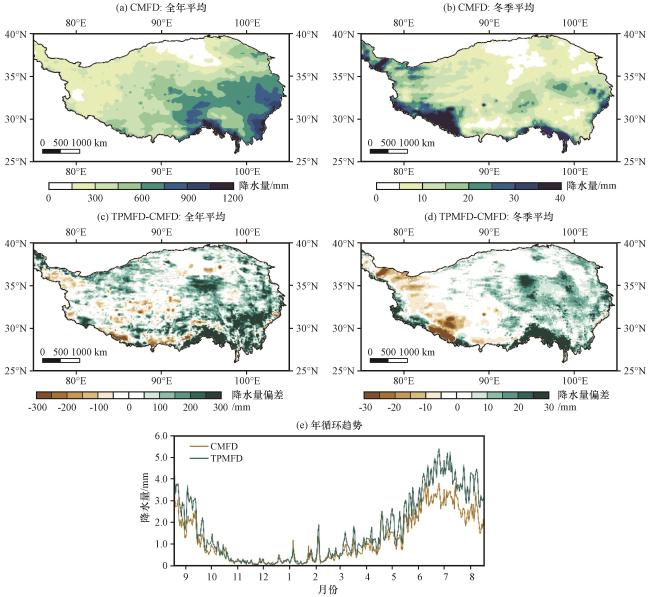
图2 CMFD和TPMFD数据集全年平均(a, c)和冬季平均(b, d)总降水量的空间分布(a, b)、 相应的偏差(c, d)以及日平均总降水量季节变化(e) (单位: mm)Fig.2 Spatial distribution of annual (a, c) and winter (b, d) mean total precipitation for the CMFD and TPMFD datasets (a, b), the corresponding bias (c, d) and the seasonal cycle of daily mean total precipitation (e).Unit: mm |
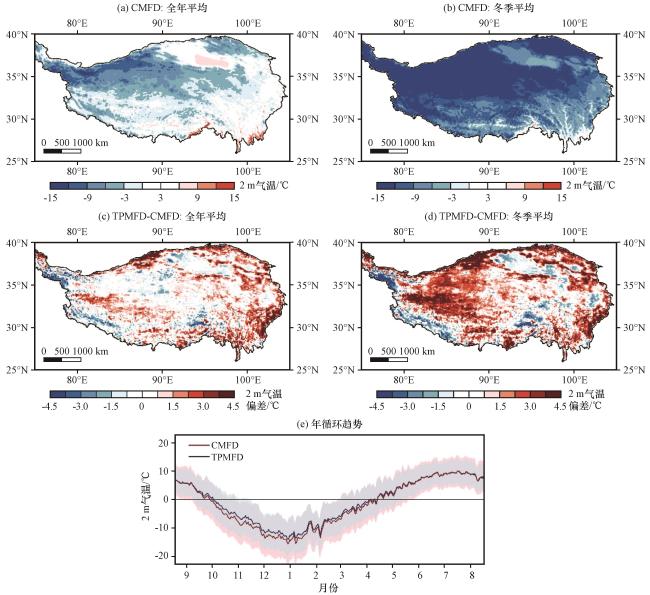
图3 CMFD和TPMFD数据集全年平均(a, c)和冬季平均(b, d)2 m气温(a, b)、 相应的偏差(c, d)的空间分布以及日平均2 m气温季节变化(e)(单位: ℃)图(e)中填色区域表示每日最高与最低气温 Fig.3 Spatial distribution of annual (a, c) and winter (b, d) mean 2 m air temperature for the CMFD and TPMFD datasets (a, b), the corresponding bias (c, d), and the seasonal cycle of daily mean 2 m air temperature (e).Unit: ℃The colored areas in (e) indicate daily maximum and minimum temperatures |
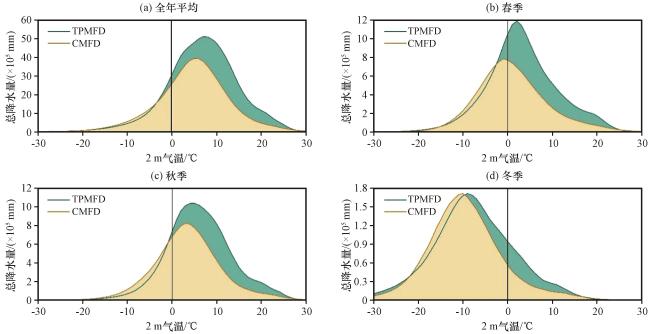
图4 青藏高原不同气温区间内全年(a)、 春季(b)、 秋季(c)、 冬季(d)累积总降水量对比(单位: ×105 mm)黑色实线表示降水转化为降雪的临界值 Fig.4 Comparison of cumulative total precipitation on the Qinghai-Xizang Plateau in different temperature intervals for annual (a), spring (b), autumn (c), and winter (d).The black solid line indicatesthe threshold for precipitation converts to snowfall.Unit: ×105 mm |
3.2 不同气象驱动数据对青藏高原积雪模拟的影响
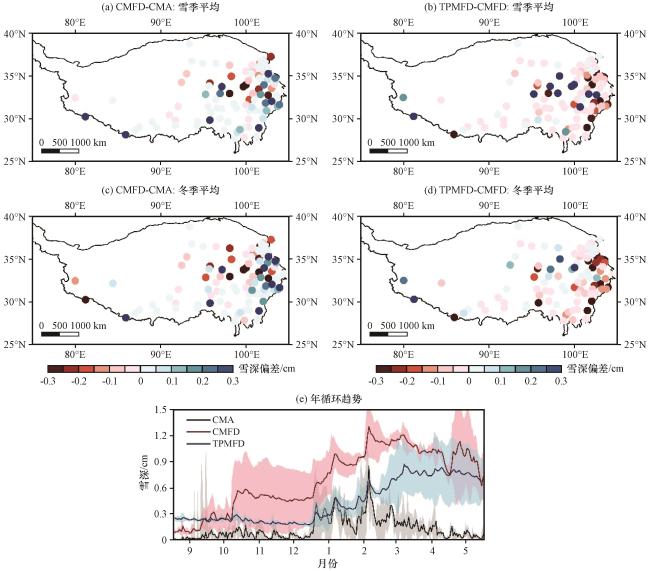
图5 青藏高原站点观测和模式输出的雪季平均(a, b)和冬季平均(c, d)雪深偏差(a, c, 单位: cm), CMFD与TPMFD数据集之间模拟的雪深偏差(b, d, 单位: cm)空间分布以及日平均雪深季节变化(e)图(e)中填色范围表示相应的标准差 Fig.5 Spatial distribution of snow depth bias from station observations and model simulations (a, c, unit: cm) over the Qinghai-Xizang Plateau for the snow season (a, b) and winter (c, d), the corresponding bias (b, d, unit: cm) between CMFD- and TPMFD-driven simulations, and the seasonal cycle of daily mean snow depth (e)The color filled ranges in (e) indicate the corresponding standard deviations |
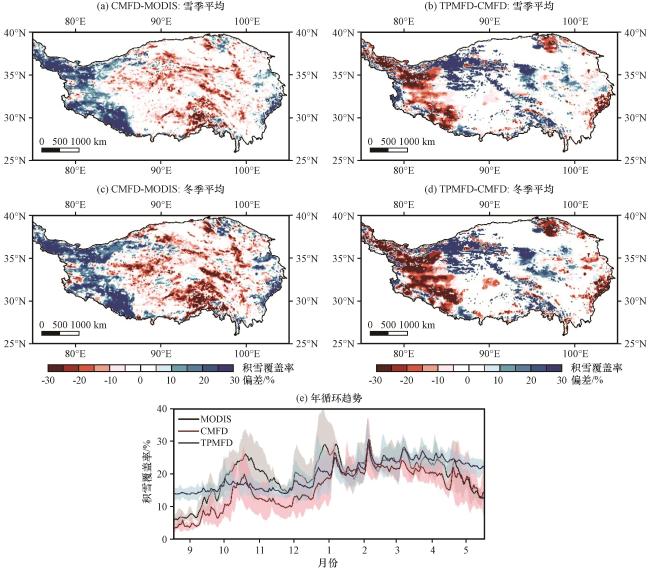
图6 青藏高原站点观测和模式输出的雪季平均(a, b)和冬季平均(c, d)积雪覆盖率偏差(a, c, 单位: %), CMFD与TPMFD数据集之间模拟的积雪覆盖率偏差(b, d, 单位: %)空间分布以及日平均积雪覆盖率季节变化(e)图(e)中填色范围表示相应的标准差 Fig.6 Spatial distribution of snow cover fraction bias from station observations and model simulations (a, c, unit: %) over the Qinghai-Xizang Plateau for the snow season (a, b) and winter (c, d), the corresponding bias (b, d, unit: %) between CMFD- and TPMFD-driven simulations, and the seasonal cycle of daily mean snow cover fraction (e)The color filled ranges in (e) indicate the corresponding standard deviations |
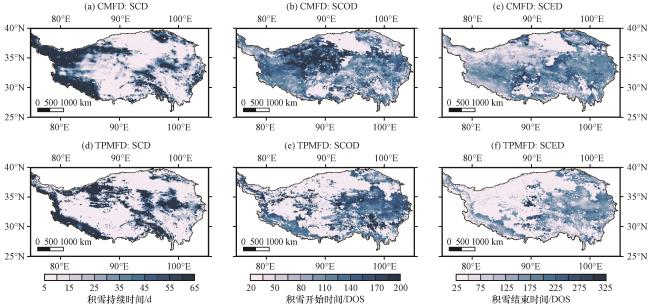
表1 CMFD与TPMFD数据驱动的模拟结果在青藏高原不同雪区的积雪物候指标差异Table 1 Differences in snow phenology indexes between CMFD and TPMFD dataset driven simulations in different snow areas over the Qinghai-Xizang Plateau |
| 积雪物候指标 | CMFD | TPMFD | ||
|---|---|---|---|---|
| 厚雪区 | 薄雪区 | 厚雪区 | 薄雪区 | |
| SCOD/DOS | 123 | 126 | 99 | 140 |
| SCED/DOS | 241 | 163 | 274 | 198 |
| SCD/d | 81 | 10 | 122 | 18 |
3.3 不同气象驱动数据对青藏高原地表能量平衡模拟的影响
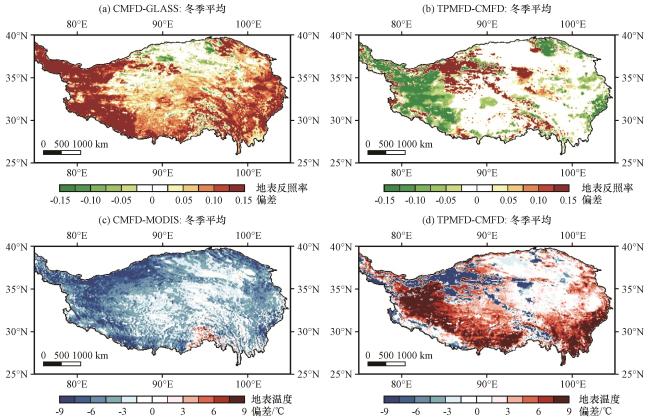
图8 青藏高原观测和模式输出的冬季平均地表反照率(a)与地表温度偏差(c, 单位: ℃)以及CMFD与TPMFD数据集及反照率之间模拟的地表温度偏差(b, d)的空间分布Fig.8 Spatial distribution of winter mean surface albedo (a) and land surface temperature bias (c, unit: ℃) in observation and model output over the Qinghai-Xizang Plateau and simulation bias between CMFD and TPMFD datasets (b, d) |