

1 引言
2 资料来源和方法介绍
2.1 资料来源
2.2 方法介绍
2.3 天气实况
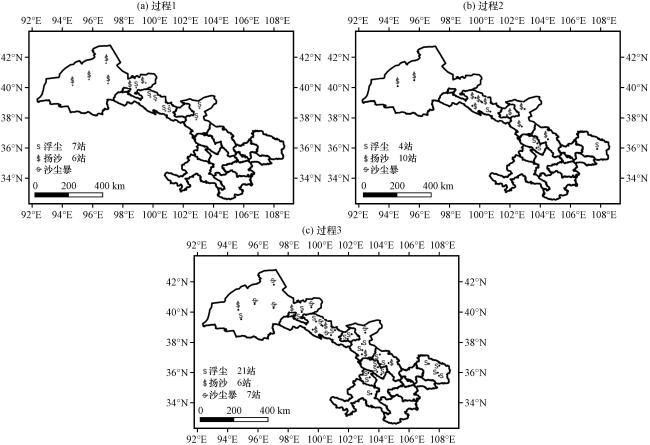
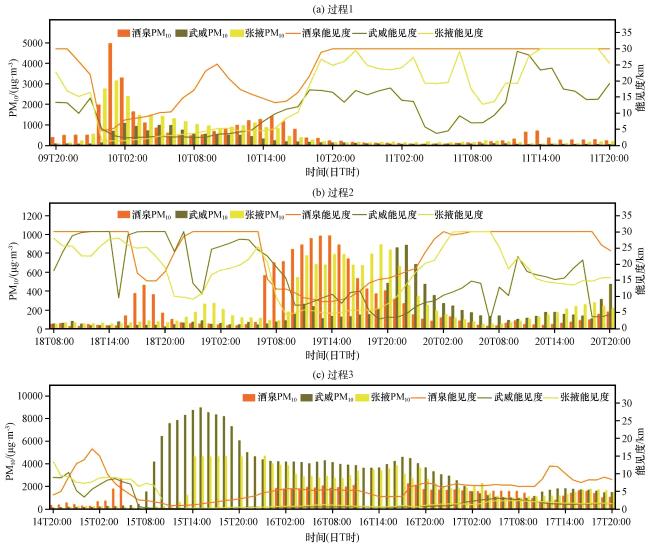
3 结果与分析
3.1 气候背景
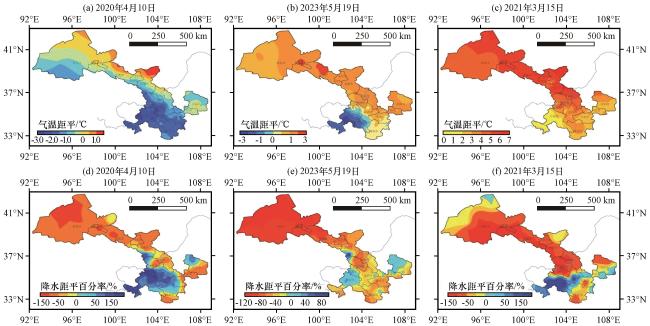
3.2 环流形势
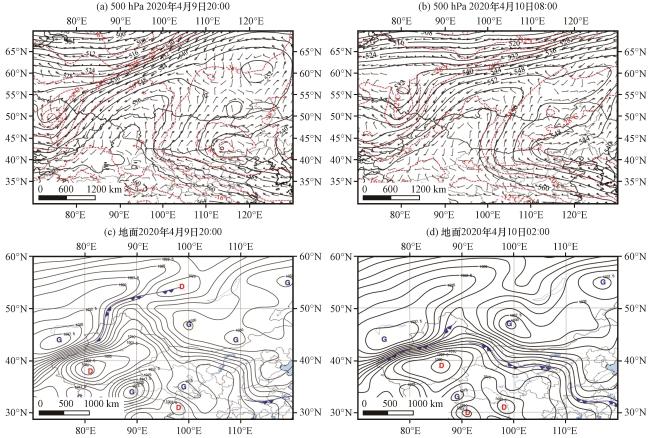
图4 2020年4月9日20:00(a)、 10日08:00(b)500 hPa环流形势场及4月9日20:00(c)、 10日02:00(d)地面气压场(c)和(d)中黑色实线为等高线或等压线, 灰色虚线为等温线, 锯齿线为冷锋位置, 字母G和D分别为高压、 低压中心 Fig.4 Circulation situation field of 500 hPa at 20:00 on 9 April, 2020 (a) and at 08:00 on 10 April (b), and surface pressure at 20:00 on 9 April (c) and at 02:00 on 10 April (d).In (c) and (d), the black solid line is the isohypse or isobar, gray dashed line is isotherm, and the jagged line is the cold front, the letters G and D represent high and low pressure centers, respectively |
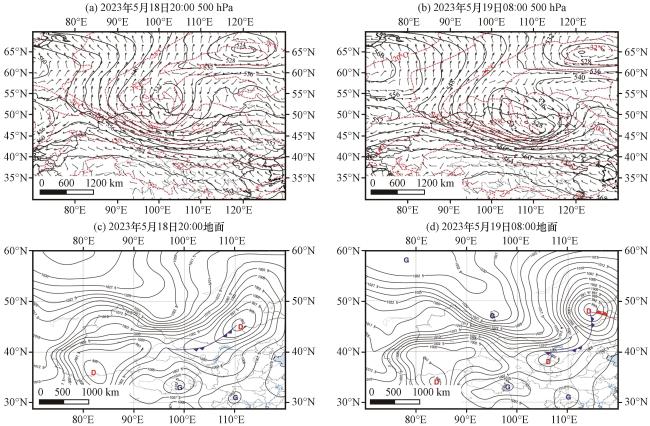
图5 2023年5月18日20:00(a)、 19日08:00(b)500 hPa环流形势场及5月18日20:00(c)、 19日08:00(d)地面气压场, (c)和(d)中黑色实线为等高线或等压线, 灰色虚线为等温线, 锯齿线为冷锋位置, 字母G和D分别为高压、 低压中心Fig.5 Circulation situation field of 500 hPa at 20:00 on May 18, 2023 (a) and 08:00 on May 19 (b), and surface pressure at 20:00 on 18 May (c) and at 08:00 on 19 May (d).In (c) and (d), black solid line is the isohypse or isobar, gray dashed line is isotherm, and the jagged line is the cold front, the letters G and D represent high and low pressure centers, respectively |
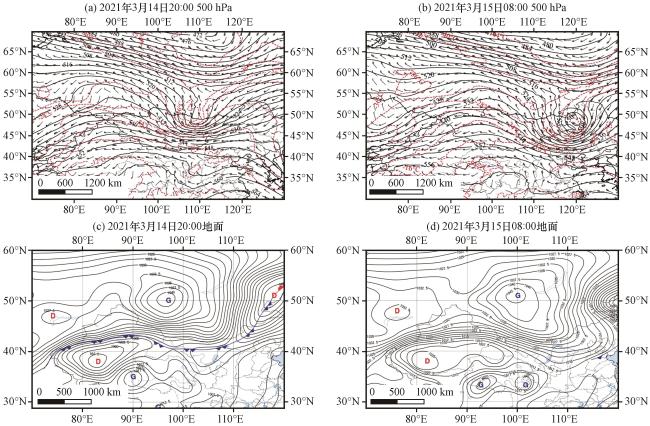
图6 2021年3月14日20:00(a)、 15日08:00(b)500 hPa环流形势场及3月14日20:00(c)、 15日08:00(d)地面气压场(c)和(d)中黑色实线为等高线或等压线, 灰色虚线为等温线, 锯齿线为冷锋位置, 字母G和D分别为高压、 低压中心 Fig.6 Circulation situation field of 500 hPa at 20:00 on 14 March, 2021 (a) and at 08:00 on 15 March (b), and surface pressure at 20:00 on 14 March (c) and at 08:00 on 15 March (d).In (c) and (d), black solid line is the isobar or isohypse, gray dashed line is isotherm, and the jagged line is the cold front, the letters G and D represent high and low pressure centers, respectively |
3.3 沙尘热动力物理量特征
3.3.1 垂直速度
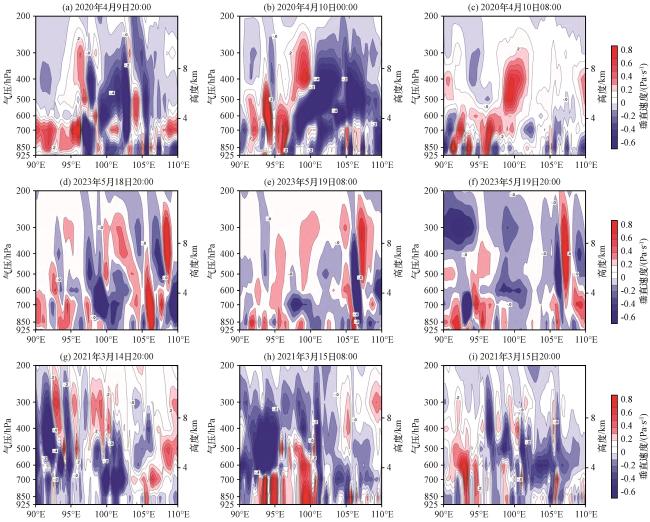
3.3.2 温度平流
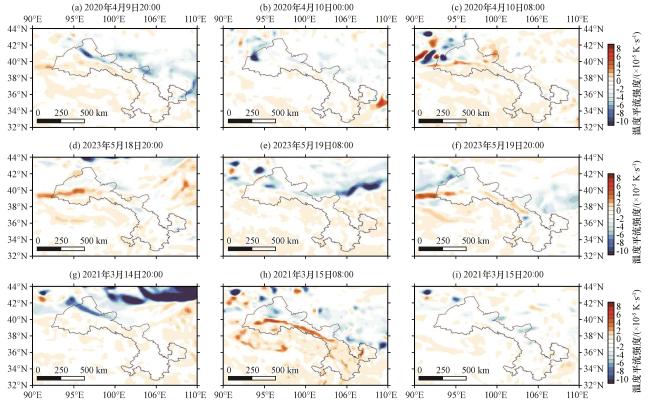
3.3.3 水平螺旋度
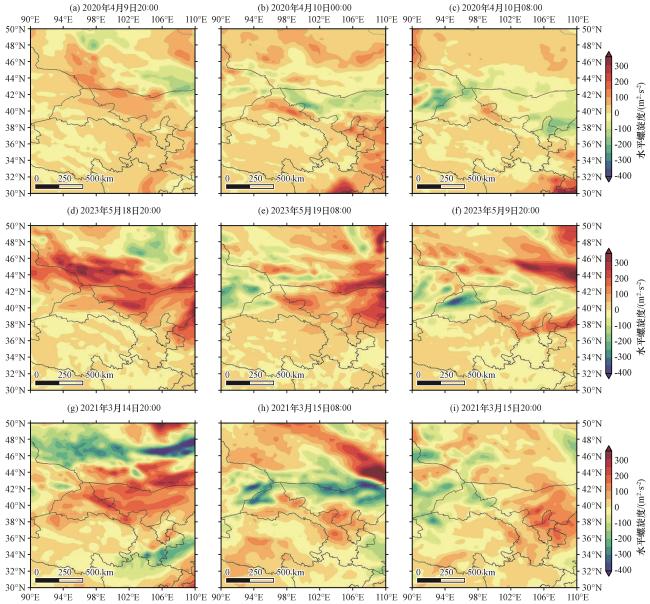
3.4 沙尘传输特征
3.4.1 后向轨迹与遥感传输路径
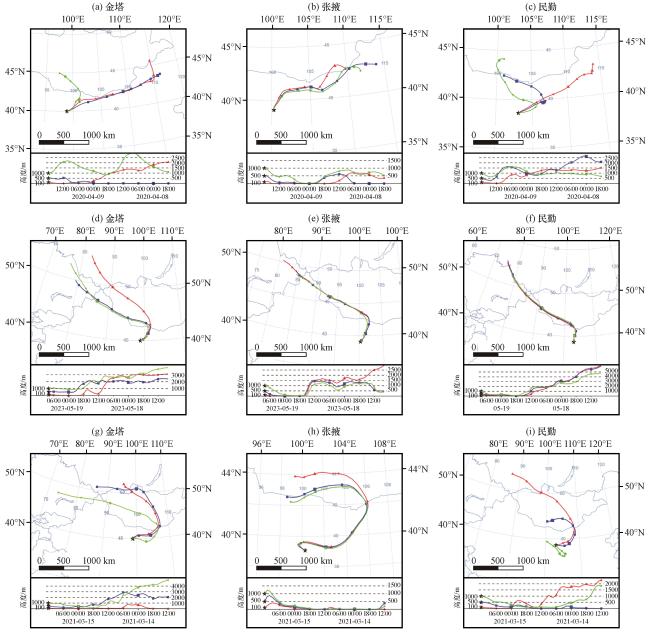
图10 金塔(左)、 张掖(中)、 民勤(右)48 h后向轨迹(a~c) 2020年4月10日02:00; (d~f) 2023年5月19日16:00; (g~i) 2021年3月15日14:00 Fig.10 48-hour backward trajectories of Jinta (left), Zhangye (middle), and Minqin (right). (a~c) 02:00 on 10 April, 2020; (d~f) 16:00 on 19 May, 2023; (g~i) 14:00 on 15 March, 2021 |
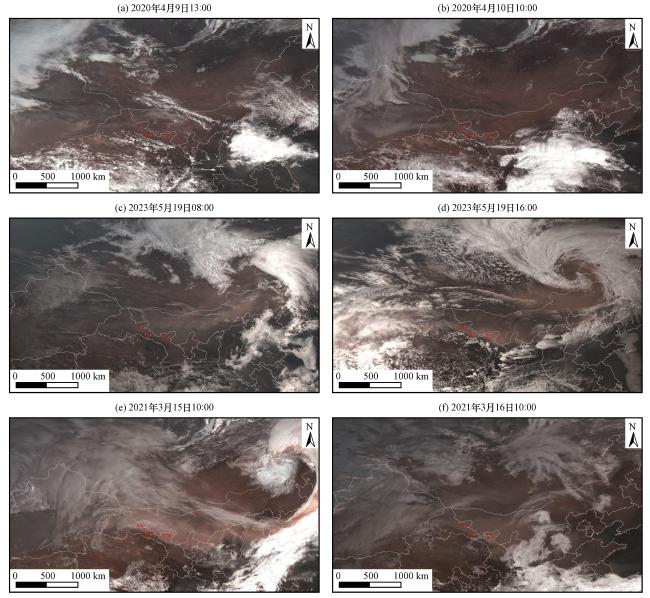
图11 2020年4月9日13:00(a)、 4月10日10:00(b), 2023年5月19日08:00、 16:00(c, d), 2021年3月15日10:00、 16日10:00(e, f)葵花8、 9号真彩图像(A、 B、 C分别为金塔、 张掖、 民勤)Fig.11 True-color images from Himawari-8 and Himawari-9 at 13:00 on April 9, 2020 and 10:00 on April 10, 2020 (a, b); 08:00 and 16:00 on May 19, 2023 (c, d); 10:00 on March 15, 2021 and 10:00 on March 16, 2021 (e, f), (A, B, and C are Jinta, Zhangye and Minqin, respectively) |
3.4.2 潜在源区分布及其相对贡献
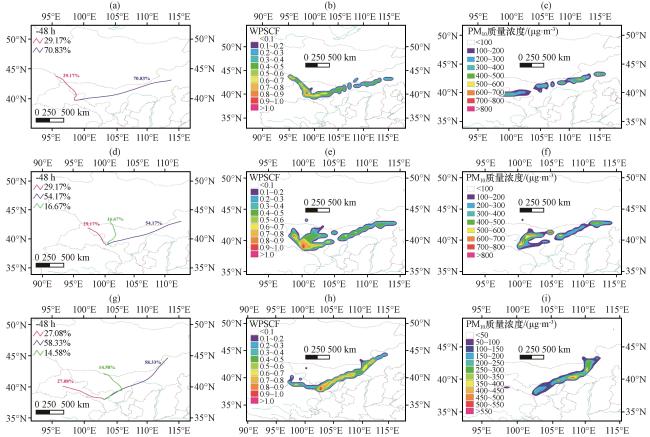
图12 酒泉(上)、 张掖(中)、 武威(下)在2020年4月沙尘过程的沙尘轨迹聚类(a, d, g, 单位: %)、 WPSCF(b, e, h)及PM10质量浓度(c, f, i, 单位: μg·m-3)分布特征Fig.12 The distribution characteristics of sand dust trajectory clustering (a, d, g, unit: %), WPSCF (b, e, h), and PM10 mass concentration (c, f, i, unit: μg·m-3) during the April 2020 sandstorm process in Jiuquan (top), Zhangye (middle), and Wuwei (bottom) |
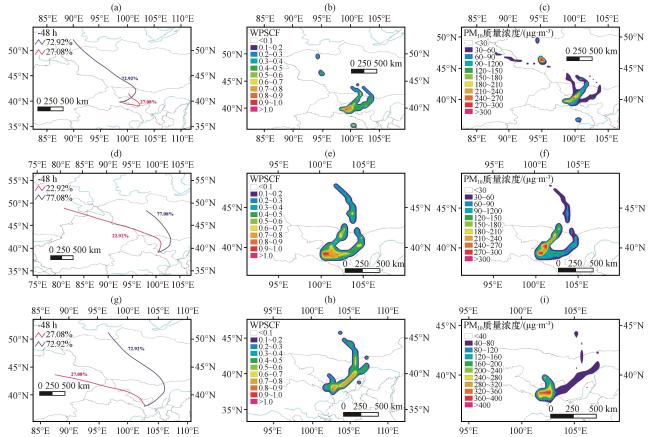
图13 酒泉(上)、 张掖(中)、 武威(下)在2023年5月沙尘过程的沙尘轨迹聚类(a, d, g, 单位: %)、 WPSCF(b, e, h)及PM10质量浓度(c, f, i, 单位: μg·m-3)分布特征Fig.13 The distribution characteristics of sand dust trajectory clustering (a, d, g, unit: %), WPSCF (b, e, h), and PM10 mass concentration (c, f, i, unit: μg·m-3) during the May 2023 sandstorm process in Jiuquan (top), Zhangye (middle), and Wuwei (bottom) |
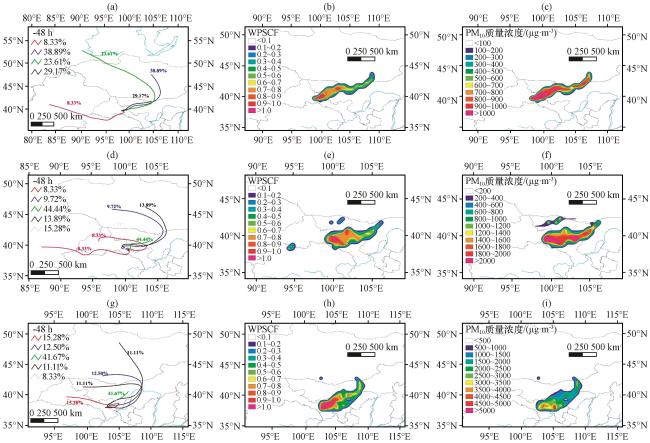


图14 酒泉(上)、 张掖(中)、 武威(下)在2021年3月沙尘过程的沙尘轨迹聚类(a, d, g, 单位: %)、 WPSCF(b, e, h)及WCWT(c, f, i, 单位: μg·m-3)分布特征Fig.14 The distribution characteristics of sand dust trajectory clustering (a, d, g, unit: %), WPSCF (b, e, h), and PM10 mass concentration (c, f, i, unit: μg·m-3) during the March 2021 sandstorm process in Jiuquan (top), Zhangye (middle), and Wuwei (bottom) |