
1 引言
2 资料来源和方法介绍
表1 初筛所依据的特征物理量及阈值Table 1 Characteristic physical quantities and thresholds for preliminary screening |
| 类型 | 斜压锋生类 | 高空冷平流强迫类 | 低层暖平流强迫类 |
|---|---|---|---|
| 特征物理量 | 地面温度梯度 | 500 hPa温度平流 | 850 hPa温度平流 |
| 08:00阈值 | 2.267×10⁻⁵ K·m-1 | -8.602×10⁻⁶ K·s-1 | 1.101×10⁻⁵ K·s-1 |
| 20:00阈值 | 2.628×10⁻⁵ K·m-1 | -9.257×10⁻⁶ K·s-1 | 1.529×10⁻⁵ K·s-1 |
3 短时强降水的偏差特征
3.1 系统性偏差特征
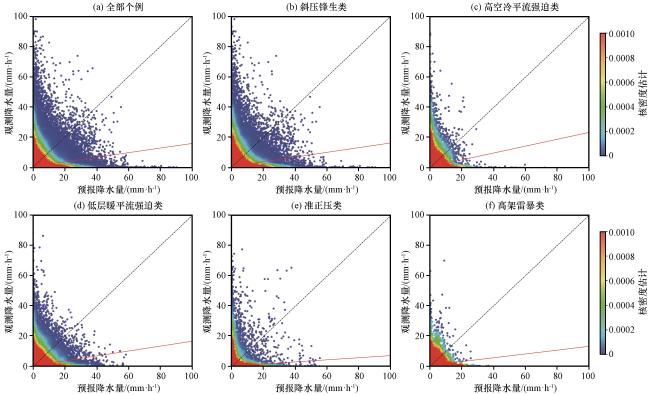
图2 CMA-GD(R3)前日20:00起报的全部个例(a)及各类型(b~f)短时强降水过程的逐时降水量观测-预报散点密度图(填色: 核密度估计, 采用高斯核)Fig.2 Hourly precipitation observation-forecast scatter density plots (shading: kernel density estimation using a Gaussian kernel) for all cases (a) and various types of STHR events (b~f) by CMA-GD(R3) initiated at 20:00 on the previous day |
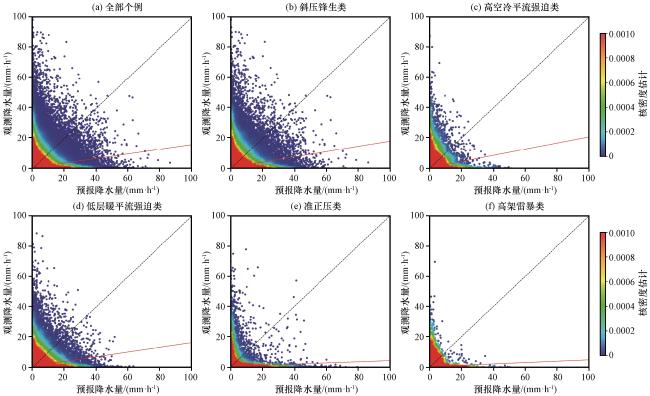
图3 CMA-GD(R3)当日08:00起报的全部个例(a)及各类型(b~f)短时强降水过程的逐时降水量观测-预报散点密度图(填色: 核密度估计, 采用高斯核)Fig.3 Hourly precipitation observation-forecast scatter density plots (shading: kernel density estimation using a Gaussian kernel) for all cases (a) and various types of STHR events (b~f) by CMA-GD(R3) initiated at 08:00 on the current day |
3.2 极端降水偏差特征
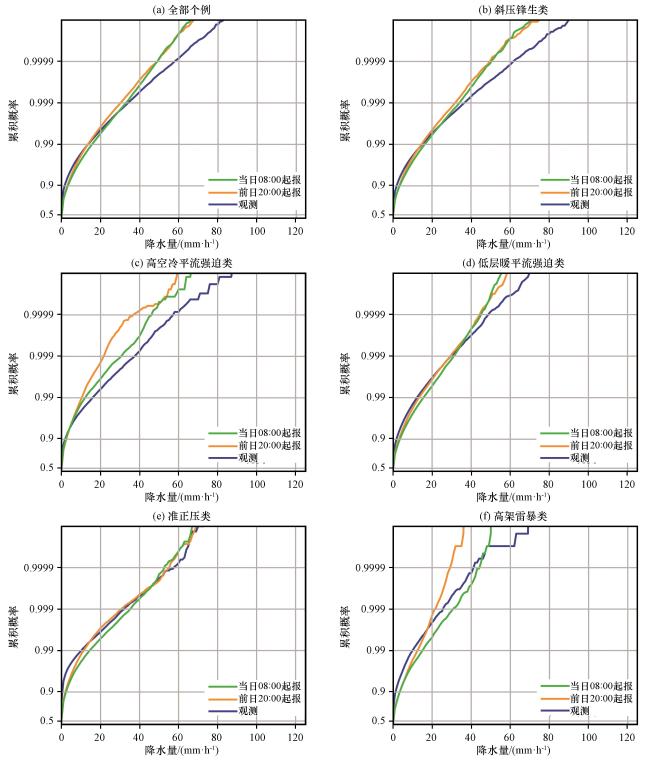

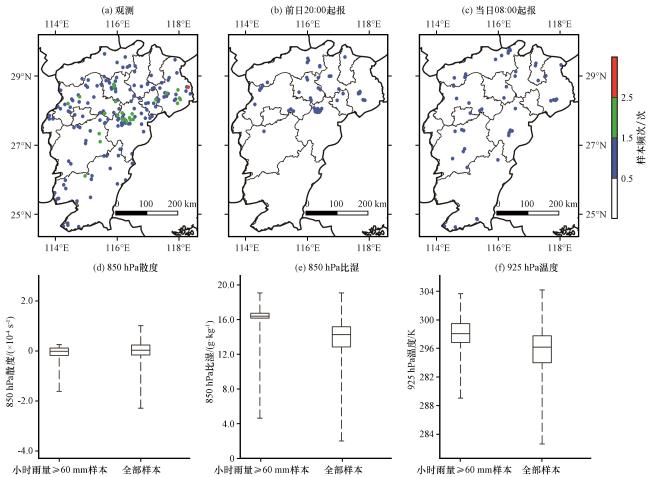
图7 观测(a)、 CMA-GD(R3)前日20:00起报(b)和当日08:00起报(c)小时雨量≥60 mm样本频次的空间分布; 小时雨量≥60 mm样本及全部样本850 hPa散度(d)、 850 hPa比湿(e)和925 hPa温度(f)箱线图箱线图中下边界为最小值; 箱的底部、 中间和顶部分别为下四分位数、 中位数和上四分位数; 上边界为最大值 Fig.7 The spatial distribution of sample frequency with hourly precipitation ≥60 mm for observation (a), CMA-GD(R3) initiated at 20:00 on the previous day (b) and at 08:00 on the current day (c).The boxplots of 850 hPa divergence (d), 850 hPa specific humidity (e), and 925 hPa temperature (f) for samples with hourly precipitation ≥60 mm and for all samples.In (d)~(f), the lower boundary represents the minimum value, the bottom, middle, and top of the box correspond to the lower quartile, median, and upper quartile, respectively, and the upper boundary represents the maximum value |
4 偏差成因分析
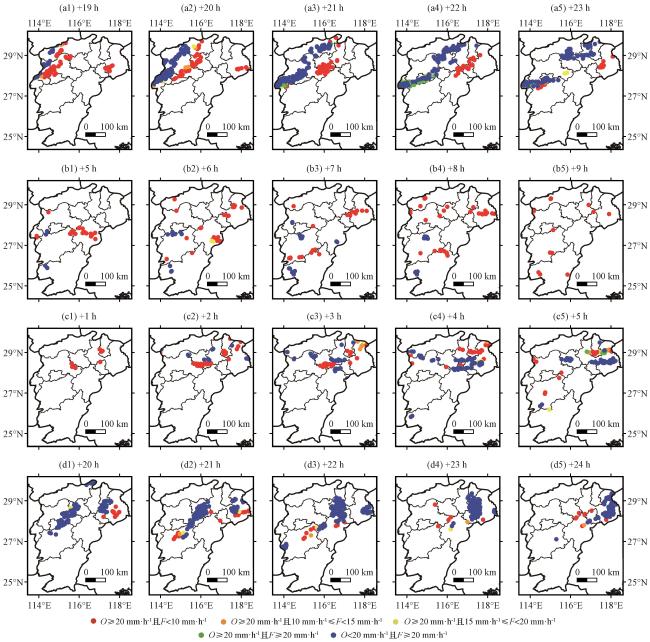
图8 典型短时强降水个例观测-预报匹配情况空间分布散点图(a1)~(a5): 2021年5月10日08:00起报, (b1)~(b5): 2021年8月17日08:00起报, (c1)~(c5): 2021年6月30日08:00起报, (d1)~(d5): 2021年5月12日20:00起报.O表示观测, F表示预报, + h数表示预报时效 Fig.8 Scatter plots of observation-forecast pairs matching situation for typical STHR events.(a1)~(a5) initiated at 08:00 on 10 May 2021, (b1)~(b5) initiated at 08:00 on 17 August 2021, (c1)~(c5) initiated at 08:00 on 30 June 2021, (d1)~(d5) initiated at 20:00 on 12 May 2021.O represents observation, F represents forecast, and + hours indicates the forecast lead time |
4.1 斜压锋生类个例
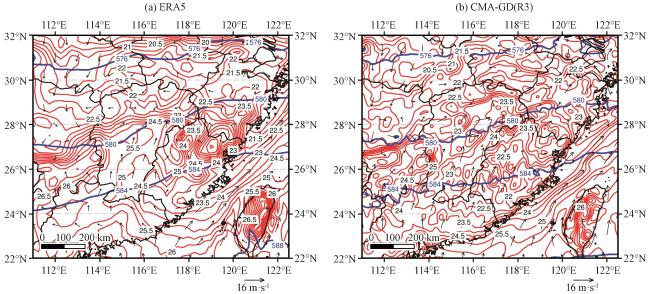
图9 斜压锋生类个例2021年5月11日06:00 ERA5(a)和CMA-GD(R3)(b)的500 hPa位势高度(蓝色等值线, 单位: dagpm)、 1000 hPa温度(红色等值线, 单位: ℃)和风场(矢量, 单位: m·s-1)Fig.9 500 hPa geopotential height (blue contour, unit: dagpm), 1000 hPa temperature (red contour, unit: ℃) and wind field (vector, unit: m·s-1) of ERA5 (a) and CMA-GD(R3) (b) at 06:00 on 11 May 2021 for barocline frontogenesis case |
4.2 高空冷平流强迫类个例
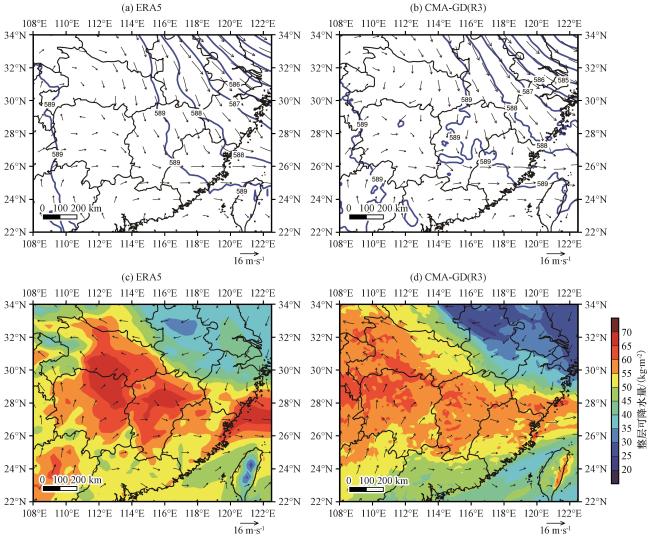
图10 高空冷平流强迫类个例2021年8月17日16:00 ERA5(a, c)和CMA-GD(R3)(b, d)的500 hPa位势高度(蓝色等值线, 单位: dagpm)和风场(矢量, 单位: m·s-1)(a, b), 整层可降水量(填色, 单位: kg·m-2)和850 hPa风场(矢量, 单位: m·s-1)(c, d)Fig.10 500 hPa geopotential height (blue contour, unit: dagpm) and wind field (vector, unit: m·s-1) (a, b), total column water vapour (shading, unit: kg·m-2) and 850 hPa wind field (vector, unit: m·s-1) (c, d) of ERA5 (a, c) and CMA-GD(R3) (b, d) at 16:00 on 17 August 2021 for high-level cold-advection-forced case |
4.3 低层暖平流强迫类个例
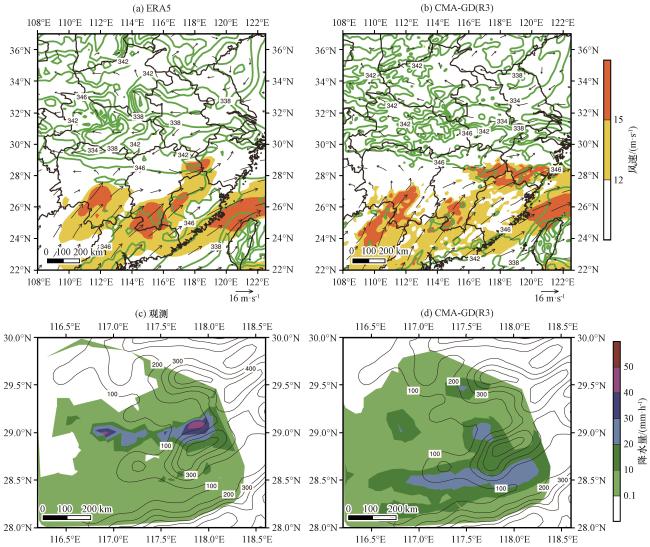
图11 低层暖平流强迫类个例2021年6月30日13:00 ERA5(a)和CMA-GD(R3)(b)的850 hPa相当位温(绿色等值线, 单位: K)、 风场(矢量, 单位: m·s-1)和风速(填色, 单位: m·s-1), 观测(c)和CMA-GD(R3)预报(d)的小时降水量(填色, 单位: mm·h-1)和海拔(黑色等值线, 单位: m)Fig.11 850 hPa equivalent potential temperature (green contour, unit: K), wind field (vector, unit: m·s-1) and wind speed (shading, unit: m·s-1) of ERA5 (a) and CMA-GD(R3) (b), hourly precipitation (shading, unit: mm·h-1) and altitude (black contour, unit: m) of observation (c) and CMA-GD(R3) (d) at 13:00 on 30 June 2021 for low-level warm-advection-forced case |
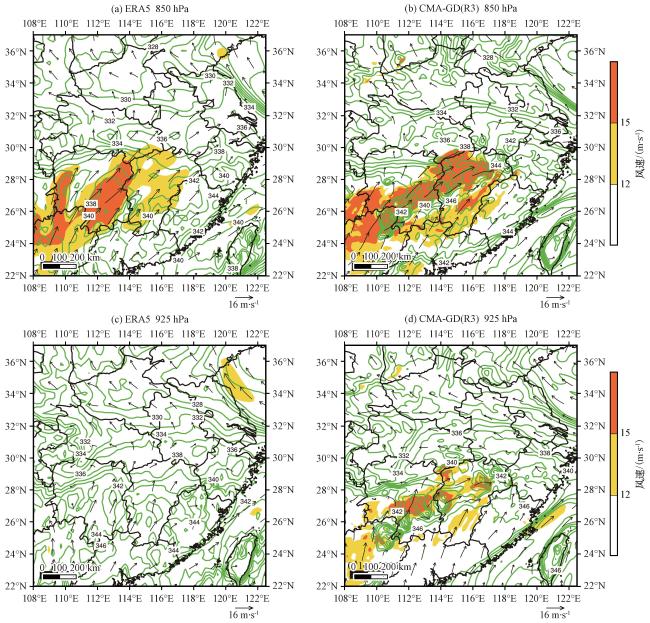
图12 低层暖平流强迫类个例2021年5月13日18:00 ERA5(a, c)和CMA-GD(R3)(b, d)的850 hPa(a, b)和925 hPa(c, d)相当位温(绿色等值线, 单位: K)、 风场(矢量, 单位: m·s-1)和超过12 m·s-1的风速(填色, 单位: m·s-1)Fig.12 850 hPa (a, b) and 925 hPa (c, d) equivalent potential temperature (green contour, unit: K), wind field (vector, unit: m·s-1) and wind speed that over 12 m·s-1 (shading, unit: m·s-1) of ERA5 (a, c) and CMA-GD(R3) (b, d) at 18:00 on 13 May 2021 for low-level warm-advection-forced case |
4.4 准正压类个例
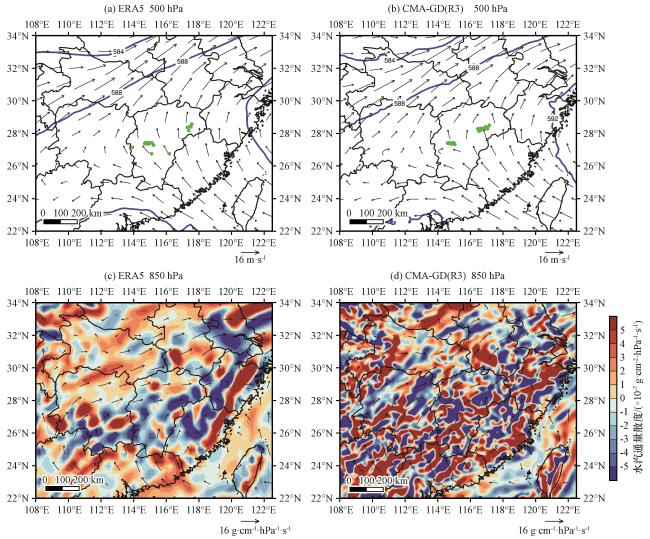
图13 准正压类个例2021年8月27日17:00 ERA5(a, c)和CMA-GD(R3)(b, d)的500 hPa位势高度(蓝色等值线, 单位: dagpm)和风场(矢量, 单位: m·s-1)(a, b), 850 hPa水汽通量(矢量, 单位: g·cm-1·hPa-1·s-1)和水汽通量散度(填色, 单位: ×10-7 g·cm-2·hPa-1·s-1)(c, d)图(a)和(b)中, 绿色圆点分别表示17:00 -18:00观测和CMA-GD(R3)预报的短时强降水站点 Fig.13 500 hPa geopotential height (blue contour, unit: dagpm) and wind vector (vector, unit: m·s-1) (a, b), 850 hPa water vapor flux (vector, unit: g·cm-1·hPa-1·s-1) and water vapor flux divergence (shading, unit: ×10-7 g·cm-2·hPa-1·s-1) (c, d) of ERA5 (a, c) and CMA-GD(R3) (b, d) at 17:00 on 27 August 2021 for quasi-barotropic case.In (a) and (b), the green dots represent the observation and CMA-GD(R3) forecast of STHR stations during 17:00 -18:00 respectively |