
1 引言
2 资料来源与方法介绍
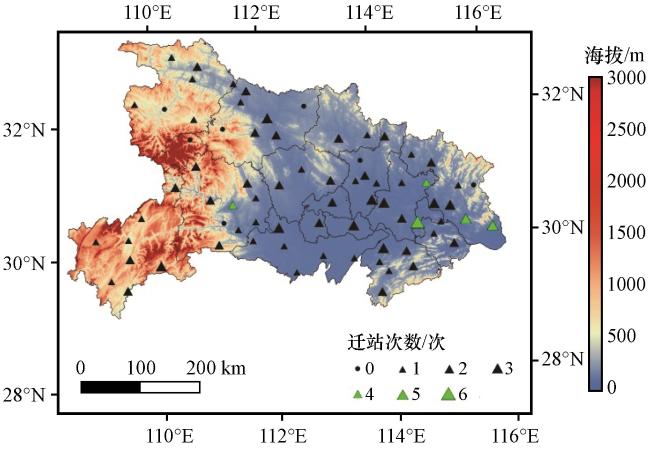
2.1 资料来源
2.2 研究方法
2.2.1 非均一性检验方法
2.2.2 参考序列的建立
2.2.3 显著断点的判断与订正
2.2.4 非均一性偏差及贡献率
3 结果与分析
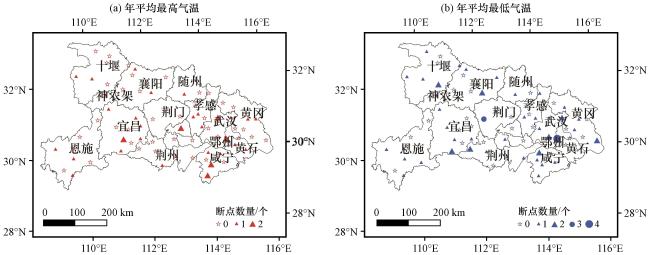
3.1 非均一性检验结果分析
3.2 湖北省年气温序列的非均一性影响
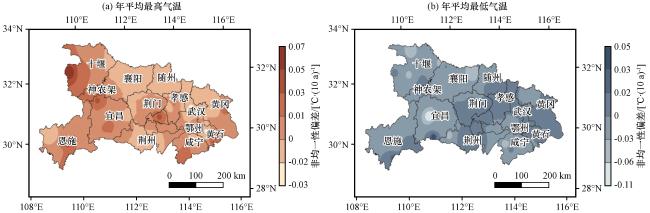
3.2.1 区域年气温序列的非均一性影响
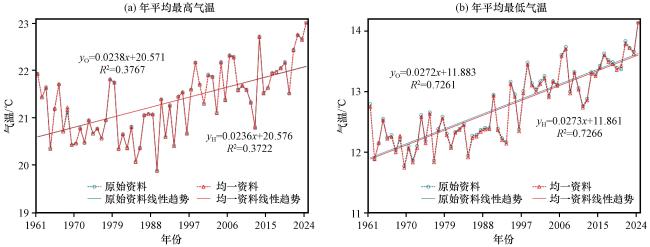
图3 1961 -2024年湖北省原始资料和均一资料的年平均最高(a)、 最低(b)气温变化Fig.3 The variation of the original and homogenized annual average maximum (a) and minimum (b) temperatures in Hubei Province from 1961 to 2024.y O, y H indicate original and homogenized temperature series respectively y O、 y H分别表示原始气温序列和均一气温序列 |
3.2.2 各台站年气温序列的非均一性影响
3.3 湖北省四季气温序列的非均一性影响
3.3.1 区域四季气温序列的非均一性影响
表1 1961 -2024年湖北省四季气温变化及非均一性影响Table 1 The variation and inhomogeneity effect of the temperature in four seasons in Hubei Province from 1961 to 2024 |
| 季节 | 平均最高气温 | 平均最低气温 | ||||||
|---|---|---|---|---|---|---|---|---|
| 原始资料 /℃ | 均一资料 /℃ | 非均一性偏差/[℃·(10a)-1] | 非均一性贡献率/% | 原始资料 /℃ | 均一资料 /℃ | 非均一性偏差 /[℃·(10a)-1] | 非均一性贡献率/% | |
| 春季 | 21.38 | 21.39 | 0.0002 | 0.03 | 12.18 | 12.19 | 0.0008 | 0.26 |
| 夏季 | 31.61 | 31.59 | 0.0014 | 1.64 | 23.15 | 23.13 | 0.0005 | 0.27 |
| 秋季 | 22.31 | 22.32 | -0.0033 | -1.38 | 13.64 | 13.63 | 0.0015 | 0.50 |
| 冬季 | 9.84 | 9.87 | -0.0034 | -1.97 | 1.80 | 1.82 | -0.0013 | -0.42 |
3.3.2 各台站四季气温序列的非均一性影响
表2 1961 -2024年湖北省各台站四季气温序列变化速率被高估和低估的非均一性影响Table 2 The inhomogeneity effect on the variation rates overestimated and underestimated of the temperature series in four seasons in all stations of Hubei Province from 1961 to 2024 |
| 季节 | 平均最高气温 | 平均最低气温 | ||||||
|---|---|---|---|---|---|---|---|---|
| 非均一性偏差/[℃·(10a)-1] | 非均一性贡献率/% | 非均一性偏差/[℃·(10a)-1] | 非均一性贡献率/% | |||||
| 被高估 | 被低估 | 被高估 | 被低估 | 被高估 | 被低估 | 被高估 | 被低估 | |
| 春季 | 0.002 | -0.002 | 0.39 | -0.33 | 0.002 | -0.001 | 0.73 | -0.53 |
| 夏季 | 0.003 | -0.001 | 3.57 | -1.28 | 0.001 | -0.002 | 1.12 | -2.03 |
| 秋季 | 0.002 | -0.005 | 0.78 | -2.56 | 0.003 | -0.005 | 1.76 | -2.37 |
| 冬季 | 0.004 | -0.004 | 1.64 | -2.32 | 0.001 | -0.002 | 0.40 | -0.88 |
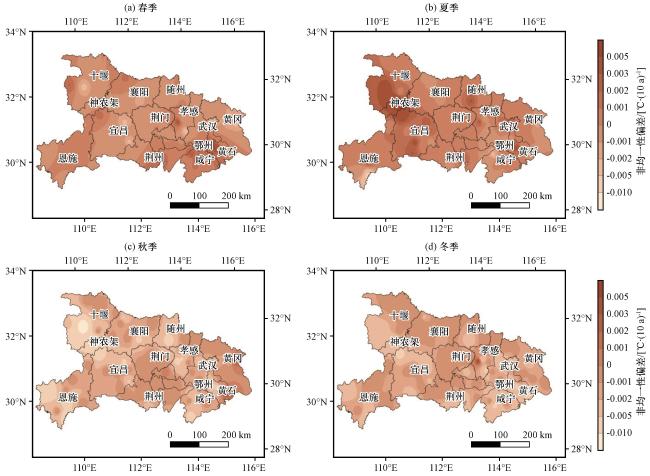
图5 1961 -2024年湖北省各台站春季(a)、 夏季(b)、 秋季(c)、 冬季(d)平均最高气温非均一性偏差的空间分布[单位: ℃·(10a)-1]Fig.5 The spatial distribution of inhomogeneity biases of the average maximum temperatures of all stations in spring (a), summer (b), autumn (c), winter (d) in Hubei Province from 1961 to 2024.Unit: ℃·(10a)-1 |
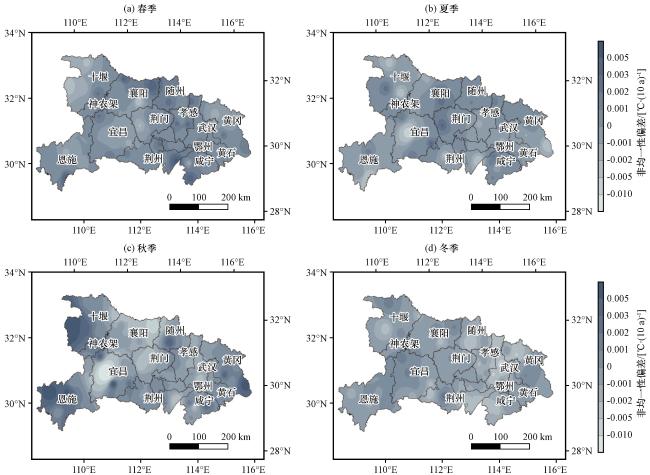
图6 1961 -2024年湖北省各台站春季(a)、 夏季(b)、 秋季(c)、 冬季(d)平均最低气温非均一性偏差的空间分布[单位: ℃·(10a)-1]Fig.6 The spatial distribution of inhomogeneity biases of the average minimum temperatures of all stations in spring (a), summer (b), autumn (c), winter (d) in Hubei Province from 1961 to 2024.Unit: ℃·(10a)-1 |
3.4 非均一性影响最显著的台站分析
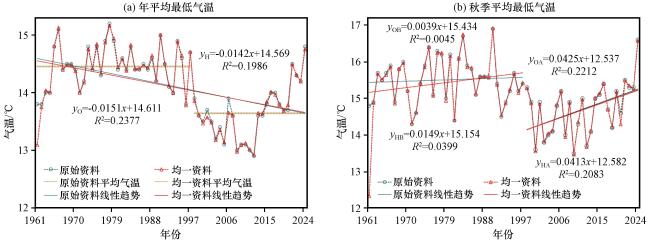
图7 1961 -2024年秭归站迁站前、 后原始资料和均一资料的年及秋季平均最低气温变化 yO、 yH分别表示原始气温序列和均一气温序列; yOB、 yOA分别表示迁站前、 后原始气温序列; yHB、 yHA分别表示迁站前、 后均一气温序列Fig.7 The variation of the annual and autumn average minimum temperatures based on original and homogenized data in Zigui station before and after station relocation from 1961 to 2024.yO, yH indicate original and homogenized temperature series respectively; yOB, yOA indicate original temperature series before and after station relocation respectively; yHB, yHA indicate homogenized temperature series before and after station relocation respectively |