
1 引言
2 资料与方法
2.1 数据资料
2.2 研究方法
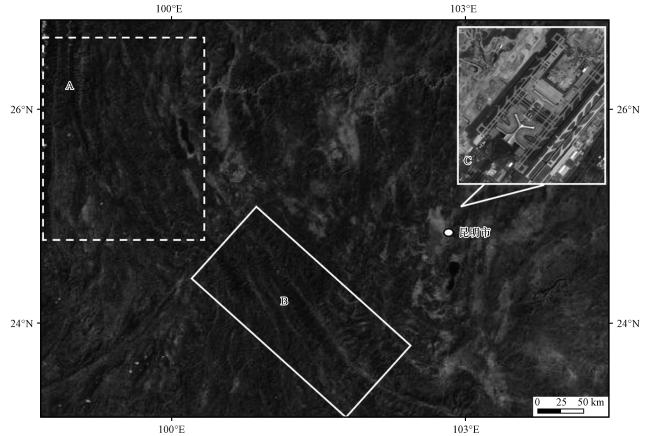
2.3 研究区域
3 灾害实况、 环流形势和影响系统
3.1 灾害实况
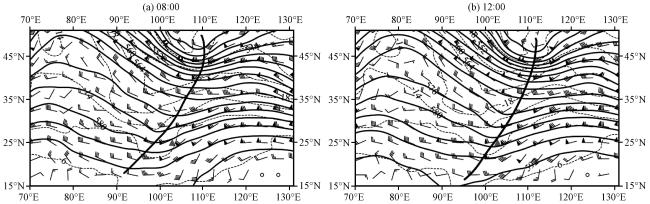
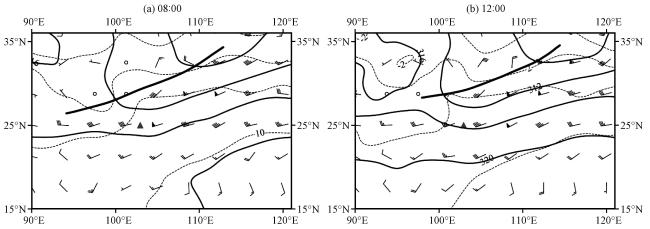
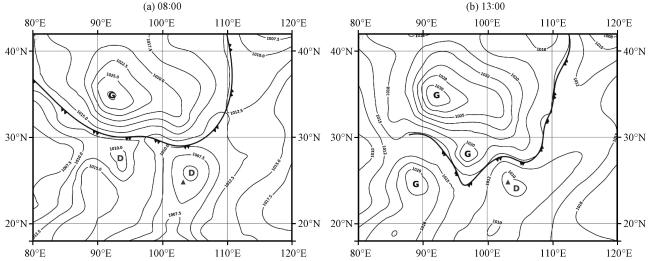
3.2 环流形势和影响系统
4 卫星云图上的重力波云系
4.1 两个重力波云系向机场移动
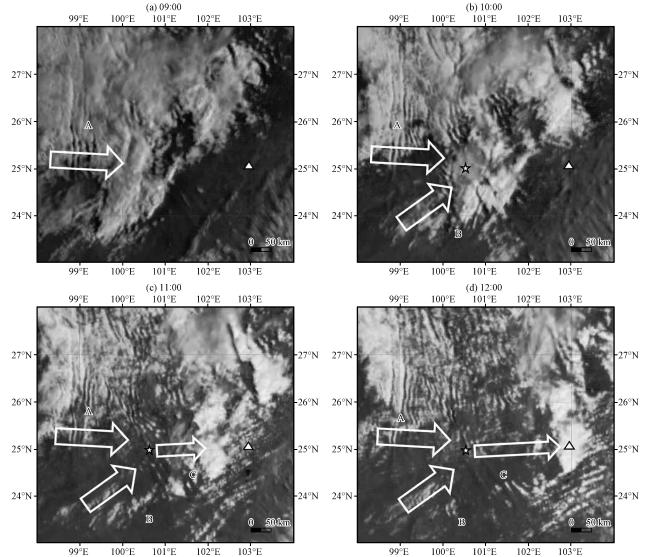
图6 2024年3月27日可见光云图(a)09:00, (b)10:00, (c)11:00, (d)12:00, 三角形表示长水机场, 五角星表示两个重力波相遇的点, 箭头表示重力波及其传播方向 Fig.6 Visible image at 09:00(a), 10:00 (b), 11:00(c), 12:00 (d) on 27 March 2024.Triangle is Changshui International Airport, arrow is gravity wave propagation direction, pentagram is the point where two waves met |
4.2 云系的云顶和云底高度
5 重力波动力学方程和相关参数分析
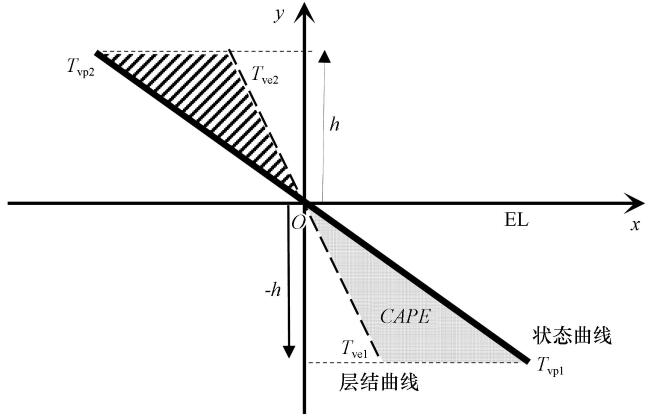
5.1 受力分析与重力波表达式分析
5.2 重力波相关参数分析
5.3 谐波分析
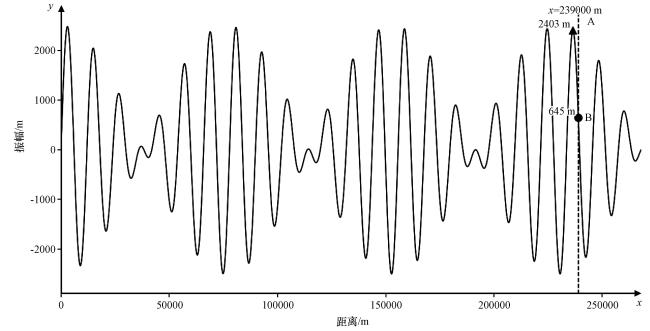
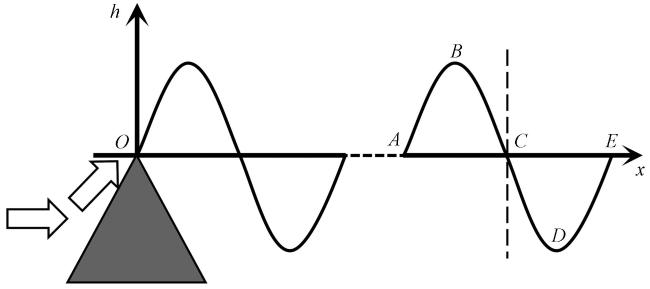
图9 重力波耦合后x方向波列图x轴上零点为两个重力波相遇的点, y轴上零点为3850 m的高空, 竖线为机场位置, 239000 m为重力波耦合点到机场的东西方向距离, 自A点(三角, 波峰, 振幅2403 m)到B点(圆点, 机场, 振幅645 m)为影响机场大风的重力波做功区域 Fig.9 The wave train diagram in the x-direction of the coupled gravity waves.The zero point on the x-axis indicates the intersection of the two gravity waves, the zero point on the y-axis represents an altitude of 3850 m, the vertical line denotes the airport location, 239000 m is the east-west distance from the gravity wave coupling point to the airport, The zone from point A (triangle, wave crest, amplitude 2403 m) to point B (circle, airport, amplitude 645 m) is the work region of the gravity wave affecting the strong winds at the airport |
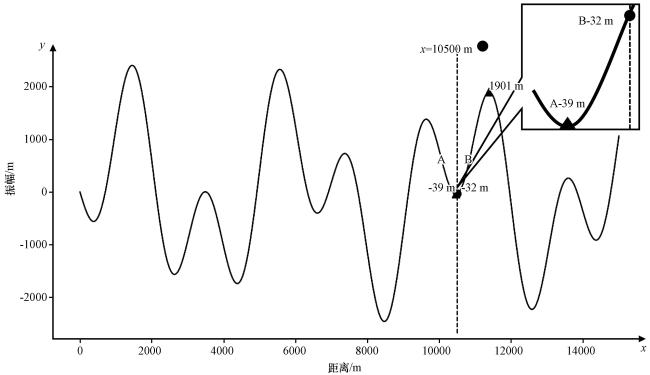
图10 耦合重力波y方向波列图x轴上零点为两个重力波相遇的点, y轴上零点为3850 m的高空, 竖线为机场位置, 10500 m为重力波耦合点到机场南北方向的距离, 自A点(三角, 波谷, 振幅-39 m)到B点(圆点, 机场, 振幅-32 m)为影响机场大风的重力波做功区域 Fig.10 The wave train diagram in the y-direction of the coupled gravity waves.The zero point on the x-axis indicates the intersection of the two gravity waves, the zero point on the y-axis represents an altitude of 3850 meters, the vertical line denotes the airport location, 10500 m is the north-south distance from the gravity wave coupling point to the airport, the zone from point A (triangle, wave trough, amplitude -39 m) to point B (circle, airport, amplitude -32 m) is the work region of the gravity wave affecting the strong winds at the airport |