
1 引言
2 数据来源与方法介绍
2.1 数据来源
2.2 研究方法
2.2.1 自编码器的特征数据集和识别
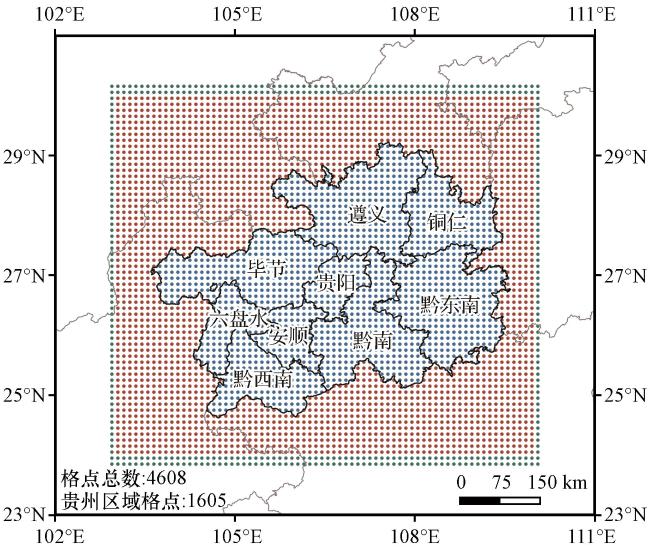
图1 研究区域CN01资料格点分布(红色-蓝色区域)绿色点为确保自编码器计算增加维度, 其中绿色-红色区域数值设为0 Fig.1 Distribution of grid points of CN01 dataset in the study area (red-blue area).The green points are included to ensure dimensionality augmentation in Autoencoder computations, with values set to zero in the green-red region |
2.2.2 自组织映射客观分类和显著区域检验
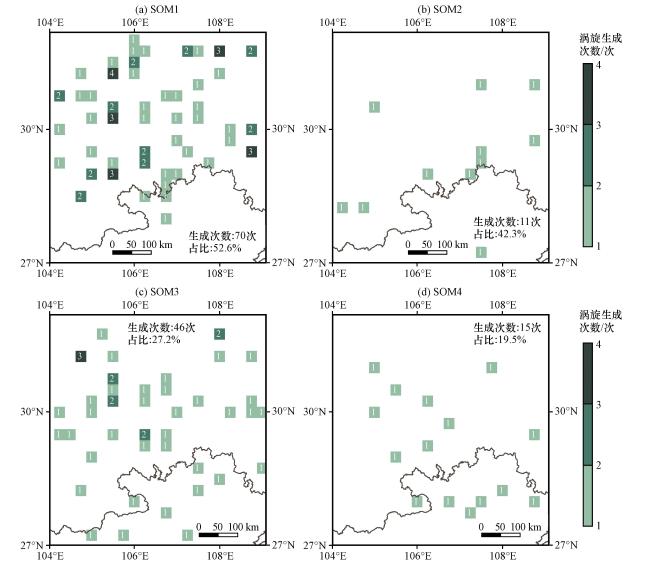
2.2.3 西南涡定义
3 结果与分析
3.1 降水空间分布特征
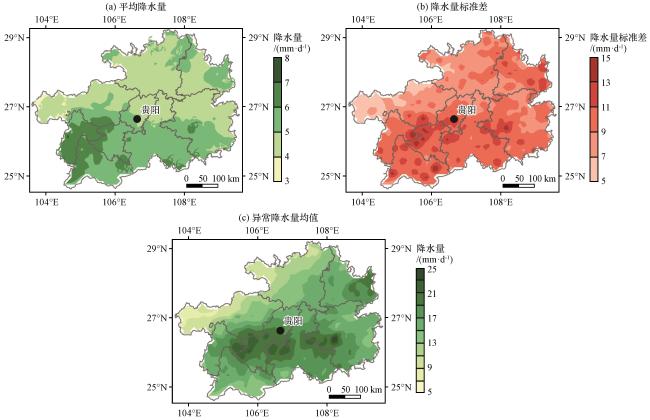
图2 1979 -2022年贵州暖季(5 -10月)气候平均降水量(a, 单位: mm·d-1), 降水量标准差(b, 单位: mm·d-1), 异常降水量均值(c, 单位: mm·d-1)的空间分布Fig.2 Spatial distribution of climate-averaged precipitation (a, unit: mm·d-1), standard deviation of precipitation (b, unit: mm·d-1), and averaged anomalous precipitation (c, unit: mm·d-1) for May-October in Guizhou from 1979 to 2022 |
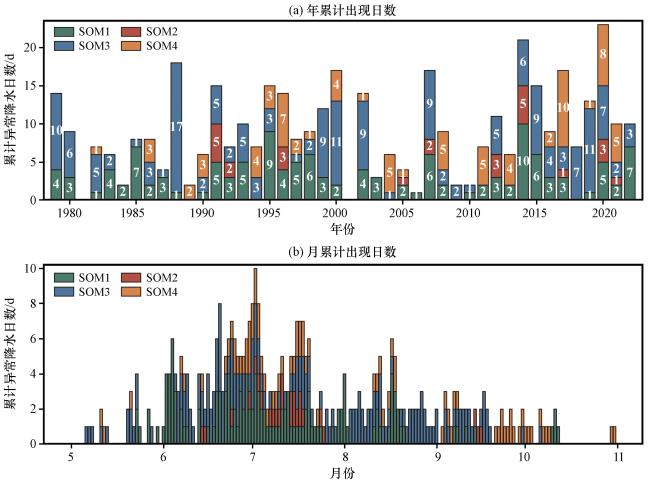
3.2 异常降水的典型类型及时间特征
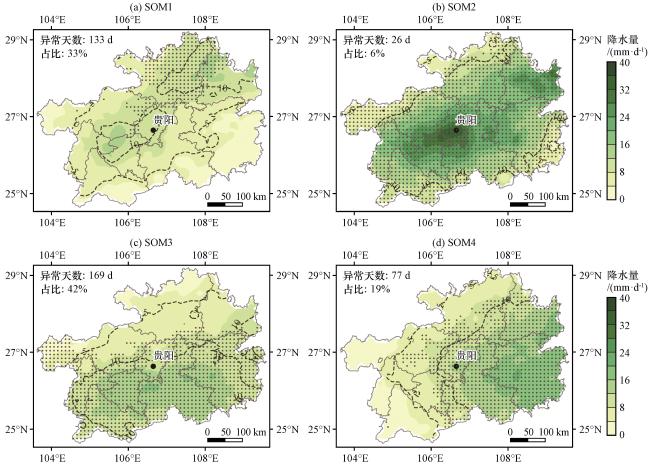
图3 4类异常降水事件降水量合成场(单位: mm·d-1)黑色打点区域为异常降水热点区域 Fig.3 Composite fields of precipitation (unit: mm·d-1) for four types of anomalous precipitation events.The black dotted areas denote hotspots of anomalous precipitation |
3.3 4类异常降水对应的环流和水汽输送特征
3.3.1 大尺度环流型差异
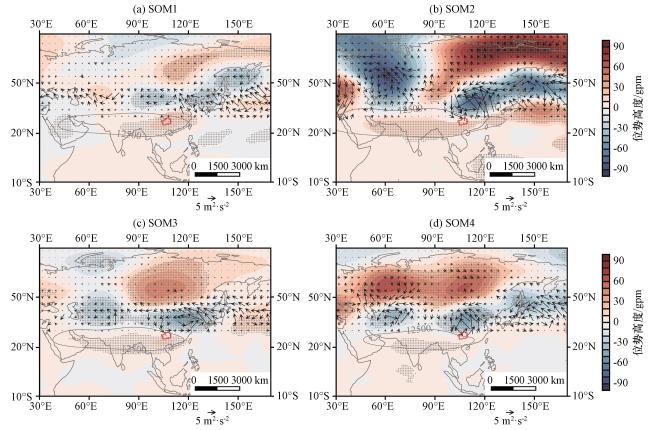
图5 贵州4类异常降水的200 hPa位势高度(填色, 单位: gpm, 灰色打点区域通过95%置信水平的显著性检验)和T-N波作用活动通量(箭头, 单位: m2·s-2)距平合成场红色实线为贵州省行政边界(下同) Fig.5 200 hPa potential height(shading, unit: gpm, the gray dotted area passing significant test at 95% confidence level) and T-N wave action activity flux (arrows, unit: m2·s-2) anomalous composite fields of four clusters of anomalous precipitation in Guizhou.The red solid lines denote the administrative boundaries of Guizhou Province (the same as after) |
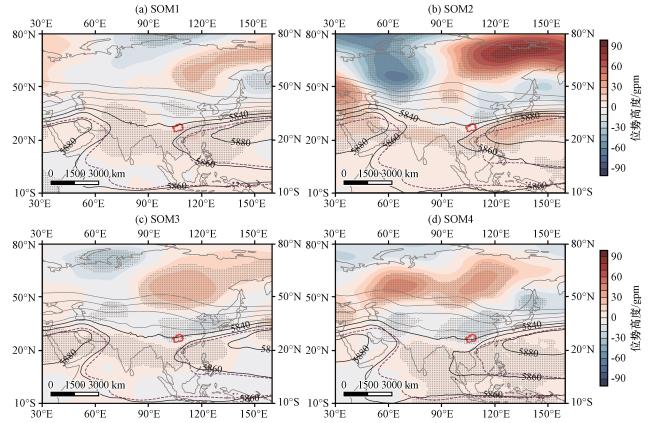
图6 贵州4类异常降水的500 hPa位势高度距平合成场(填色, 单位: gpm, 灰色打点区域通过95%置信水平的显著性检验)黑线为位势高度合成(紫色线为气候态5860 gpm线)Fig.6 500 hPa potential height anomaly(shading, unit: gpm, the gray dotted area passing significant test at 95% confidence level) composite fields of four clusters of anomalous precipitation in Guizhou.Black lines represent the composite geopotential height, and the purple line indicates the climatological 5860 gpm contour |
3.3.2 局地环流特征
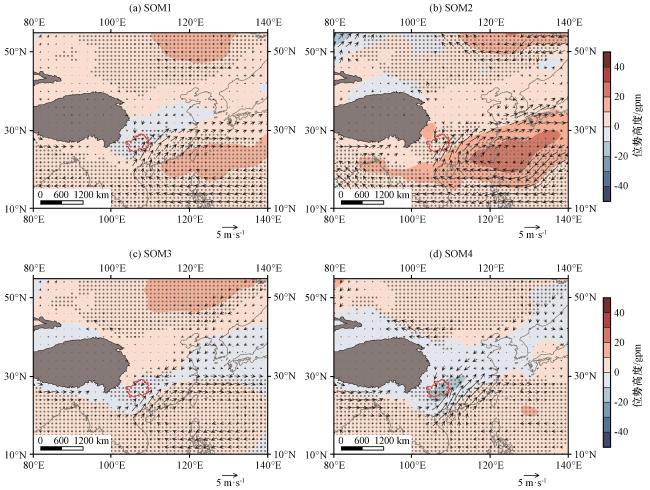
图7 贵州4类异常降水的850 hPa位势高度(填色, 单位: gpm, 打点区域通过95%置信水平的显著性检验)和风速(箭头, 单位: m·s-1)距平合成场Fig.7 850 hPa potential height (shading, unit: gpm, the dotted area passing significant test at 95% confidence level) and wind speed anomaly(arrows, unit: m·s-1) composite fields of four clusters of anomalous precipitation in Guizhou |
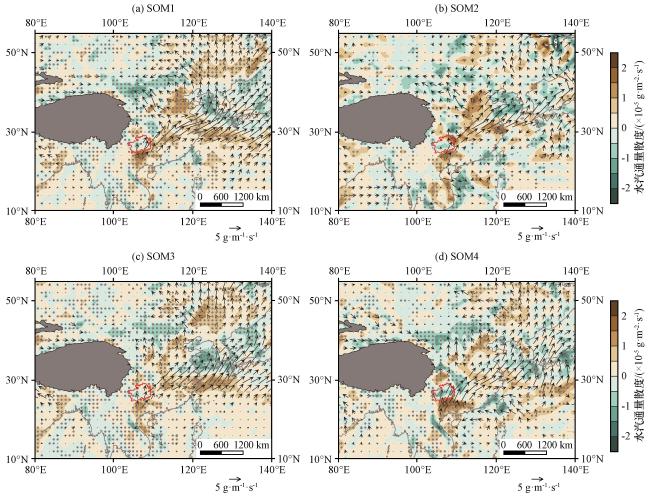
3.3.3 水汽来源及输送路径
图9 贵州4类异常降水的850 hPa水汽通量(箭头, 单位: g·m-1·s-1, 灰色打点区域通过90%置信水平的显著性检验)及散度(填色, 单位: ×10-5 g·m-2·s-1)距平合成场Fig.9 850 hPa water vapor flux(arrows, unit: g·m-1·s-1, the dotted area passing significant test at 90% confidence level) and vapor flux divergence(shading, unit: ×10-5 g·m-2·s-1) anomalous composite fields of four clusters of anomalous precipitation in Guizhou |