
1 引言
2 数据来源与方法介绍
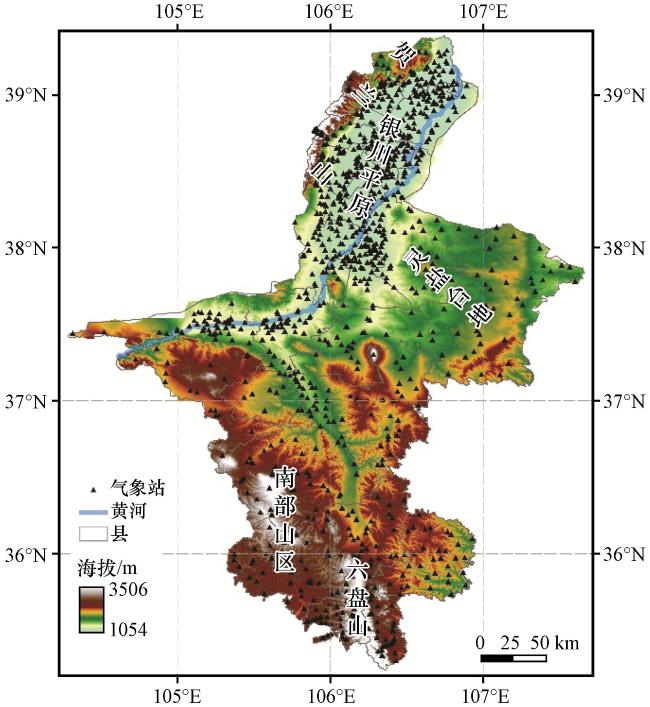
2.1 研究区概况
2.2 数据来源
2.3 暴雨特征量
2.4 标准差倍数
2.5 西太副高指数和南亚高压指数
3 特大暴雨的降水极端性特征
3.1 降水实况
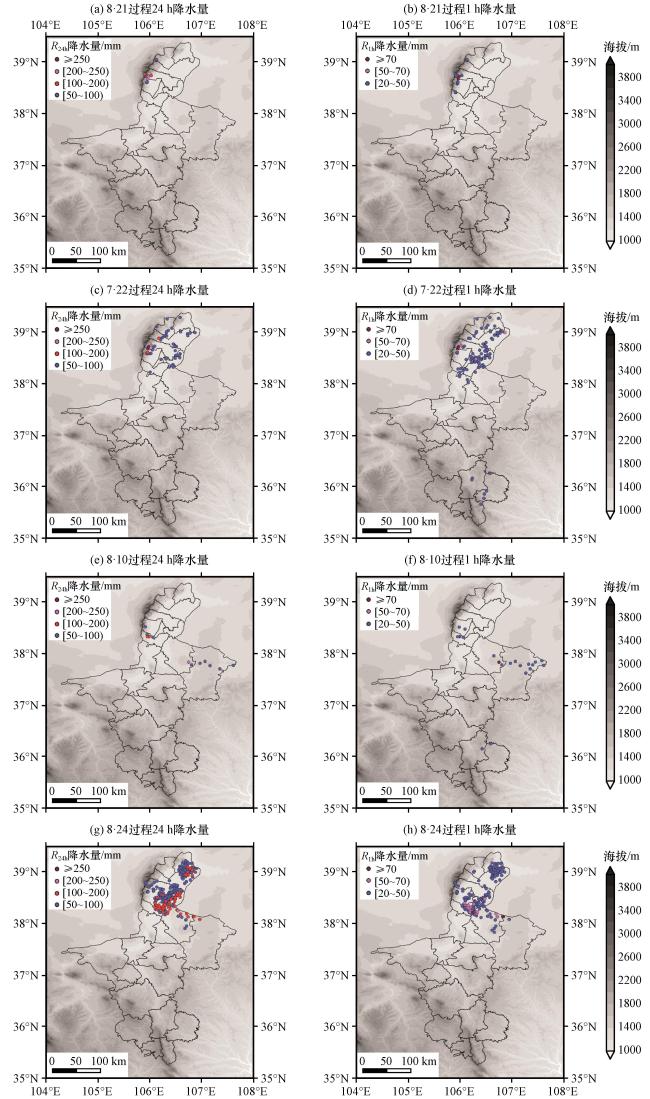
图2 宁夏特大暴雨日(a、 c、 e、 g)、 小时(b、 d、 f、 h)降水量分布(单位: mm)填色为海拔(单位: m) Fig.2 Daily (a、 c、 e、 g) and hourly (b、 d、 f、 h) precipitation distributions for extreme heavy rainstorms in Ningxia.Unit: mm. The shading is altitude (unit: m) |
表1 宁夏特大暴雨的特征量和降水情况Table 1 Characteristic quantities and precipitation of extreme heavy rainstorms in Ningxia |
| 特征量 | 降水过程 | ||||
|---|---|---|---|---|---|
| 8·21 | 7·22 | 8·10 | 8·24 | ||
| R 24h | R 24h≥50 mm站数(占总测站比率) | 9(1.1%) | 51(6.7%) | 12(1.3%) | 213(20.8%) |
| R 24h≥100 mm站数(占总测站比率) | 4(0.5%) | 9(1.2%) | 3(0.3%) | 59(5.7%) | |
| R 24h≥200 mm站数(占总测站比率) | 2(0.2%) | 4(0.5%) | 1(0.1%) | 1(1%) | |
| 最大降雨量(出现测站) | 241.7 mm(贺兰山滑雪场) | 296.9 mm(贺兰山滑雪场) | 212 mm(灵武西三社区) | 200 mm(灵武宁东中水回用厂) | |
| 暴雨中心F | 1.1 | 1.4 | 1.3 | 1.2 | |
| 突破历史极值站数 | / | 11 | / | / | |
| 突破当月历史极值站数 | / | 20 | / | / | |
| R 1h | R 1h≥20 mm站次 | 21 | 124 | 27 | 237 |
| R 1h≥50 mm站次 | 6 | 8 | 2 | 19 | |
| 最大降雨量(出现时段) | 82.5 mm(22日00:00 -01:00) | 74.1 mm(22日21:00 -22:00) | 89.5 mm(10日02:00 -03:00) | 78.5 mm(25日00:00 -01:00) | |
| 最大P 1h | 34.1% | 25% | 42.2% | 51.3% | |
| 最大P 3h | 82.9% | 62.1% | 94.2% | 99% | |
| 突破历史极值站次 | 6 | 25 | 8 | 89 | |
| 突破当月历史极值站次 | 11 | 33 | 11 | 166 | |
| R 5min | R 5min≥10 mm站次 | 7 | 31 | 8 | 16 |
| R 5min≥20 mm站次 | / | 2 | / | / | |
| 最大5min降雨量(出现时段) | 12.4 mm(21日21:40 -21:45) | 35 mm(23日01:00 -01:05) | 14.9 mm(10日02:45 -02:50) | 18 mm(24日07:25 -07:30) | |
| 最大P 5min | 16.1% | 47.2% | 16.6% | 24.8% | |
| 最大P 20min | 46.2% | 77.1% | 58.9% | 84.8% | |
| 突破历史极值站次 | 11 | 48 | 5 | 33 | |
| 突破当月历史极值站次 | 14 | 112 | 11 | 79 | |
/表示无值(/ indicates no value) |
3.2 降水极端性
表2 宁夏有气象观测记录以来排名前10的不同时效降水量Table 2 Top 10 precipitation of different time durations in Ningxia since meteorological observation records |
| 排名 | 测站 | R 24h/mm | 时间 | 测站 | R 1h/mm | 时间 | 测站 | R 5min/mm | 时间 |
|---|---|---|---|---|---|---|---|---|---|
| 1 | 滑雪场 | 296.9 | 2018年7月22日20:00至23日20:00 | 西三社区 | 89.5 | 2022年8月10月02:00 -03:00 | 丽景街办事处 | 35.8 | 2017年7月6日16:00 -16:05 |
| 2 | 拜寺沟 | 273.7 | 2018年7月22日20:00至23日20:00 | 红果子 | 84.5 | 2020年8月11日10:00 -11:00 | 滑雪场 | 35 | 2018年7月23日01:00 -01:05 |
| 3 | 滑雪场 | 241.7 | 2016年8月21日08:00至22日8:00 | 西三社区 | 84.2 | 2022年8月10日03:00 -04:00 | 滑雪场 | 21.5 | 2018年7月23日01:05 -01:10 |
| 4 | 岩画 | 233.0 | 2018年7月22日20:00至23日20:00 | 滑雪场 | 82.5 | 2016年8月22日00:00 -01:00 | 史店镇 | 19.9 | 2018年7月8日01:05 -01:10 |
| 5 | 拜寺沟 | 220.3 | 2016年8月21日08:00至22日08:00 | 拜寺沟 | 80.6 | 2016年8月21日23:00至22日00:00 | 头闸镇 | 19.5 | 2020年8月11日15:30 -15:35 |
| 6 | 贺兰山 | 211.5 | 1975年8月4日20:00至5日20:00 | 永宁望洪林场 | 78.5 | 2024年8月25日00:00 -01:00 | 下马关镇 | 19.5 | 2016年7月4日00:00 -00:05 |
| 7 | 西三社区 | 212.0 | 2022年8月9日20:00至10日20:00 | 拜寺沟 | 76.6 | 2016年8月21日21:00 -22:00 | 滑雪场 | 18.7 | 2018年7月22日21:35 -21:40 |
| 8 | 南水 | 207.1 | 2018年7月22日20:00至23日20:00 | 盐池县高沙窝镇宝塔村 | 76.5 | 2024年8月24日22:00 -23:00 | 黄铎堡镇 | 18.6 | 2017年8月26日15:25 -15:30 |
| 9 | 宁东中水回用厂 | 200.0 | 2024年8月24日08:00至25日08:00 | 滑雪场 | 74.1 | 2018年7月22日21:00 -22:00 | 彭阳 | 18.4 | 2010年9月3日16:20 -16:25 |
| 10 | 隆德联财镇恒光村 | 195.7 | 2024年7月22日20:00至23日20:00 | 临河镇 | 71.4 | 2018年8月9日12:00 -13:00 | 寨科镇 | 18.4 | 2018年8月11日09:45 -19:50 |
4 大气环流极端性
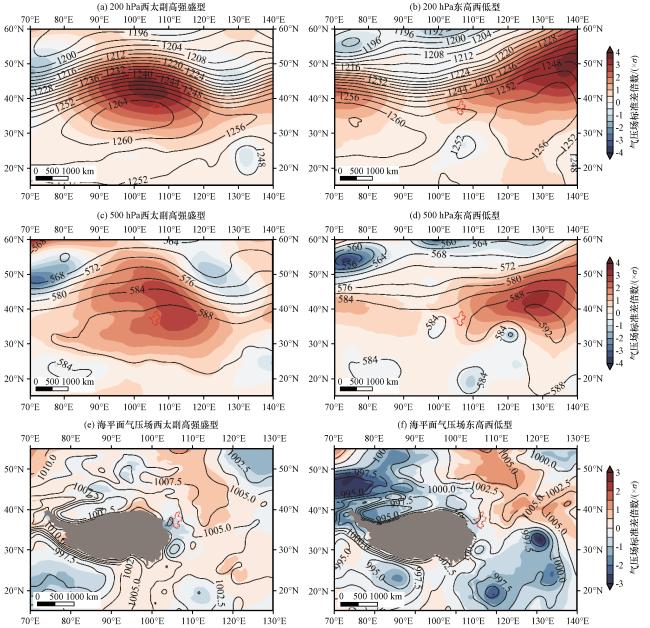
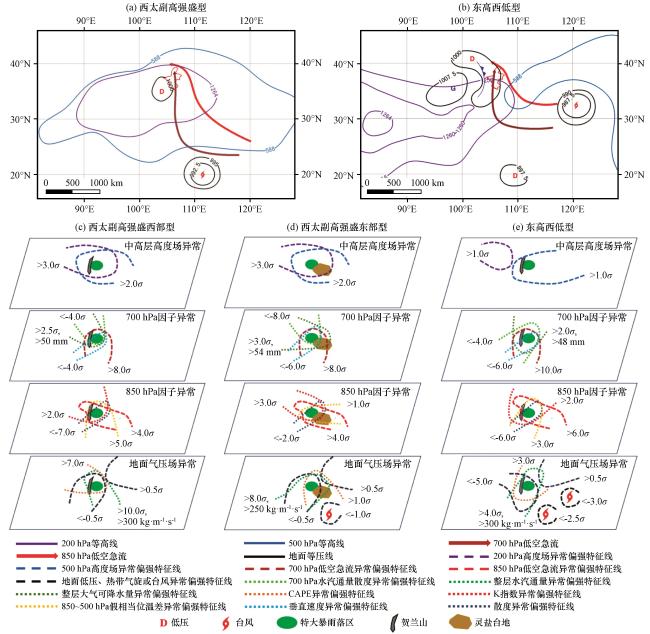
图3 宁夏西太副高强盛型(a、 c、 e)、 东高西低型(b、 d、 f)特大暴雨200 hPa(a~b)和500 hPa(c, d)位势高度场(黑色实线, 单位: dagpm)、 海平面气压场(e, f, 黑色实线, 单位: hPa)及位势高度场标准差倍数(a~f, 填色)红色轮廓表示宁夏边界(下同), 灰色阴影为青藏高原 Fig.3 Geopotential height (black solid line, unit: dagpm) at 200 hPa (a, b) and 500 hPa (c, d), sea level pressure (e, f, black solid line, unit: hPa), and the standardized anomaly multiples of geopotential height (a~f, shading) for extreme heavy rainstorms in Ningxia under the strong Western Pacific Subtropical High pattern (a, c, e) and east-high-west-low pattern (b, d, f).The red outline denotes the boundary of Ningxia (the same as after), the gray shadow is Qinghai-Xizang Plateau |
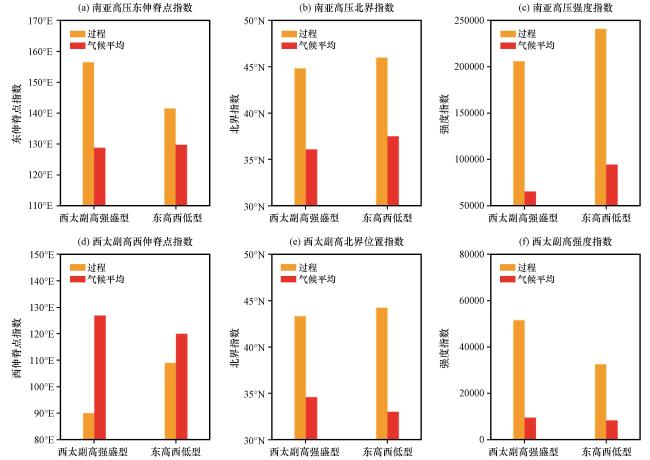
图4 宁夏特大暴雨过程期间南亚高压(a~c)和西太副高(d~f)指数与气候平均的对比(气候平均指1991 -2020年同期平均值)Fig.4 Comparison of South Asian High and Western Pacific Subtropical High indices with the climatological mean during the extreme heavy rainstorms in Ningxia (climatological mean denotes the average for the same period from 1991 to 2020) |
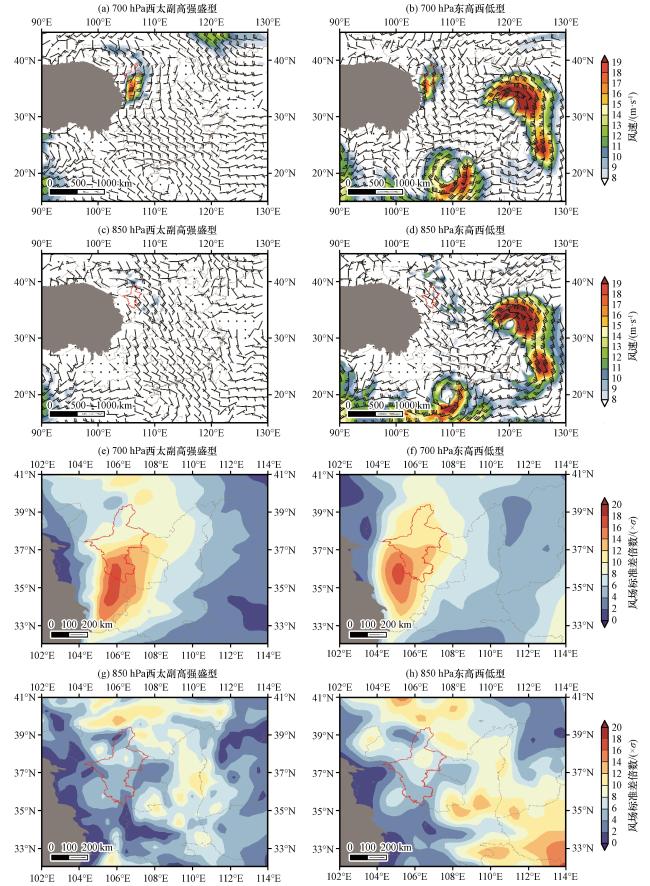
图5 宁夏西太副高强盛型(a、 c、 e、 g)、 东高西低型(b、 d、 f、 h)特大暴雨700 hPa(a~b)和850 hPa风场(c~d)及其标准差倍数(e~h, 彩色区)(a~d)中彩色区为风速(单位: m·s-1), 灰色阴影为青藏高原 Fig.5 Wind fields at 700 hPa (a~b) and 850 hPa (c~d), and their standardized anomaly multiples (e~h, colored area) for extreme heavy rainstorms in Ningxia under the strong Western Pacific Subtropical High pattern (a、 c、 e、 g) and east-high-west-low pattern (b、 d、 f、 h).In (a)~(d), the colored area is wind speed (unit: m·s-1).The gray shadow is Qinghai-Xizang Plateau |
5 热动力关键物理量极端性
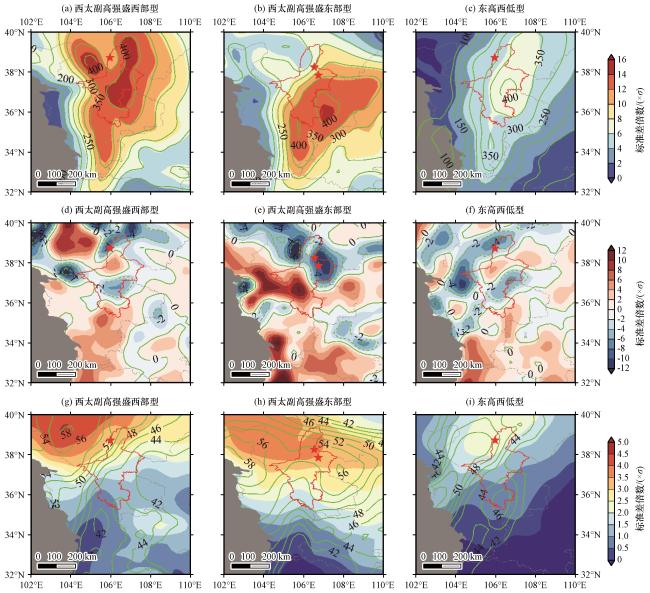
图6 宁夏西太副高强盛西部型(a、 d、 g)、 西太副高强盛东部型(b、 e、 h)、 东高西低型(c、 f、 i)特大暴雨主要降水时段整层(875~300 hPa)水汽通量(a~c, 绿色实线, 单位: kg‧m-1‧s-1)、 700 hPa水汽通量散度(d~f, 绿色实线, 单位: ×10-6 kg‧m-2‧hPa-1‧s-1)和整层可降水量(g~i, 绿色实线, 单位: mm)及其标准差倍数(a~i, 彩色区)红色五角星代表暴雨中心, 灰色阴影为青藏高原 Fig.6 Integral layer (875~300 hPa) water vapor flux (a~c, green solid line, unit: kg‧m-1‧s-1), 700 hPa water vapor flux divergence (d~f, green solid line, unit: ×10-6 kg‧m-2‧hPa-1‧s-1), and integrated precipitable water (g~i, green solid line, unit: mm), as well as their standardized anomaly multiples (a~i, colored area) during the main precipitation period of extreme heavy rainstorms in Ningxia under the strong Western Pacific Subtropical High western pattern (a, d, g), strong Western Pacific Subtropical High eastern pattern (b, e, h), and east-high-west-low pattern (c, f, i).The red pentagram represents the rainstorm center, gray shadow is Qinghai-Xizang Plateau |
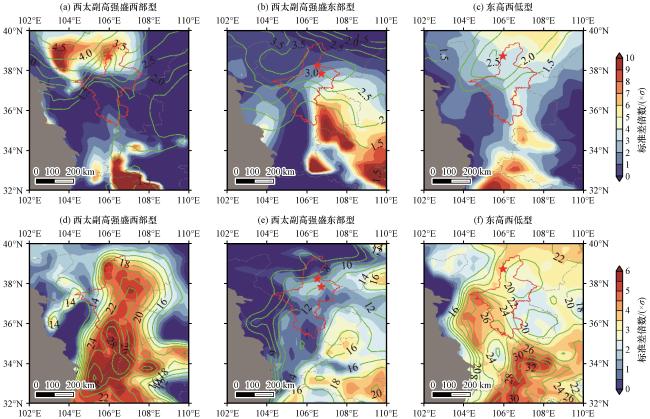
图7 宁夏西太副高强盛西部型(a、 d)、 西太副高强盛东部型(b、 e)、 东高西低型(c、 f)特大暴雨主要降水时段CAPE(彩色区)和K指数(绿色实线)的标准差倍数(a~c)、 850 hPa与500 hPa假相当位温差(绿色实线, 单位: ℃)及其标准差倍数(d~f, 彩色区)红色五角星代表暴雨中心, 灰色阴影为青藏高原 Fig.7 Standardized anomaly multiples of CAPE (colored area) and K index (green solid line) (a~c), as well as pseudo-equivalent potential temperature difference between 850 hPa and 500 hPa (green solid line, unit: ℃) and its standardized anomaly multiples (d~f, colored area) during the main precipitation period of extreme heavy rainstorms in Ningxia under the strong Western Pacific Subtropical High western pattern (a, d), strong Western Pacific Subtropical High eastern pattern (b, e), and east-high-west-low pattern (c, f).The red pentagram represents the rainstorm center, gray shadow is Qinghai-Xizang Plateau |
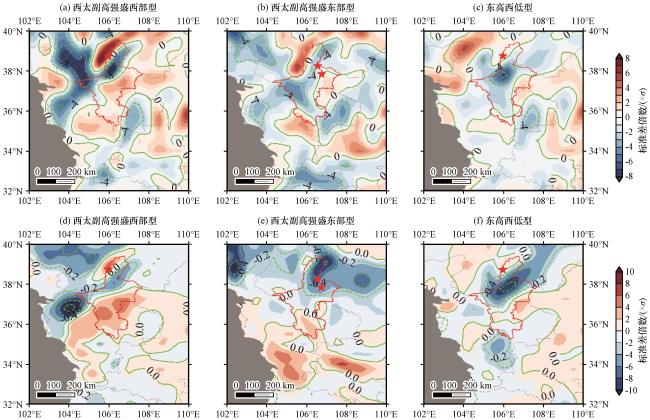
图8 宁夏西太副高强盛西部型(a、 d)、 西太副高强盛东部型(b、 e)、 东高西低型(c、 f)特大暴雨主要降水时段850 hPa散度(a~c, 绿色实线, 单位: ×10-5 s-1)、 700 hPa垂直速度(d~f, 绿色实线, 单位: Pa·s-1)及其标准差倍数(a~f, 彩色区)红色五角星代表暴雨中心, 灰色阴影为青藏高原 Fig.8 Divergence at 850 hPa (a~c, green solid line, unit: ×10-5 s-1), vertical velocity at 700 hPa (d~f, green solid line, unit: Pa·s-1), and their standardized anomaly multiples (a~f, colored area) during the main precipitation period of extreme heavy rainstorms in Ningxia under the strong Western Pacific Subtropical High western pattern (a, d), strong Western Pacific Subtropical High eastern pattern (b, e), and east-high-west-low pattern (c, f).The red pentagram represents the rainstorm center, gray shadow is Qinghai-Xizang Plateau |
6 地形对暴雨增幅作用
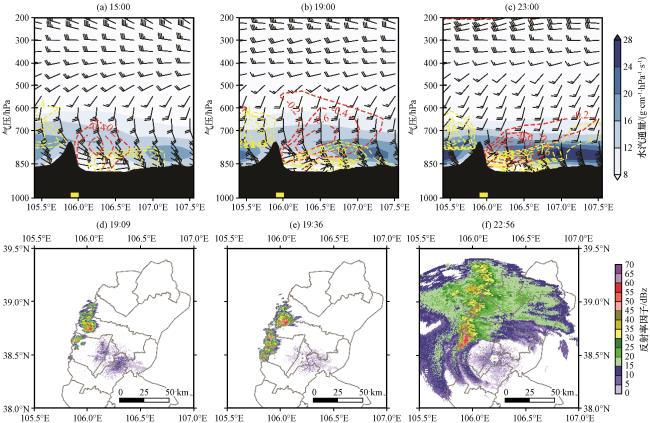
图9 2016年8月21日15:00(a)、 19:00(b)、 23:00(c)沿38.75°N的风场(风羽, 单位: m·s-1)、 垂直速度(红色虚线, 单位: Pa·s-1)、 水汽通量(蓝色阴影, 单位: g·cm-1·hPa-1·s-1)和水汽通量散度(黄色虚线, 单位: ×10-6 kg·m-2·hPa-1·s-1)纬向空间剖面; 2016年8月21日19:09(d)、 19:36(e)、 22:56(f)银川C波段雷达组合反射率因子(单位: dBz)(a~c)黄色阴影为特大暴雨区, 黑色阴影为地形 Fig.9 Cross-sections along 38.75°N of wind field (barb, unit: m·s-1), vertical velocity (red dashed line, unit: Pa·s-1), water vapor flux (blue shading, unit: g·cm-1·hPa-1·s-1), and water vapor flux divergence (yellow dashed line, unit: ×10-6 kg·m-2·hPa-1·s-1) at 15:00 (a), 19:00 (b), 23:00 (c) on August 21, 2016.C-band radar composite reflectivity factor (unit: dBz) in Yinchuan at 19:09 (d), 19:36 (e), 22:56 (f) on August 21, 2016.In Fig.9(a)~9(c), the yellow shadow represents extreme heavy rainstorm region, black shadow is terrain |