
1 引言
2 资料来源与方法介绍
2.1 资料来源
2.2 方法介绍
3 中国夏季复合极端高温干旱事件时空演变特征
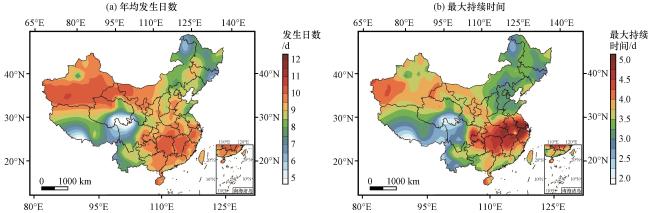
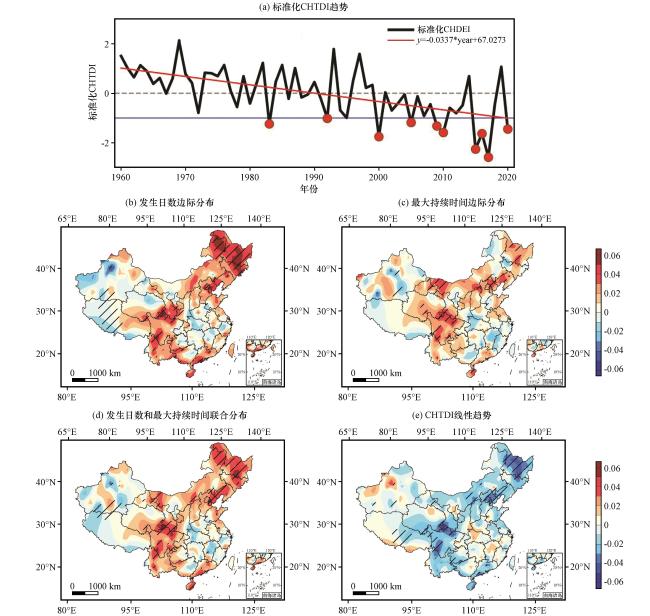
图2 1960 -2020年我国夏季CHTDI标准化时间序列、复合高温极端干旱事件发生日数和最大持续时间的边际分布及其联合分布、 及CHTDI的线性趋势分布黑色斜线表示超过95%显著性检验(下同) Fig.2 Standardized time series of CHTDI in summer, marginal distributions of the occurrence days and maximum duration of extreme high temperature and drought events together with their joint distribution, and the linear trend distribution of CHTDI in China from 1960 to 2020. The black diagonal lines are for values passing the 95% confidence level(the same as after) |
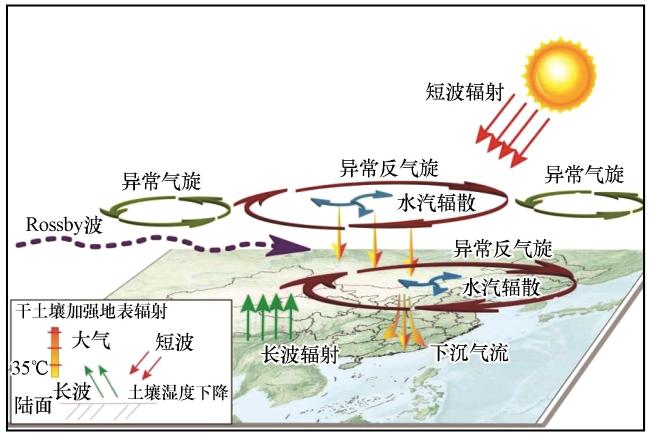
4 影响中国复合极端高温干旱事件的物理机制
4.1 大气环流异常
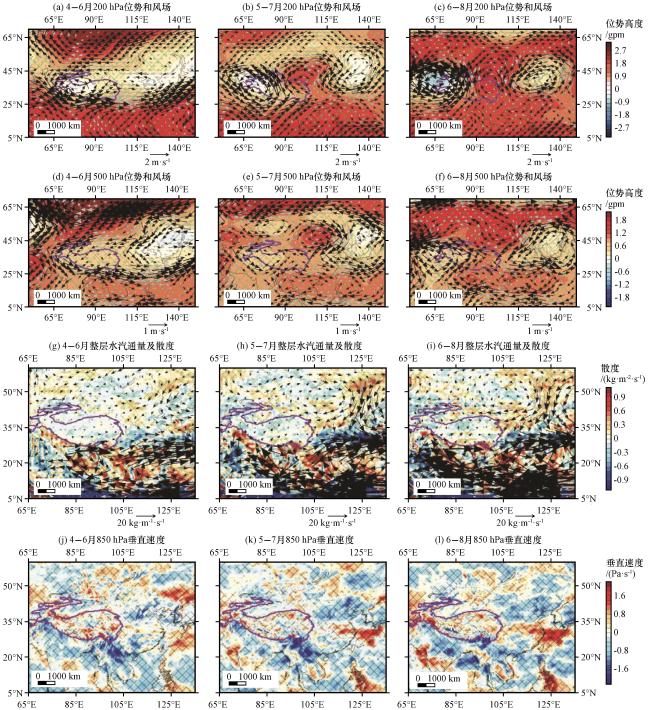
图3 复合极端高温干旱典型年份合成异常大气环流背景(a)~(f) 200 hPa和500 hPa位势高度(填色, 单位: gpm)及相应风场(矢量, 单位: m·s-1)异常, 黑色矢量表示超过95%显著性检验的风异常, 绿色圆点表示通过95%显著性检验的位势高度异常; (g)~(i) 整层水汽通量(矢量, 单位: kg·m-1·s-1)及其散度(填色, 单位: kg·m-2·s-1), 黑色矢量表示超过95%显著性检验的水汽通量异常, 绿色网格表示通过95%显著性检验的水汽通量散度异常; (j)~(l) 850 hPa垂直速度(填色, 单位: Pa·s-1), 黑色网格表示通过95%显著性检验的垂直速度异常 Fig.3 Composited abnormal atmospheric circulation background synthesized during the typical years with extreme high temperature and drought.(a)~(f) Composited abnormal 200 hPa and 500 hPa geopotential height (shading, unit: gpm) and corresponding wind anomalies (vector, unit: m·s-1), the black vectors indicate wind anomalies passing the 95% confidence level, the green dots denote 200 hPa geopotential height anomalies passing the 95% confidence level; (g)~(i) Composited whole layer water vapor flux (vector, unit: kg·m-1·s-1) and its divergence (shading, unit: kg·m-2·s-1), the black vectors indicate water vapor flux anomalies passing the 95% confidence level, the green grids denote water vapor flux divergence anomalies passing the 95% confidence level; (j)~(l) Composited 850 hPa vertical velocity (shading, unit: Pa·s-1), the black vectors indicate vertical velocity anomalies passing the 95% confidence level |
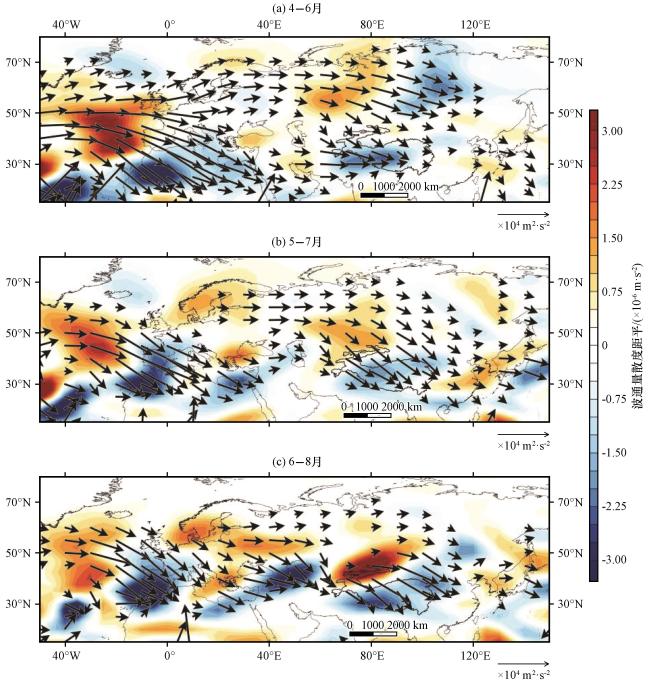
4.2 Rossby波异常
4.3 云和辐射过程异常
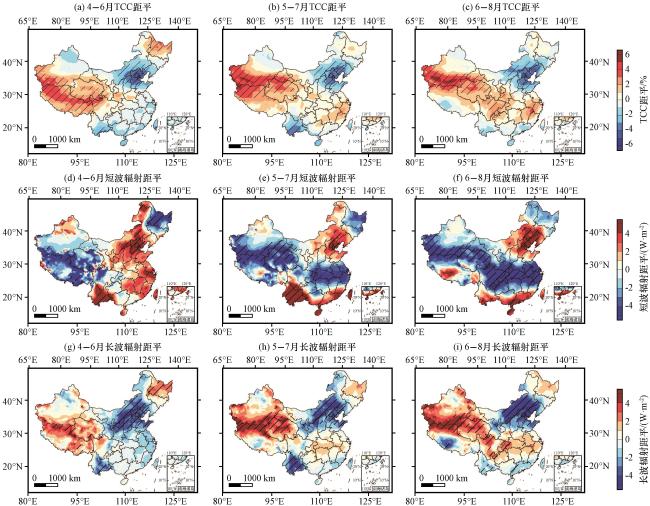
图5 中国复合极端高温干旱典型年总云量(填色, TCC, 单位: %)、 净短波辐射和净长波辐射(填色, 单位: W·m-2)距平Fig.5 Anomalies of total cloud cover (shading, TCC, unit: %), net short wave radiation and net long wave radiation (shading, unit: W·m-2) during the typical years with high temperature and drought over China |
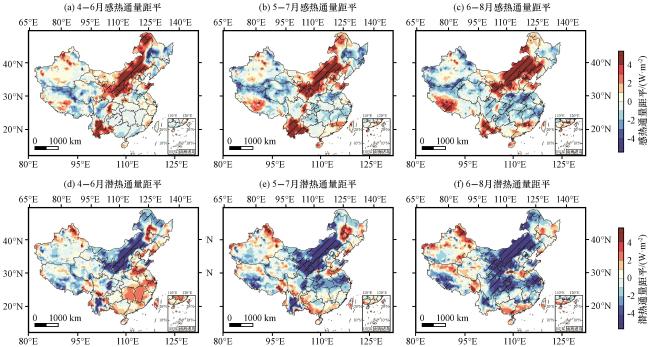
图6 中国复合极端高温干旱典型年地表感热和潜热通量距平(填色, 单位: W·m-2)Fig.6 Anomalies of surface sensible and latent heat flux (shading) during the typical years with high temperature and drought over China.Unit: W·m-2 |
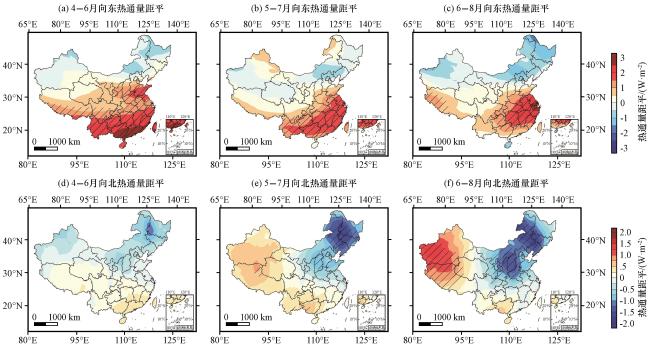
图7 中国复合极端高温干旱典型年份合成向东(a~c)、 向北(d~f)的热通量垂直积分距平(填色, 单位: W·m-2)Fig.7 Anomalies of vertical integration of heat flux (shading, unit: W·m-2) to the east (a~c) and north (d~f) during the years of typical years with high temperature and drought over China |
4.4 陆-气相互作用异常
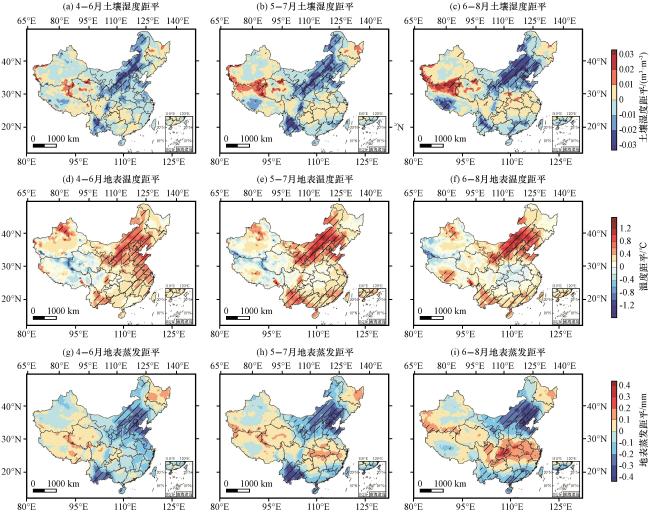
图9 中国复合极端高温干旱典型年土壤湿度(填色, 单位: m3·m-3)、 地表温度(填色, 单位: ℃)和地表蒸发距平(填色, 单位: mm)Fig.9 Anomalies of soil humidity (shading, unit: m3·m-3), surface temperature (shading, unit: ℃) and surface evaporation (shading, unit: mm) during the typical years with high temperature and drought over China |