
1 引言
2 数据来源与方法介绍
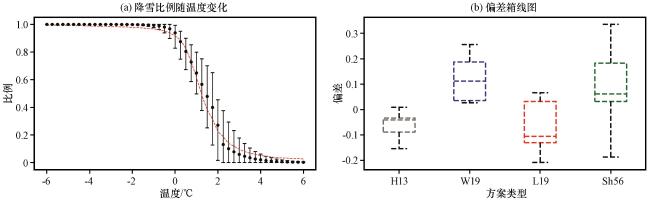
2.1 雨雪拆分参数化方案介绍
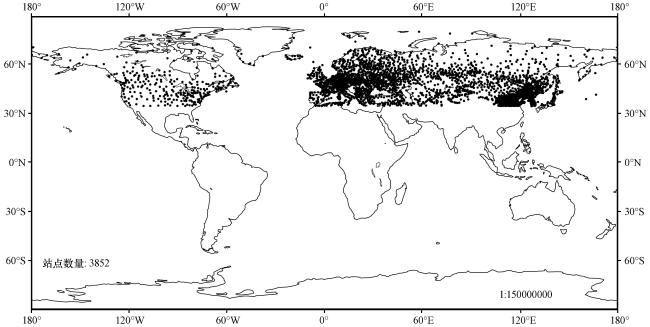
2.2 站点数据
2.3 模式模拟
3 结果与分析
3.1 站点尺度
3.2 区域模拟比较
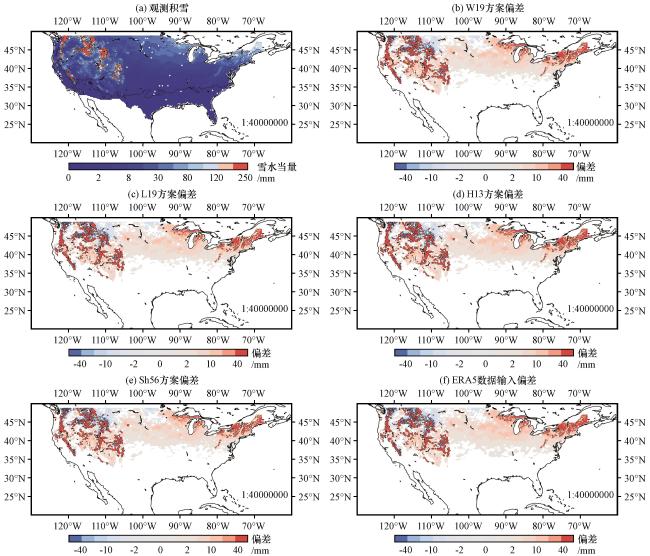
图3 2010 -2019年冬季观测雪水当量均值(a), 与其他方案(W19、 L19、 H13、 Sh56及ERA5降雪驱动)与观测均值的差值(b, c, d, e, f)(单位: mm)Fig.3 Winter mean snow water equivalent (SWE) observations for 2010 -2019(a), and the differences between observations and other schemes (W19, L19, H13, Sh56, and ERA5 snowfall-driven simulations) shown in panels (b, c, d, e, f), respectively.Unit: mm |
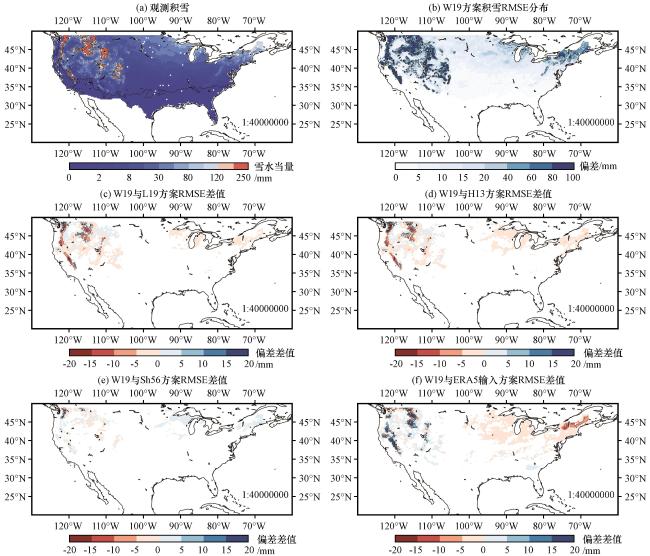
图4 2010 -2019年冬季观测雪水当量均值(a)与W19方案的RMSE分布(b), 以及W19方案与其他方案(L19、 H13、 Sh56、 ERA5降雪驱动)RMSE的差异(c, d, e, f)(单位: mm)Fig.4 (a) Winter mean snow water equivalent (SWE) observations for 2010 -2019, (b) RMSE distribution of the W19 scheme, and the differences in RMSE between the W19 scheme and other schemes (L19, H13, Sh56, and ERA5 snowfall-driven simulations) shown in panels (c, d, e, f), respectively.Unit: mm |
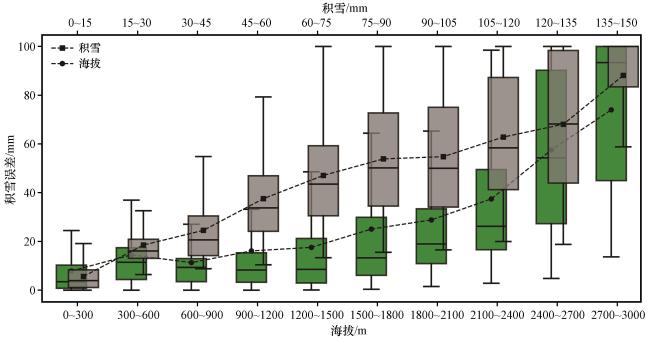
4 误差分析
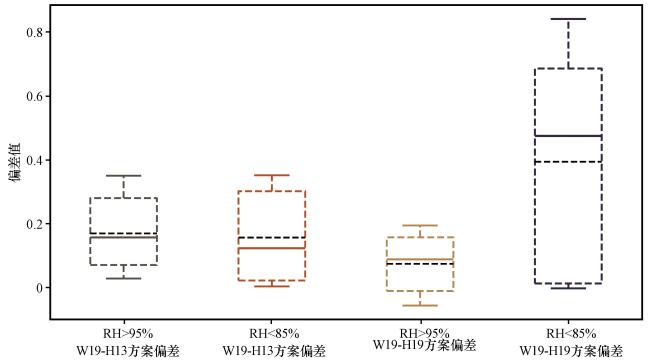
4.1 方案间误差
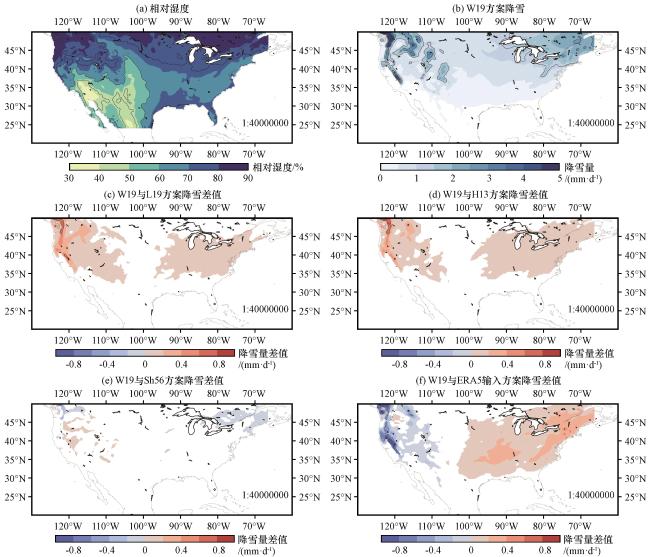
图5 2010 -2019年冬季平均相对湿度(a, 单位: %), 与W19方案平均降雪量分布(b)及W19与其他方案(L19、 H13、 Sh56、 ERA5降雪驱动)的差异(c, d, e, f)(单位: mm·d-1)Fig.5 Winter mean relative humidity for 2010 -2019 (unit: %, a), (b) snowfall distribution of the W19 scheme, and the differences between the W19 scheme and other schemes (L19, H13, Sh56, and ERA5 snowfall-driven simulations) shown in panels (c, d, e, f) respectively (unit: mm·d-1) |