Not found Virtual Special issue on Climate Change in the Source region of the Yellow River

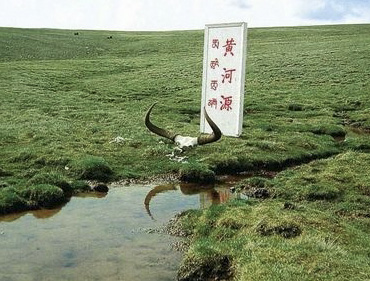
黄河,滋养着泱泱五千年华夏文明,哺育了一代代中华儿女,千百年来文人墨客留下无数荡气回肠的诗篇。新时代,黄河正在谱写新的篇章。

保护好母亲河,是事关中华民族伟大复兴和永续发展的千秋大计。习近平总书记把保护和治理黄河作为治国理政的大事,党的十八大以来多次实地考察黄河流域生态保护和沿岸省区发展情况,并作出了一系列重要讲话和指示批示。

2021年7月6日,中共中央政治局常委、国务院副总理、推动黄河流域生态保护和高质量发展领导小组组长韩正在山东省济南市主持召开推动黄河流域生态保护和高质量发展领导小组全体会议,研究部署下一阶段重点工作。黄河流域经济社会发展和生态保护又向前迈出坚实一步。

为了更全面、系统和快速地展示黄河源区气候变化的研究成果,《高原气象》期刊整理“黄河源区气候变化”虚拟专刊,集中发布本刊出版的关于黄河源区气候变化方面的相关研究成果,为推动黄河流域生态保护和高质量发展提供基础研究资料。 


Default Latest Most Read  
Please wait a minute...
For Selected: Toggle Thumbnails
  • Characteristics of Climate Change of Precipitation and Rain Days in the Yellow River Basin during Recent 50 Years
  • 常军-;王永光;赵宇;李凤秀-
  • 2014, 33 (1): 43-54. DOI: 10.7522/j.issn.1000-0534.2012.00177
  • Abstract (677) PDF (9955KB)(1382)
  • Based on the precipitation data of 143 stations, temporal and spatial variation characteristics of precipitation and rain days in the Yellow River basin during 19612010 are analyzed. The results show that: (1)Multi-year average spatial distribution characteristics of annual precipitation and annual rainy days in the Yellow River Basin is less in the North and more in the South. (2)Annual precipitation and annual rainy days change trend have effective consistency in the Yellow River basin during the recent 50 years, both decreasingly. And the reduction trend of the annual rain days is more significant. The percentage of stations of annual precipitation with negative trend is 81.8%, and the percentage of stations of annual rainy days with negative trend is 88.8%. (3)About the seasonal variation in the Yellow River basin, the precipitation and rainy days in winter appear positive trend while they present negative trends in other three seasons, especially in autumn. The negative trend stations of precipitation in four seasons passing the significance test are autumn>spring>summer>winter, and the negative trend stations of rain days in four seasons passing the significance test are autumn>summer>spring>winter. (4)The unanimous mutation of both annual precipitation and annual rainfall in the basin is 19851986, and the decrease of precipitation and rain days mainly results from the changed atmospheric circulation. For example, the above normal precipitation and rain days in 1986 are due to the stronger monsoon which enables the effectively conveying of vapor and the wind convergence in the northwest. On the other hand, after the mutation, the weaker monsoon, the lack of effective moisture transport and the anticyclonic circulation in the area from the Mongolia to Hetao may result in less precipitation and rain days.
  • Baidu(19)
  • Numerical Simulation of Impact of Ecological Environment Change on Lake Effect in the Source Region of the Yellow River
  • LI Zhao-guo-;LV Shi-hua;AO Yin-huan;WEN Xiao-hang
  • 2012, 31 (6): 1591-1600.
  • Abstract (140) PDF (4578KB)(1037)
  • A three-dimensional mesoscale atmospheric model WRF is used to examine the characteristic of lake effect over Lake Ngoring in the upper reach of the Yellow River and the influence of  terrestrial environment change on the lake effect. Three groups of experiments have been simulated which include environmental improvement, status quo, degradation. The main results show: (1) From noon to nightfall in sunny summer, there is a clear lake-breeze circulation in Lake Ngoring; both sensible heat flux and latent heat flux are small over the lake in daytime, moreover, there is a strong cold (warm) lake effect over Lake Ngoring region in daytime (nighttime); the specific humidity over lake is larger than that over land in surface layer, but there is converse above it; the water vapor wall and high value areas of sensible flux can be found on land along the lake under the influence of lake breezes. (2) Environment degradation results in an enhanced lake-breeze circulation and higher water vapor wall. In addition, the difference of the boundary layer height increases between land and lake; for the different surface characteristics, the changes of sensible heat  and latent heat fluxes over land are much more than that over the lake. (3) Environment changes impact on the distributions of air temperature and specific humidity in the bottom and top of the boundary layer through the underlying surface and the lake breeze, respectively, as a result, there is a reverse trend in different heights.
  • Baidu(6)
  • Changes and Relation Analyses of Climate and Vegetation in the Source Region of Yellow River in Recent Several Decade Years
  • LIU Yuan-pu;Lü Shi-hua;LI Suo-suo;SHANG Lun-yu
  • 2007, 26 (5): 1045-1051.
  • Abstract (347) PDF (754KB)(647)
  • Analyzing the variations and correlations of temperature,precipitation and NDVI index in the source region of Yellow River.Some results are found,the temperature was ascend significance in the recent 50 years;the precipitation trend was descend in the recent 34 years,the precipitation was more in 1980's,it was much humid in source region of Yellow River;the vegetation was covered badly in the source region of Yellow River and its notheast,it was not easily keeping;but it was covered well in Dari and the southeast of the source region of Yellow River and it was easily keeping in the recent 20 years,the vegetation was positive correlated to temperature and precipitation and the precipitation took more effect on vegetation than temperature.
  • Spatial and Temporal Changes of Summer Rain in the Yellow River Basin and Its Relation to the East Asia Subtropical Westerly Jet in Last 50 Years
  • SHAO Pengcheng;LI Dongliang;WANG Chunxue
  • 2015, 34 (2): 347-356. DOI: 10.7522/j.issn.1000-0534.2013.00194
  • Abstract (315) PDF (5068KB)(1086)
  • Based on the precipitation data of 92 stations of the Yellow River Basin and NCEP /NCAR daily reanalysis data, the spatial and temporal changes and period characteristic of summer rain in the Yellow River Basin and its relation to the east Asia subtropical westerly jet in last 50 years has been analyzed. The spatial anomaly features of summer precipitation in the Yellow River Basin are mainly three kinds: wet or dry in all area pattern, wet (or dry) in southeast and dry (or wet) in northwest pattern, wet (or dry) in southwest and dry (or wet) in northeast pattern. When anomalies north of the east Asian subtropical westerly jet center, more summer rainfall in the upper reaches of the Yellow River Basin and less in the lower reaches of the Yellow River Basin, when the anomalies south of the east Asian subtropical westerly jet center, the summer precipitation in the upstream region of the Yellow River Basin less than normal and the downstream region is above normal. Anomalies east of the east Asian subtropical westerly jet center, the summer rainfall of the Yellow River Basin in upstream region above normal and less in the middle and lower reaches of the Yellow River, when anomalies west of the east Asian subtropical westerly jet center, the middle and lower reaches of the Yellow River Basin precipitation above normal, the upper reaches of the Yellow River Basin rainfall less than normal.
  • Baidu(2)
  • Analysis on the Causes of Development and Evolution of the Yellow River Cyclone Rainstorm Process
  • Yale ZHANG;Xiaoding YU
  • 2021, 40 (1): 74-84. DOI: 10.7522/j.issn.1000-0534.2019.00103
  • Abstract (582) HTML (25) PDF (10405KB)(419)
  • On 19-21 July 2016 North China experienced an extreme rainfall event, which is characterized by wide influence range, large accumulated rainfall, long duration and locally large rainfall intensity.In terms of the rainfall amount, it is the most severe rainfall event since August 1963.The intensity and duration of rainfall in Hebei province and Beijing exceeded that of "7.21" in 2012.The characteristics of the weather system development, the path of the Yellow River cyclone are analyzed with the data of ground automatic station, satellite and NCEP data.The deep low vortexes over North China, the westerly trough associated with the low vortex, the subtropical high and the Yellow River cyclone induced by the low vortex are the direct influencing systems of the rainstorm.Because of the blocking of the subtropical high, the cyclone moved very slowly.Additionally, the path appears counterclockwise rotation twice during the movement.It is found that the surface cyclone center always moves along the warm advection in the middle and lower layers and the region with large differential vorticity advection in the lower and upper layers.Meanwhile the positive feedback generated by the latent heat release and the vercital movement, guides the cyclone moving to the place where the vertical movement is strong.The latent heat plays an important role in the growth of low level potential vorticity, which is beneficial to the generation of cyclone.At the same time, the high-altitude vortex is coupled with the low-altitude system, and has a positive feedback effect with the warm advection over the surface cyclone, which leads to the rapid development of the surface Yellow River cyclone.The dry zone in the dark region of water vapor in satellite water vapor image has the characteristics of high vortex, which is analyzed by combining it with the high level potential vortex field, which is helpful to judge the development and evolution of high-altitude dynamic characteristics in the water vapor image, and provides reference for the monitoring of extratropical cyclones.
  • The Role of Solar Radiation and Water Vapor Pressure Deficit on Controlling Latent Heat Flux Density over the Alpine Wetland of the Source Region of the Yellow River
  • XIE Yan;WEN Jun;LIU Rong;WANG Xin;JIA Dongyu
  • 2018, 37 (3): 614-625. DOI: 10.7522/j.issn.1000-0534.2017.00063
  • Abstract (328) HTML PDF (2178KB)(234)
  • As the alpine wetland underlying surface is moist and sensitive to climate change, quantitative assessments of environmental factors on the influence of latent heat flux over there have important scientific significance. Environmental factors on the influence of latent heat flux are potential to be expressed as sums of the atmosphere and surface factors. By using the datasets collected from the land surface process field experiment which was conducted in the source region of the Yellow River from June 1 to August 31, 2014, the characteristics of solar radiation and water vapour pressure deficit in controlling latent heat flux density were analyzed, and further assessment was evaluated by a defined controlling factor. The main results are as follows:(1) The average values of relative atmospheric controlling factors on latent heat flux density exercised by solar radiation and water vapour pressure deficit are 0.98 and 0.02. Relative atmospheric controlling factor on latent heat flux density is mainly exercised by solar radiation, and the role of water vapour pressure deficit is only marginal. (2) The average values of relative surface controlling factor over latent heat flux density exercised by solar radiation and water vapour pressure deficit are 0.12 and -0.31. The former is larger in the morning and evening, and smaller in the noon. The absolute value of the latter is smaller in the morning and evening, and larger in the noon. (3) The average values of absolute total controlling over the latent heat flux density exercised by solar radiation and water vapour pressure deficit are 0.22 and -0.06 W·m-2·Pa-1. The average values of relative total control are 1.10 and -0.29. (4) Solar radiation controls the latent heat flux mainly through a direct effect (atmospheric factor). While the water vapour pressure deficit controls latent heat flux mainly through the indirect effect of altering surface resistance (surface factor). (5) The average value of the decoupling factor over the alpine wetland is 0.38. It implied that the coupling between the alpine wetland and atmospheric is low. It is of practical, the solar radiation is the main factor to control the latent heat flux over alpine wetland. This study provides a new research approach for the study of the parameterization of latent heat flux and evaporation under the context of global climate change.
  • Statistical Downscaling of Future Temperature Change in Source of the Yellow River Basin
  • ZHAO Fang-fang;XU Zong-xue
  • 2008, 27 (1): 153-161.
  • Abstract (139) PDF (1656KB)(594)
  • Direct outputs of climate change simulation from general circulation models(GCMs) are inadequate for the assessment of land-surface impact on regional scale. Statistical downscaling technique is proposed as one of the tools to establish the relationship between the mesoscale GCM output(frequently atmospheric circulation data) and sub-grid-scale surface variables(such as precipitation), under the assumption that the GCM output are more reliable than the latter. After analyzing both advantage and disadvantage of the statistical downscaling technique and its applicability, the daily maximum and minimum temperatures were downscaled from GCM grid to local area using the Statistical Downscaling Model(SDSM) in this paper. In order to analyze its reasonability, a resolution with the grid of 2.5 in latitude and 3.75 in longitude in source of the Yellow River was selected and the 30-year daily temperature series at 7 stations were used. First, a statistical transfer function between the large scale predictors and the local temperature was established by using the SDSM. Then, the transfer function was validated by using individual observed data. Finally, the temperature scenarios for future periods(2020s, 2050s and 2080s) were estimated using the validated transfer function from output of the HadCM3 SERS B2 at 7 stations. On the basis of above analysis, the temperature scenarios for the whole source of the Yellow River was developed by using the Kriging interpolation in ArcGIS. The results show that the downscaled maximum temperature quickly increase, and the average scenarios for the future periods are 1.34, 2.60 and 3.90℃, respectively. However, the average change of daily minimum temperature is relatively unconspicuous, and the scenarios for the future periods are 0.87, 1.49 and 2.27℃, respectively. The scenarios for different months and seasons are quite different. The scenarios for the maximum temperature are remarkable in spring and autumn, and the scenarios for the minimum temperature are distinct in summer and autumn.
  • Baidu(59)
  • Spatial and Temporal Characteristics and Change Trend of Climatic Elements in the Headwater Region of the Yellow River in Recent 40 Years
  • XU Zong-xue;HE Wan-lin
  • 2006, 25 (5): 906-913.
  • Abstract (333) PDF (423KB)(462)
  • The Mann-Kendall statistic test method is used to estimate the spatial and temporal characteristics and variations trend of sunshine,surface air temperature,precipitation,and evaporation at 13 hydrologic stations in headwater region of the Yellow River from 1959 to 1997.The results show that the trend of sunshine decreased weakly in the study area over the past 40 years,the magnitude of the sunshine decreases from northern to southern parts and the long-term trend decreases from middle to western,eastern,and northern parts.The air temperature remarkably increased over the past 40 years,the magnitude increases from western to eastern,and from southern to northern parts,the long-term trend weakly increases in middle and southern parts,but strongly in northern,eastern,and western parts.The precipitation decreased over the past 40 years,the magnitude of precipitation decreases from southeastern to northwestern parts,the long-term trend decreases in most of the study area.In contrast to the air temperature,the evaporation decreased over the past 40 years,the magnitude decreased from northern to southern parts,the long-term trend decreases in most of the study areas,especially in northern parts.In addition,the linear trends are estimated and the results are briefly presented in this paper.The results which obtained by the two methods coincide well with each other.
  • Baidu(34)
  • Analyses of Precipitation Change in the Source Regions of Three Rivers during 1956-2004
  • TANG Hong-yu;YANG Xiao-dan;WANG Xi-juan;SHI Jing-mei;XU Liang
  • 2007, 26 (1): 47-54.
  • Abstract (331) PDF (642KB)(650)
  • Based on the daily precipitation data from 122 stations in Northwest China and source regions of three rivers(Yellow river,Jinsha river and Lanchang river) during 1956-2004,the spatial and temporal distributions of trend for precipitation total,precipitation frequency and precipitation intensity are analyzed.The main conclusions are summarized as follows: The annual precipitation in the source regions of the three rivers has decreased by a rate 6.73 mm/10a;and the daily numbers of precipitation has obviously decreased trend,successive decrease rate is 2.7 d/10a;the mean pricipitation intensity appear to weakly strengthen trend,mean speed is 0.20 mm/d/10a.Such change trends are stronger than mean pricipitation in Northwest China.The decreasing of the longest consecutive dry days reflects a drying trend in the source regions of three rivers.
  • Baidu(82)
  • Characteristics of Water Vapor Transportation and Budget of Winter and Summer in the Yellow River Basin
  • LI Jin;LI Dong-Liang;ZHANG Jie
  • 2012, 31 (2): 342-350.
  • Abstract (338) PDF (1242KB)(902)
  • Using the NCEP/NCAR reanalysis data and the observed rainfall data, the water vapor flux, the water vapor convergence (divergence) and water vapor budget in every sub-region of January and July over the Yellow River basin in drought/flood years and multi-year mean are studied. The results indicate that water vapor transport is insignificant in January, while in July the water vapor is transported from Southwest, Southeast and Northwest China to the Yellow River basin, and the lower reach Yellow River of multi-year mean is mainly influenced by the first two airflows. In the flood years, the southwest and southeast water vapor  have obvious impact on middle and lower reaches of the Yellow River basin, while its upper reach region is rarely influenced; In the drought years, the water vapor  transport to neither the upper nor middle reaches of the Yellow River basin, only the southwest water vapor  transports to the lower reach region. Spatial and temporal variations of water vapor budget correspond to that of precipitation over every sub-region, respectively, while the meridional net water vapor flux is the main supply for the water vapor budget and precipitation. The net water budget and the water vapor input to every boundaries in flood years are significantly larger than those of in drought years. In January, the weak water vapor input from the west and the north boundaries is much smaller than the output from the east and the south boundary, leading to moisture divergence; In July, huge amounts of water vapor comes from the west and the south boundary, it results in the water vapor convergence over most sub-region of multi-year mean. But specifically speaking, it results in the water vapor convergence over all sub-region in the flood years, while results in the water vapor divergence in the drought years.
  • Baidu(15)
  • Simulation and Projection of Precipitation in the Upper Yellow River Basin by CMIP6 Multi-Model Ensemble
  • Mengxia ZHAO;Buda SU;Tong JIANG;Anqian WANG;Hui TAO
  • 2021, 40 (3): 547-558. DOI: 10.7522/j.issn.1000-0534.2020.00066
  • Abstract (776) HTML (14) PDF (7375KB)(228)
  • The ground-based observational dataset is applied to evaluate the performance of 5 GCMs from the Coupled Model Intercomparison Project Phase 6 (CMIP6) in the Upper Yellow River Basin during 1995 -2014.And then, precipitation trends in the near term (2021 -2040), mid-term (2041 -2060), and long term (2081 -2100) under 7 SSP-RCP scenarios are projected, respectively.The results show that: (1) Multi-model ensemble mean can capture the inner-annual distribution of precipitation in the Upper Yellow River Basin, and the characteristic of more precipitation in the South and less precipitation in the north can also be captured.The spatial correlation coefficient between the simulated data and the observed data is above 0.9.That is to say, the spatial-temporal characteristics of precipitation in the Upper Yellow River Basin can be simulated satisfactorily by an ensemble mean of 5 GCMs.(2) In the 21st century, annual precipitation in the Upper Yellow River Basin will demonstrate a significant increase tendency with obvious inter-decadal fluctuations.Relative to the baseline period 1995 -2004, the ascended annual precipitation will be faster in the near-term and then slow down in the 21st century under SSP1-1.9 and SSP1-2.6 scenarios.Annual precipitation will rise continuously from near term to the end of 21st under SSP2-4.5, SSP3-7.0, and SSP5-8.5 scenarios.Under SSP4-3.4 and SSP4-6.0 scenarios, annual precipitation will decrease slightly in the near term, but a turning point is detected in the mid-term, and precipitation will increase afterward.Spatially, the largest increase will be in the areas where precipitation is relatively small, including the headstream region above Huangheyan station and the region between Lanzhou and Toudaoguai.(3) Seasonal precipitation in the 21st century in the Upper Yellow River Basin will show an overall rising trend with fluctuation, and the growth rate varies with scenarios and seasons.Except for the SSP4-6.0 scenario, precipitation trend under high radiation forcing scenarios will be greater than that of low radiation forcing scenarios.The growth rate is the largest for winter precipitation, while the growth rate is the smallest for summer precipitation, both passing the 0.1 significance level.Spatially, the highest growth of spring and autumn precipitation is projected in the headstream region above Huangheyan station and the region between Lanzhou and Toudaoguai.While the smallest growth of spring and autumn precipitation will be in the region between Huangheyan and Lanzhou.The area with the highest increase of winter precipitation is projected in the region between Lanzhou and Toudaoguai, and the smallest increase in the region between Huangheyan and Lanzhou.Summer precipitation will decrease in most of the Upper Yellow River Basin under SSP4-3.4 and SSP4-6.0 scenarios, but it will increase in most of the Basin with the highest growth in the headstream region above Huangheyan under all other scenarios.
  • Review of Climate Change and Its Environmental Influence on the Three-River Regions
  • Xianhong MENG;Hao CHEN;Zhaoguo LI;Lin ZHAO;Bingrong ZHOU;Shihua Lü;Mingshan DENG;Yumeng LIU;Guangwei LI
  • 2020, 39 (6): 1133-1143. DOI: 10.7522/j.issn.1000-0534.2019.00144
  • Abstract (1549) HTML (312) PDF (2119KB)(527)
  • The Three-river sources regions (TRSR), located on the Qinghai-Xiang Plateau (QXP), are the source regions of Yangtze, Yellow and Lancang River.Under the background of global climate change, the QXP was considered as the “sensitive region” and the “promoter region” of climate change, which will definitely affect the regional climate, environment, and water resources on the TRSR.This paper reviews the facts of variations of climate, environment and water resources in the recent 5~6 decades.The main conclusions are as follows: (1) Air temperature increased on the TRSR with a trend of 0.33 ℃·(10a)-1, which is 1.2 times of the rate on QXP.(2) Precipitation increased on the TRSR with a trend of 6.653 mm·(10a)-1, but the trend was 71% of the QXP.(3) The minimum and maximum air temperature increased significantly, with the trend in the cold seasons higher than the warm seasons.(4) Snow days on the south of the TRSR increased, but decreased on the source region of the Yellow river.(5) Under the climate warming, the permafrost degraded, in combing with the precipitation enhancement, the lakes and the wetlands were developed.(6) Although precipitation on the TRSR enhanced, runoff shows different trends, with it increased on the sources of Yangtze river (the trend of runoff in Zhimenda station is 6.69×10⁸ m3·(10a)-1), and decreased on the Yellow river (the trend of runoff in Xiangda station is 1.1×10⁸ m3·(10a)-1).At last, the water cycle changes under the warming and its influences on water resources were discussed, according to which it is important to do more investigations on the multi-sphere interactions to distinct the contribution to water resources from climate change and human activities.These kinds of knowledge will benefit for the TRSR to adapt climate change and supply references for the TRSR park construction.
  • Simulation of the Snow Cover Influence in the Source Regionof the Yellow River on the Hydrothermal Process of Frozen Soil
  • Chuang YAO;Shihua Lü;Zhaoguo LI;Xuewei FANG;Shaobo ZHANG
  • 2020, 39 (6): 1167-1180. DOI: 10.7522/j.issn.1000-0534.2019.00128
  • Abstract (415) HTML (11) PDF (7236KB)(212)
  • Based on the observed atmospheric forcing data from the grassland station of Erling Lake in the source region of the Yellow River from May 1, 2014 to August 31, 2015, the model CLM4.5 was driven, and the influence of plateau snow cover on the soil hydrothermal process was carried out.By comparing and analyzing the numerical simulation results, the main conclusions are as follows: (1) With the increase of snow on the plateau, the time of soil thawing lags behind, the more snow accumulated, the later the soil begins to thaw, the faster the thawing rate was, and the shorter the duration of soil thawing process was.(2) Snow cover has a certain heat preservation effect during the frozen period.When snow cover is reduced, the heat preservation effect is weakened, the heat transfer from the soil to the atmosphere is increased, and the heat is mainly transferred to the atmosphere in the form of sensible heat.Snow cover has a certain cooling effect when soil is in the thawing period.The cooling effect lasts until June.(3) During the soil thawing period, snow cover has a certain moisturizing effect.The higher moisture soil brought by snow melt can increase the radiation energy absorbed by the surface, and the higher moisture soil has a large latent heat transfer, which makes the sensible heat flux lower.The higher moisture soil caused by melting snow will last until after June.
  • Variation of Snow Cover and its Influence on Spring Runoff in the Source Region of Yellow River
  • Xiaojiao LIU;Rensheng CHEN;Junfeng LIU;Xiqiang WANG;Baogui ZHANG;Guohua LIU
  • 2020, 39 (2): 226-233. DOI: 10.7522/j.issn.1000-0534.2019.00074
  • Abstract (620) HTML (13) PDF (2119KB)(310)
  • Snow cover is an important component of cryosphere, and strongly affects the hydrology and climate.The eastern part of the Qinghai-Tibetan Plateau, one of the three major snow-covered areas in China, is the source region of Yellow River, which has great impact on both climate change and water resource system.Based on the Yellow River source region data of snow depth, meteorological and measured runoff from 1978 to 2016, the characteristics of snow cover and its influence on spring runoff of this area were studied through the Mann-Kendall test, linear analysis and correlation analysis.The results showed that: (1) From 1978 to 2016, the source region of Yellow River revealed a tendency of a delayed initial snow date, forwarded final snow date, and declination of both duration and number of snow days.Particularly, the initial snow date, the final snow date and the duration of snow days passed the significant tests of p <0.05, p<0.05 and p<0.01, respectively.(2) The annual average snow depth had no significant change from 1978 to 2016 in this area.However, it showed a significant upward trend since the end of the 21 century and passed the significance test of p<0.1.(3) In general, compared with the snow depth, the number of snow days has more impact on the spring runoff in the source region of Yellow River.More specifically, according to the sensitivity analysis of the data from 1978 to 2016, 1% change of the of snow day number would induce of 0.60% spring runoff change, while the same amount change of the snow depth would only induce 0.25% spring runoff change.In addition, the spring runoff in April and May is more sensitive to snow cover change than March due to the increased average temperature and the larger amount of melted snow.(4) Different precipitation and temperature generates different snow cover, which results different responses to spring runoff.The snowmelt runoff is advanced under the climate warming, which shows an upward runoff trend in March while a downward trend in April and May.Meanwhile, due to the change of the regional atmospheric water vapor content, the spring runoff in the Yellow River source region significantly increased since the end of the 21 century.
  • Analysis of Annual Precipitation and Extreme Precipitation Change in the Upper Yellow River Basin in Recent 50 Years
  • MA Jianing;GAO Yanhong
  • 2019, 38 (1): 124-135. DOI: 10.7522/j.issn.1000-0534.2018.00126
  • Abstract (831) HTML PDF (15928KB)(404)
  • Greater attention has been received about the variation and trends in extreme climate events. Based on daily precipitation data recorded at 45 meteorological stations in the upper Yellow River Basin from 1970 to 2017, the upper Yellow River Basin was distributed into three regions according to topography, elevation, climate and other factors. For each region, wavelet analysis and Mann-Kendall abrupt change analysis were employed to analyze the spatial distribution and temporal trends of annual precipitation and extreme precipitation events. The results show that the distribution of average annual precipitation in the upper Yellow River Basin has obvious regional differences from the southeast to the northwest. The average annual precipitation and extreme precipitation in the upper Yellow River Basin had obvious periodic oscillation characteristics with 22a mostly, followed by 18a and 8a. For the whole region, the extreme precipitation and average annual precipitation were more consistent, but the precipitation in the upper of the Yellow River Basin has been increasing in recent years, while the frequency of extreme precipitation events has been decreasing. It is implicated that the spatial pattern of climate in China has been changed during the past 48 years.
  • Analysis on Freezing-thawing Characteristics of Soil in High and Low Snowfall Years in Source Region of the Yellow River
  • YAO Chuang;Lü Shihua;WANG Ting;WANG Junfeng;MA Cuili
  • 2019, 38 (3): 474-483. DOI: 10.7522/j.issn.1000-0534.2018.00142
  • Abstract (406) HTML PDF (2559KB)(359)
  • Based on the field observation data in the source region of the Yellow River from October 2011 to December 2017, the characteristics of soil freezing-thawing duration, soil temperature and moisture, surface energy components in high snowfall year and low snowfall year were analyzed in this paper. The results show that the snowy year has higher albedo, lower net radiation, and lower surface heat transfer than the less snowfall year. The time of the snowy year from the heat "source" to the heat "sink" is later than the less snowfall year. Snow accumulation can reduce the radiant energy absorbed by the soil, reduce the sensible heat transfer on the surface, increase the surface latent heat transport during the frozen period and the thawing period of the soil, reduce the heat transfer from the soil to the atmosphere during the frozen period, and reduce the heat transfer from the atmosphere to the soil during the thawing period. The snow cover has a cooling effect in the freezing period, which makes the soil freeze earlier in the snowy years and the soil temperature is lower in the same period. It has the function of heat preservation in the frozen period, which makes the soil temperature higher in the snowy years. In the thawing period, it has the effect of heat preservation ("cooling"), which makes the ablation later and the soil temperature is low in the same period. During the whole freezing-thawing period, the shallow soil moisture in the snowy year is higher than that in the less snowy year, indicating that the snow has a moisturizing effect on the shallow soil. Snow accumulation makes the soil to start freeze earlier and the start of ablation later, which can extend the number of days that the soil is completely frozen.
  • The Characteristics of the Water Vapor Transport and Associated Sources under Abnormal Precipitation Conditions in the Source Region of the Yellow River Using FLEXPART
  • ZHU Li;LIU Rong;WANG Xin;WANG Zuoliang;WEN Jun;ZHAO Yang;XIE Yan;ZHANG Tangtang
  • 2019, 38 (3): 484-496. DOI: 10.7522/j.issn.1000-0534.2019.00015
  • Abstract (523) HTML PDF (19748KB)(521)
  • Based on the precipitation observation data of meteorological stations in the source region of the Yellow River (SRYR) in the past ten years, July is selected as the largest month of precipitation, the maximum positive and negative abnormal year's corresponding to July are 2012 and 2015 respectively. The Lagrange Flexible Particle Dispersion Model (FLEXPART) is driven by NECP reanalysis data to simulate the backward trajectories of target particles in these two months. The characteristics and differences of water vapor transport under abnormal conditions are emphatically analyzed, and the contribution rate of each moisture source to the regional rainfall is calculated quantitatively. The results show that, in July 2012, the moisture transportation to the SRYR is mainly conducted by South Branch which contains two routes entering the SRYR from the southern side of the Qinghai-Tibetan Plateau (QTP):one is the trans-equatorial transport path, that is to say, the Somali jet carries moisture from the Arabian Sea and finally enters the SRYR by way of the Indian Peninsula and Bay of Bengal; the other is that particles carry moisture from the South China Sea and finally enters the SRYR by way of the Sichuan Basin. On the contrary, the North Branch which means moisture enters the SRYR from the Western or northern side of the QTP plays a dominant role in July 2015, including two typical paths as well:one is that the Easterly jet carries the moisture from the South China Sea and finally enters the SRYR by the Bay of Bengal and Indian Peninsula; the other is that the Westerly Jet carries moisture from the northern Africa or eastern European Plain and finally enters the SRYR, via Central Asia. The characteristics of specific humidity variation during the movement of particles show that the southern foot of the Himalayas, the Sichuan Basin, the Bay of Bengal and the northern Tibetan Plateau are potential moisture sources for precipitation in the SRYR. Moreover, the estimation of moisture sources contributions to the precipitation in SRYR shows that:the arid and semi-arid grassland areas on the northern side of the TP are main sources of precipitation for the SRYR in July of dry year. The contribution rate is 52.9%, which is much higher than the other four potential moisture sources. While the contributions of the three main sources in the wet year are far less significant than those in the dry year. No matter what type of precipitation, the southwestern QTP and the northern side of the QTP provide the main external water vapor for the main precipitation in the SRYR.