 PDF(14452 KB)

大气河背景下的广西暖区暴雨机理初探
覃皓, 覃月凤, 吴玉霜, 王志毅, 刘乐
PDF(14452 KB)
大气河背景下的广西暖区暴雨机理初探
Study on the Mechanism of Warm-Sector Torrential Rain in Guangxi under Atmospheric Rivers Background
利用多源实况观测资料以及ERA5再分析资料对2010 -2022年夏季(6 -8月)广西暖区暴雨个例中伴随大气河的特征进行统计分析, 并基于波作用通量、 水平锋生以及非绝热加热诊断等, 从热力、 动力角度分析了2022年6月2 -4日大气河背景下广西典型暖区暴雨过程。结果表明: (1)绝大多数暖区暴雨个例伴随大气河。当大气河通过广西区域并维持在约1000 kg·m-1·s-1以下时, 大气河强度增强有利于暖区暴雨降水强度增强。大多数个例中大气河呈西南-东北向, 在经过广西时方向角在15°~65°。(2)典型个例中东西伯利亚阻塞高压和东北冷涡异常活跃, 造成副高总体被压制, 位置偏南, 使得大气河维持在孟加拉湾-南海-华南-北热带太平洋一带, 为暖区暴雨发生发展提供充足水汽。副高维持而低涡东移造成的气压梯度增大以及夜间季风气流加速共同作用使得局地大气河增强。(3)大气河夜间增强促进了局地水汽辐合及垂直输送使得湿层不断增厚, 大气可降水量增大, 有利于降水效率增大。同时, 持续的暖湿输送有利于低层不稳定层结的建立和维持, 使大气对流不稳定结构贯穿整个降水过程。(4)山脉地形的辐合抬升、 侧向摩擦促进了上升运动、 垂直涡度发展, 一方面有利于山前堆积的暖湿空气被迫抬升而触发对流, 另一方面有利于对流系统维持, 造成更多水汽凝结致雨。此外, 暖湿空气堆积产生持续的锋生强迫也有利于降水维持和增强。(5)大气河影响下的强上升造成大量水汽不断凝结释放潜热, 大气受热后又加强了上升运动, 在该正反馈机制下对流持续发展增强。
Based on multi-source observation data and ERA5 reanalysis data, the characteristics of accompanying Atmospheric Rivers (ARs) in the Guangxi warm-sector torrential rain cases during the summer of 2010-2022 (June-August) are statistically analyzed.And the typical warm-sector torrential rain process under the background of ARs in Guangxi occurred in 2 -4 June 2022 are analyzed from the perspectives of thermal and dynamic based on the diagnosis of wave activity flux, horizontal frontogenesis and adiabatic heating.The results showed that: (1) Most warm-sector torrential rain cases are accompanied by ARs.When the ARs pass through Guangxi and remain below 1000 kg·m-1·s-1, the increase of ARs intensity is conducive to the warm-sector torrential rain.In most cases, the ARs are in the direction of southwest to northeast, and the direction angle are between 15° and 65° when ARs pass Guangxi.(2) During the typical warm-sector torrential rain process, the East Siberian blocking and the Northeast cold vortex are extremely active, resulting in the suppression of the Western Pacific Subtropical High (WPSH) and its southerly position which keep the ARs maintain in the Bay of Bengal, South China Sea, South China and north tropical Pacific, providing sufficient water vapor for the occurrence and development of warm-sector torrential rain.The increase of the pressure gradient caused by the maintenance of the WPSH and the eastward movement of the vortex, the acceleration of the monsoon flow at night jointly strengthen the local ARs.(3) The enhancement of ARs at night promotes the local water vapor convergence and vertical transport, cause the wet layer thickened and atmospheric precipitable water increase continuously, which is conducive to the increase of precipitation efficiency.At the same time, the continuous warm and moist transport is conducive to the establishment and maintenance of unstable stratification in the lower level, and the convective unstable structure runs through the whole precipitation process.(4) The convergent uplift and lateral friction of mountain topography promote the upward movement and vertical vorticity development, which, on the one hand, is conducive to the uplift of the warm and moist air accumulated in the front of the mountain triggering convection.On the other hand, it is conducive to the maintenance of convective system and cause more water vapor to condense into rain.In addition, the continuous frontogenesis forcing caused by the accumulation of warm and moist air is also conducive to the maintenance and intensification of precipitation.(5) The strong upward movement under the influence of ARs causes a large amount of water vapor to condense continuously and release latent heat which in turn strengthens the upward movement.The convection continues to develop and strengthen under this positive feedback mechanism.
暖区暴雨 / 大气河 / 对流不稳定 / 潜热 {{custom_keyword}} /
warm-sector torrential rain / atmospheric rivers / convective instability / latent heat {{custom_keyword}} /
表1 2010 -2022年广西暖区暴雨个例Table 1 Cases of warm-sector torrential rain in Guangxi from 2010 to 2022 |
| 序号 | 个例发生日期 | 最大小时 雨量/mm | 最大3 h 雨量/mm | 最大24 h 雨量/mm | 是否伴随 大气河 | 大气河最大强度/(kg·m-1·s-1) | 大气河方向角/(°) |
|---|---|---|---|---|---|---|---|
| 1 | 2010年6月16日 | 60.9 | 115.6 | 224.8 | 是 | 826.65 | 26.4 |
| 2 | 2011年6月16日 | 95.7 | 221.4 | 265.7 | 否 | / | / |
| 3 | 2012年6月24日 | 106.9 | 181 | 259.4 | 是 | 922.38 | 40.1 |
| 4 | 2013年6月28日 | 93.8 | 121.3 | 208.7 | 是 | 879.05 | 40.5 |
| 5 | 2015年7月23日 | 72.3 | 130.3 | 184.9 | 否 | / | / |
| 6 | 2015年7月24日 | 63.5 | 149.7 | 201.2 | 是 | 828.41 | 16.7 |
| 7 | 2015年7月25日 | 77.2 | 156.2 | 351.5 | 是 | 799.87 | 36.6 |
| 8 | 2016年7月5日 | 94.7 | 196.8 | 215.5 | 是 | 826.7 | 108.3 |
| 9 | 2017年7月1日 | 64.9 | 146.8 | 254.9 | 是 | 1236.69 | 32.8 |
| 10 | 2017年7月10日 | 89.6 | 195.9 | 379.9 | 是 | 916.377 | 52.0 |
| 11 | 2017年7月11日 | 68.8 | 132.6 | 213.7 | 是 | 651.48 | 94.7 |
| 12 | 2017年8月15日 | 90.9 | 109.6 | 253.2 | 是 | 699.78 | 61.6 |
| 13 | 2020年6月7日 | 107.7 | 170.4 | 401.3 | 是 | 1053.29 | 29.6 |
| 14 | 2020年7月11日 | 76.5 | 105 | 231.6 | 否 | / | / |
| 15 | 2022年6月4日 | 83.7 | 151.6 | 364 | 否 | / | / |
| 16 | 2022年6月17日 | 101.1 | 181.4 | 271.1 | 是 | 912.43 | 29.8 |
| 17 | 2022年6月20日 | 110.3 | 204.5 | 448.8 | 是 | 955.56 | 40.6 |
| 18 | 2022年6月21日 | 136.2 | 162.5 | 249.8 | 是 | 939.66 | 46.0 |
图1 降水强度与大气河最大强度的散点分布黑色实线为拟合线, (a~c)为所有个例, (d~f)为大气河强度不超过1000 kg·m-1·s-1的个例 Fig.1 Scatter plot between precipitation intensity and maximum intensity of atmospheric rivers.The black solid line indicates fitting curve.(a~c) is all cases, (d~f) is the cases AR intensity not exceed 1000 kg·m-1·s-1 |
图2 区域平均的大气河方向角(a), 2022年6月19 -20日(b)和2017年7月10 -11日(c)平均的整层水汽通量(填色和矢量, 单位: kg·m-1·s-1)(b)~(c)中红色框内为计算大气河强度及方向角区域Fig.2 Area-averaged direction of atmospheric rivers (a), vertically integrated water vapor transport (shaded and vector, unit: kg·m-1·s-1) averaged from 19 to 20 June 2022 (b), 10 to 11 July 2017 (c).The red box in (b)~(c) indicate the region calculated intensity and direction angle of AR |
图3 2022年6月2日20:00至4日20:00过程累计雨量(a, 单位: mm)以及各代表站逐小时降雨量序列(b)(a)中虚线框范为强降水关键区, (b)中虚线为20 mm小时雨量参考线Fig.3 Distribution of accumulated rainfall (a, unit: mm)and observed hourly rainfall (b) from 20:00 on 2 to 20:00 on 4 June 2022.The dashed box in Fig.3(a) is the key area of heavy precipitation, the dashed line in Fig.3(b) is the 20 mm hourly rainfall reference line |
图4 2022年6月3 -4日200 hPa的散度(填色, 单位: ×10-5 s-1; 粗实线为200 hPa的1250 dagpm等值线)、 风场(风羽, 单位: m·s-1)以及500 hPa高度场(等值线, 单位: dagpm)(a, b), 700 hPa高度场(等值线, 单位: dagpm)和850 hPa风场(填色及风羽, 单位: m·s-1)(c, d)Fig.4 Distribution of divergence (shaded, unit: ×10-5 s-1, thick solid line indicate 1250 dagpm at 200 hPa) and wind (barb, unit: m·s-1) at 200 hPa, geopotential height (contours, unit: dagpm) at 500 hPa (a, b), geopotential height (contours, unit: dagpm) at 700 hPa and wind (shaded and barb, unit: m·s-1) at 850 hPa (c, d) from 3 June to 4 June in 2022 |
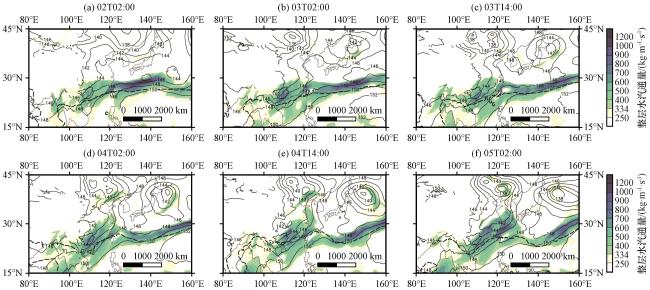
图5 2022年6月2-5日的整层水汽通量(填色, 单位: kg·m-1·s-1), 850 hPa高度场(等值线, 单位: dagpm; 虚线为500 hPa的586 dagpm等值线)Fig.5 Vertically integrated water vapor transport (shaded, unit: kg·m-1·s-1) and geopotential height at 850 hPa (contours, unit: dagpm, dash line indicate 586 dagpm line at 500 hPa) from 2 to 5 June in 2022 |
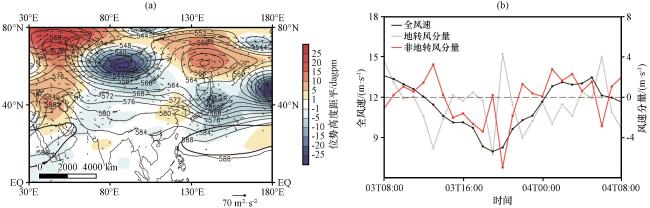
图6 2022年6月2日20:00至4日20:00平均的500 hPa位势高度(等值线, 单位: dagpm; 粗实线为气候态的588 dagpm线)及其距平(填色, 单位: dagpm), 波作用通量(矢量, 单位: m2·s-2)(a), 区域平均(108°E -111°E, 24.5°N -26°N)的850 hPa风速演变(单位: m·s-1)(b)Fig.6 Distribution of average geopotential height at 500 hPa (contours, unit: dagpm; thick solid line indicate climatological 588 dagpm isohypse) and its anomaly (shaded, unit: dagpm), wave activity flux (vector, unit: m2·s-2) from 20:00 on 2 to 20:00 on 4 June in 2022 (a), evolution of wind speed at 850 hPa (unit: m·s-1) averaged over (108°E -111°E, 24.5°N -26°N) (b) |
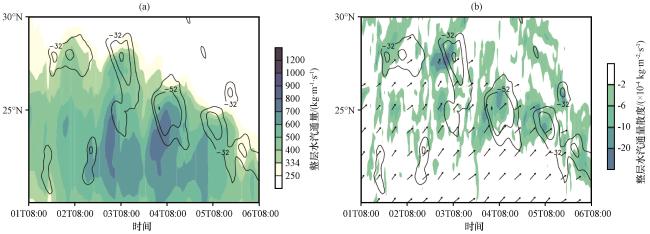
图8 2022年6月1日08:00至6日08:00的108°E -111°E平均整层水汽通量(填色, 单位: kg·m-1·s-1)和TBB(等值线, 单位: ℃)(a), 整层水汽通量(矢量, 单位: kg·m-1·s-1)及其散度(填色, 单位: ×10-4 kg·m-2·s-1)和TBB(等值线, 单位: ℃)(b)的时间-纬度剖面 (a)~(b)中只显示TBB≤-32 ℃的值, (b)中整层水汽通量只显示大于334 kg·m-1·s-1的值Fig.8 Time-longitude cross sections of IVT (shaded, unit: kg·m-1·s-1) and TBB (contour, unit: ℃) (a), IVT (vector, unit: kg·m-1·s-1) and its divergence (shaded, unit: ×10-4 kg·m-2·s-1), TBB (contour, unit: ℃) (b)averaged along 108°E -111°E from 08:00 on 1 to 08:00 on 6 June in 2022.(a)~(b) only show the value of TBB≤-32 ℃, (b) only show the value of IVT large than 334 kg·m-1·s-1 |
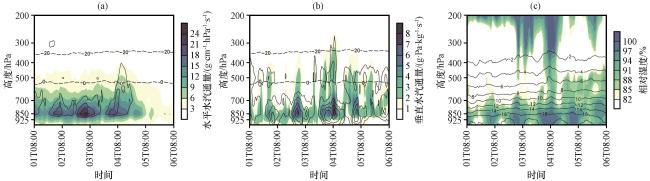
图9 区域平均的水平水汽通量(填色, 单位: g·cm-1·hPa-1·s-1)和风速(等值线, 单位: m·s-1, 只显示数值大于10, 间隔2)(a), 垂直水汽通量(填色, 单位: g·Pa·kg-1·s-1)和云水含量(等值线, 单位: g·kg-1, 只显示数值大于0.03, 间隔0.06)(b), 相对湿度(填色, 单位: %)和比湿(等值线, 单位: g·kg-1)(c)的时间-高度剖面 (a~b)中虚线为温度(单位: ℃)Fig.9 Time-height cross sections of the area-averaged horizontal vapor flux (shaded, unit: g·cm-1·hPa -1·s-1) and wind speed (contour, unit: m·s-1, only show the value large than 10, with interval of 2) (a), vertical vapor flux (shaded, unit: g·Pa·kg-1·s-1) and cloud liquid water content (contour, unit: g·kg-1, only show the value large than 0.03, with interval of 0.06) (b), relative humidity (shaded, unit: %) and specific humidity (contour, unit: g·kg-1) (c). Dashed line in (a) and (b) indicate the temperature(unit: ℃) |
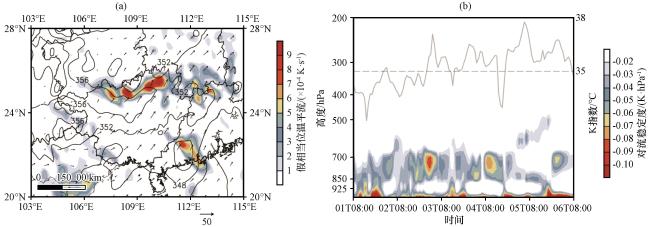
图10 2022年6月4日05:00 850 hPa假相当位温(等值线, 单位: K)及其平流(填色, 单位: ×10-4 K·s-1), 水汽通量(矢量, 单位: g·cm-1·hPa-1·s-1)(a), 区域平均的K指数时间序列(右坐标轴, 灰色线, 单位: ℃)与累积雨量最大站点(109.18°E, 25.36°N)的对流稳定度(填色, 单位: K·hPa-1)的时间-高度(左坐标轴)剖面(b)(b)中虚线为35 ℃的K指数参考线Fig.10 Distribution of 850 hPa θ se (contour, unit: K) and its advection (shaded, unit: ×10-4 K·s-1), vapor flux (vector, unit: g·cm-1·hPa-1·s-1) at 05:00 on 4 June in 2022 (a), time series of area-averaged K index (right coordinate axis, gray line, unit: ℃), time-height cross sections of -∂θ se/∂p (shaded, unit: K·hPa-1 ) at the greatest cumulative rainfall station (109.18°E, 25.36°N) (b).The dashed line in (b) is the 35 ℃ reference line of K index |
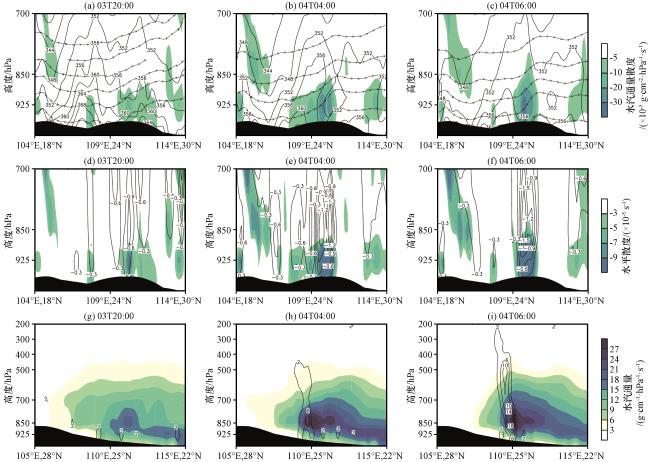
图12 2022年6月3 -4日沿AB垂直剖面上水汽通量散度(填色, 单位: ×10-5 g·cm-2·hPa-1·s-1)、 假相当位温(等值线, 单位: K)以及水汽环流分布(a~c), 水平散度(填色, 单位: ×10-5 s-1)和垂直速度(等值线, 仅显示小于-0.3 Pa·s-1的值)分布(d~f), 沿CD垂直剖面上的水汽通量(填色, 单位: g·cm-1·hPa-1·s-1)及垂直螺旋度(等值线, 单位: -1×10⁻⁵ Pa·s-2, 只显示大于2的数值)分布(g~i)黑色阴影为地形 Fig.12 Vertical cross sections of water vapor flux divergence (shaded, unit: ×10-5 g·cm-2·hPa-1·s-1), θ se (contour, unit: K) and water vapor circulation (a~c), horizontal divergence (shaded, unit: ×10-5 g·cm-2·hPa-1·s-1) and vertical velocity (contour, only show the value smaller than -0.3 Pa·s-1) (d~f) along AB, water vapor flux (shaded, unit: g·cm-1·hPa-1·s-1) and the vertical helicity (contour, unit: -10-5 Pa·s-2, only show the value large than 2) along CD (g~i) from 3 June to 4 June in 2022.The black shaded indicates the terrain |
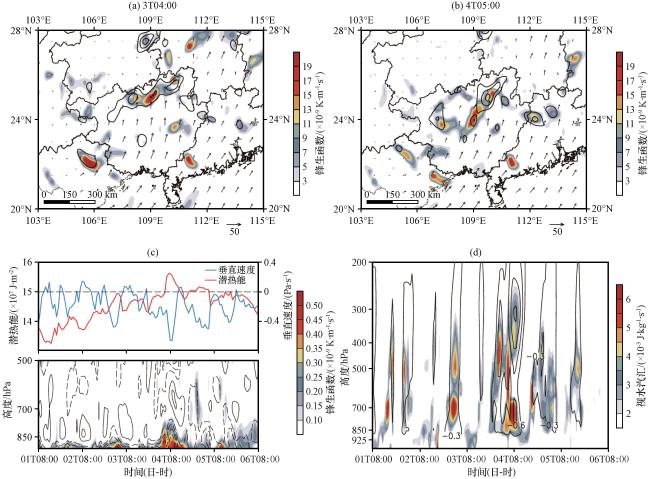
图13 2022年6月3 -4日925 hPa锋生函数(填色, 单位: ×10-9 K·m-1·s-1), 水汽通量(矢量, 单位: g·cm-1·hPa-1·s-1)及其散度(等值线, 单位: ×10-5 g·cm-2·hPa-1·s-1, 只显示小于-10的数值)(a, b), 区域平均的700 hPa垂直速度(单位: Pa·s-1)和潜热能(单位: ×107 J·m-2)时间序列(上图), 水平散度(等值线, 单位: ×10-4 s-1, 实线为辐散, 虚线为辐合)和锋生函数(填色, 单位: ×10-9 K·m-1·s-1)的时间-高度剖面(下图)(c), 上升运动(等值线, 仅显示小于-0.3 Pa·s-1的值)和视水汽汇(填色, 单位: ×10-3 J·kg-1·s-1)的时间-高度剖面(d)Fig.13 925 hPa frontogenesis function (shaded, unit: ×10-9 K·m-1·s-1), water vapor flux (vector, unit: g·cm-1·hPa-1·s-1) and its divergence (contour, unit: ×10-5 g·cm-2·hPa-1·s-1, only show the value small than -10) from 3 June to 4 June in 2022 (a, b), time series (upper figure) of area-averaged 700 hPa vertical velocity (unit: Pa·s-1) and latent energy (unit: ×107 J·m-2), time-height cross sections (lower figure) of area-averaged horizontal divergence (contour, unit: ×10-4 s-1, solid and dash line indicate divergence and convergence respectively) and frontogenesis function (shaded, unit: ×10-9 K·m-1·s-1) (c), time-height cross sections of ascending motion (contour, only show the value smaller than -0.3 Pa·s-1) and apparent moisture sink (shaded, unit: ×10-3 J·kg-1·s-1) (d) |
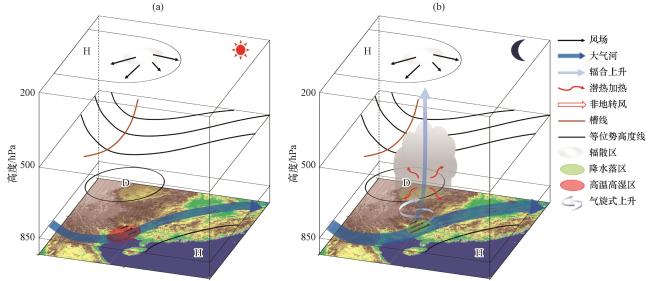
图14 2022年6月3 -4日大气河背景下广西暖区暴雨概念模型 (a)、 (b)分别为日间、 夜间, H为南亚高压或副高, D为低涡Fig.14 Conceptual model of nocturnal warm-sector torrential rain under the background of atmospheric river from 3 June to 4 June in 2022 in Guangxi (a) and (b) indicate day and night respectively, H indicate the South Asia high or Western Pacific Subtropical high, D indicate the vortex |
|
{{custom_citation.content}}
{{custom_citation.annotation}}
|
|
{{custom_citation.content}}
{{custom_citation.annotation}}
|
|
{{custom_citation.content}}
{{custom_citation.annotation}}
|
|
{{custom_citation.content}}
{{custom_citation.annotation}}
|
|
{{custom_citation.content}}
{{custom_citation.annotation}}
|
|
{{custom_citation.content}}
{{custom_citation.annotation}}
|
|
{{custom_citation.content}}
{{custom_citation.annotation}}
|
|
{{custom_citation.content}}
{{custom_citation.annotation}}
|
|
{{custom_citation.content}}
{{custom_citation.annotation}}
|
|
{{custom_citation.content}}
{{custom_citation.annotation}}
|
|
{{custom_citation.content}}
{{custom_citation.annotation}}
|
|
{{custom_citation.content}}
{{custom_citation.annotation}}
|
|
{{custom_citation.content}}
{{custom_citation.annotation}}
|
|
{{custom_citation.content}}
{{custom_citation.annotation}}
|
|
{{custom_citation.content}}
{{custom_citation.annotation}}
|
|
{{custom_citation.content}}
{{custom_citation.annotation}}
|
|
{{custom_citation.content}}
{{custom_citation.annotation}}
|
|
{{custom_citation.content}}
{{custom_citation.annotation}}
|
|
{{custom_citation.content}}
{{custom_citation.annotation}}
|
|
{{custom_citation.content}}
{{custom_citation.annotation}}
|
|
蔡荣辉, 陈静静, 文萍, 等, 2019.2017年湖南一次特大致洪暴雨过程的水汽特征[J].干旱气象, 37(2): 288-300.
{{custom_citation.content}}
{{custom_citation.annotation}}
|
|
丁一汇, 柳艳菊, 宋亚芳, 2020.东亚夏季风水汽输送带及其对中国大暴雨与洪涝灾害的影响[J].水科学进展, 31(5): 629-643.DOI: 10.14042/j.cnki.32.1309.2020.05.001.Ding Y H ,
{{custom_citation.content}}
{{custom_citation.annotation}}
|
|
傅刚, 刘珊, 李晓东, 等, 2019.“大气河”研究进展回顾[J].中国海洋大学学报(自然科学版), 49(10): 10-17.DOI: 10.16441/j.cnki.hdxb.20190251.Fu ,
{{custom_citation.content}}
{{custom_citation.annotation}}
|
|
韩雪蕾, 王咏青, 纪旭鹏, 等, 2021.一次大气河背景下华北地区暴雨的诊断分析[J].气象科学, 41(2): 200-208.DOI: 10.12306/2020jms.0091.Han X L ,
{{custom_citation.content}}
{{custom_citation.annotation}}
|
|
黄慧君, 郑建萌, 马涛, 等, 2023.夏季高原低涡切变影响下云南大雨暴雨的分布及成因研究[J].高原气象, 42(2): 403-416.DOI: 10.7522/j.issn.1000-0534.2021.00114.Huang H J ,
{{custom_citation.content}}
{{custom_citation.annotation}}
|
|
黄子怡, 赵宇, 李树岭, 等, 2023.东北地区温带气旋暴雪过程的大气河特征[J].高原气象, 42(3): 734-747.DOI: 10.7522/j.issn.1000-0534.2022.00076.Huang Z Y ,
{{custom_citation.content}}
{{custom_citation.annotation}}
|
|
刘芸芸, 丁一汇, 2020.2020年超强梅雨特征及其成因分析[J].气象, 46(11): 1393-1404.DOI: 10.7519/j.issn.1000-0526.2020.11.001.Liu Y Y ,
{{custom_citation.content}}
{{custom_citation.annotation}}
|
|
骆凯, 李耀东, 秦丽, 2010.一次华北暴雨过程的数值模拟及水汽过程分析[J].暴雨灾害, 29(4): 307-314.
{{custom_citation.content}}
{{custom_citation.annotation}}
|
|
苗春生, 杨艺亚, 王坚红, 等, 2017.两类华南沿海暖区暴雨特征及热力发展机制对比研究[J].热带气象学报, 33(1): 53-63.DOI: 10.16032/j.issn.1004-4965.2017.01.006.Miao C S ,
{{custom_citation.content}}
{{custom_citation.annotation}}
|
|
齐道日娜, 何立富, 王秀明, 等, 2022.“7·20”河南极端暴雨精细观测及热动力成因[J].应用气象学报, 33(1): 1-15.DOI: 10. 11898/1001-7313.20220101.Chyi D , HeL F, WangXM, et al, 2022.Fine observation characteristics and thermodynamic mechanisms of extreme heavy rainfall in Henan on 20 July 2021[J].Journal of Applied Meteorological Science, 33(1): 1-15.DOI: 10.11898/1001-7313.20220101 .
{{custom_citation.content}}
{{custom_citation.annotation}}
|
|
冉令坤, 李舒文, 周玉淑, 等, 2021.2021年河南“7·20”极端暴雨动、 热力和水汽特征观测分析[J].大气科学, 45(6): 1366-1383.DOI: 10.3878/j.issn.1006-9895.2109.21160.Ran L K ,
{{custom_citation.content}}
{{custom_citation.annotation}}
|
|
史月琴, 高松影, 孙晶, 等, 2022.辽宁一次区域性暴雨的特征条件与成因分析[J].高原气象, 41(3): 630-645.DOI: 10.7522/j.issn.1000-0534.2021.00094.Shi Y Q ,
{{custom_citation.content}}
{{custom_citation.annotation}}
|
|
孙莎莎, 陈博宇, 孙军, 等, 2023.台风摩羯(1814)引发山东持续性强降水的阶段性特征及其成因分析[J].高原气象, 42(4): 962-977.DOI: 10.7522/j.issn.1000-0534.2022.00052.Sun S S ,
{{custom_citation.content}}
{{custom_citation.annotation}}
|
|
孙颖姝, 王咏青, 沈新勇, 等, 2018.一次“大气河”背景下东北冷涡暴雨的诊断分析[J].高原气象, 37(4): 970-980.DOI: 10.7522/j.issn.1000-0534.2018.00005.Sun Y S ,
{{custom_citation.content}}
{{custom_citation.annotation}}
|
|
王坚红, 杨艺亚, 苗春生, 等, 2017.华南沿海暖区辐合线暴雨地形动力机制数值模拟研究[J].大气科学, 41(4): 784-796.DOI: 10.3878/j.issn.1006-9895.1702.16182.Wang J H ,
{{custom_citation.content}}
{{custom_citation.annotation}}
|
|
吴亚丽, 蒙伟光, 陈德辉, 等, 2018.一次华南暖区暴雨过程可预报性的初值影响研究[J].气象学报, 76(3): 323-342.DOI: 10.11676/qxxb2018.001.Wu Y L ,
{{custom_citation.content}}
{{custom_citation.annotation}}
|
|
叶朗明, 苗峻峰, 2014.华南一次典型回流暖区暴雨过程的中尺度分析[J].暴雨灾害, 33(1): 342-350.DOI: 10.3969/j.issn.1004-9045.2014.04.006.Ye L M ,
{{custom_citation.content}}
{{custom_citation.annotation}}
|
|
曾智琳, 谌芸, 朱克云, 2019.2017年6月一次华南沿海强降水的对流性特征及热动力机制研究[J].大气科学, 43(6): 1295-1312.DOI: 10.3878/j.issn.1006-9895.1901.18207.Zeng Z L , ChenY, ZhuK Y, 2019.Convective characteristics and thermal dynamic mechanisms for coastal torrential rainfall over South China during June 2017[J].Chinese Journal of Atmospheric Sciences, 43(6): 1295-1312.DOI: 10.3878/j.issn.1006-9895.1901. 18207 .
{{custom_citation.content}}
{{custom_citation.annotation}}
|
|
赵强, 王楠, 高星星, 等, 2021.西安连续两天短时暴雨的对流条件及触发机制对比分析[J].高原气象, 40(4): 801-814.DOI: 10.7522/j.issn.1000-0534.2020.00053.Zhao Q ,
{{custom_citation.content}}
{{custom_citation.annotation}}
|
| {{custom_ref.label}} |
{{custom_citation.content}}
{{custom_citation.annotation}}
|
PDF(14452 KB)
 表1 2010 -2022年广西暖区暴雨个例
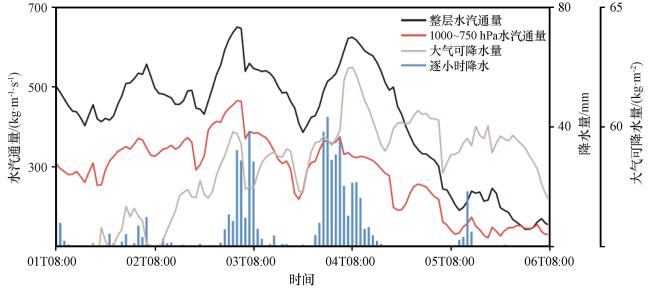
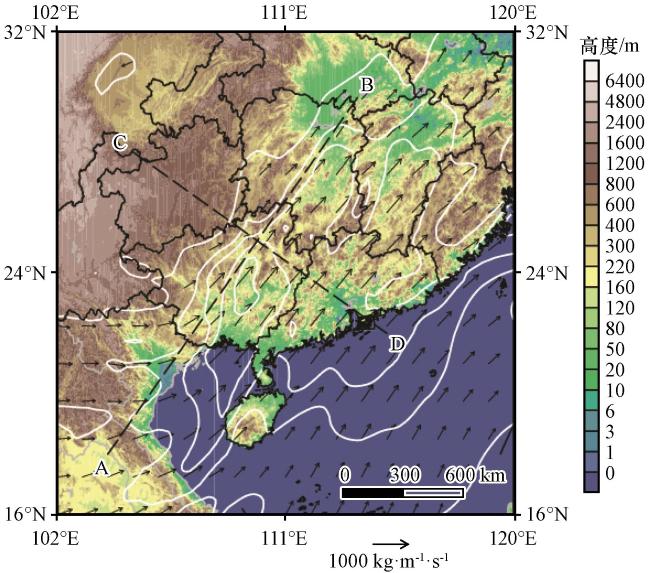
 图1 降水强度与大气河最大强度的散点分布图2 区域平均的大气河方向角(a), 2022年6月19 -20日(b)和2017年7月10 -11日(c)平均的整层水汽通量(填色和矢量, 单位: kg·m-1·s-1)(b)~(c)中红色框内为计算大气河强度及方向角区域图3 2022年6月2日20:00至4日20:00过程累计雨量(a, 单位: mm)以及各代表站逐小时降雨量序列(b)(a)中虚线框范为强降水关键区, (b)中虚线为20 mm小时雨量参考线图4 2022年6月3 -4日200 hPa的散度(填色, 单位: ×10-5 s-1; 粗实线为200 hPa的1250 dagpm等值线)、 风场(风羽, 单位: m·s-1)以及500 hPa高度场(等值线, 单位: dagpm)(a, b), 700 hPa高度场(等值线, 单位: dagpm)和850 hPa风场(填色及风羽, 单位: m·s-1)(c, d)图5 2022年6月2-5日的整层水汽通量(填色, 单位: kg·m-1·s-1), 850 hPa高度场(等值线, 单位: dagpm; 虚线为500 hPa的586 dagpm等值线)图6 2022年6月2日20:00至4日20:00平均的500 hPa位势高度(等值线, 单位: dagpm; 粗实线为气候态的588 dagpm线)及其距平(填色, 单位: dagpm), 波作用通量(矢量, 单位: m2·s-2)(a), 区域平均(108°E -111°E, 24.5°N -26°N)的850 hPa风速演变(单位: m·s-1)(b)图7 2022年6月1日08:00至6日08:00代表站平均的逐小时降水量(单位: mm), 区域平均的大气可降水量(单位: kg·m-2)和水汽通量(单位: kg·m-1·s-1)图8 2022年6月1日08:00至6日08:00的108°E -111°E平均整层水汽通量(填色, 单位: kg·m-1·s-1)和TBB(等值线, 单位: ℃)(a), 整层水汽通量(矢量, 单位: kg·m-1·s-1)及其散度(填色, 单位: ×10-4 kg·m-2·s-1)和TBB(等值线, 单位: ℃)(b)的时间-纬度剖面 (a)~(b)中只显示TBB≤-32 ℃的值, (b)中整层水汽通量只显示大于334 kg·m-1·s-1的值图9 区域平均的水平水汽通量(填色, 单位: g·cm-1·hPa-1·s-1)和风速(等值线, 单位: m·s-1, 只显示数值大于10, 间隔2)(a), 垂直水汽通量(填色, 单位: g·Pa·kg-1·s-1)和云水含量(等值线, 单位: g·kg-1, 只显示数值大于0.03, 间隔0.06)(b), 相对湿度(填色, 单位: %)和比湿(等值线, 单位: g·kg-1)(c)的时间-高度剖面 (a~b)中虚线为温度(单位: ℃)图10 2022年6月4日05:00 850 hPa假相当位温(等值线, 单位: K)及其平流(填色, 单位: ×10-4 K·s-1), 水汽通量(矢量, 单位: g·cm-1·hPa-1·s-1)(a), 区域平均的K指数时间序列(右坐标轴, 灰色线, 单位: ℃)与累积雨量最大站点(109.18°E, 25.36°N)的对流稳定度(填色, 单位: K·hPa-1)的时间-高度(左坐标轴)剖面(b)(b)中虚线为35 ℃的K指数参考线图11 2022年6月4日04:00整层水汽通量(矢量和等值线, 单位: kg·m-1·s-1, 只显示数值大于334的情况)和地形高度(填色, 单位: m)图12 2022年6月3 -4日沿AB垂直剖面上水汽通量散度(填色, 单位: ×10-5 g·cm-2·hPa-1·s-1)、 假相当位温(等值线, 单位: K)以及水汽环流分布(a~c), 水平散度(填色, 单位: ×10-5 s-1)和垂直速度(等值线, 仅显示小于-0.3 Pa·s-1的值)分布(d~f), 沿CD垂直剖面上的水汽通量(填色, 单位: g·cm-1·hPa-1·s-1)及垂直螺旋度(等值线, 单位: -1×10⁻⁵ Pa·s-2, 只显示大于2的数值)分布(g~i)图13 2022年6月3 -4日925 hPa锋生函数(填色, 单位: ×10-9 K·m-1·s-1), 水汽通量(矢量, 单位: g·cm-1·hPa-1·s-1)及其散度(等值线, 单位: ×10-5 g·cm-2·hPa-1·s-1, 只显示小于-10的数值)(a, b), 区域平均的700 hPa垂直速度(单位: Pa·s-1)和潜热能(单位: ×107 J·m-2)时间序列(上图), 水平散度(等值线, 单位: ×10-4 s-1, 实线为辐散, 虚线为辐合)和锋生函数(填色, 单位: ×10-9 K·m-1·s-1)的时间-高度剖面(下图)(c), 上升运动(等值线, 仅显示小于-0.3 Pa·s-1的值)和视水汽汇(填色, 单位: ×10-3 J·kg-1·s-1)的时间-高度剖面(d)图14 2022年6月3 -4日大气河背景下广西暖区暴雨概念模型 (a)、 (b)分别为日间、 夜间, H为南亚高压或副高, D为低涡
/
| 〈 |
|
〉 |
