 PDF(13063 KB)

秦巴山区夏季降水异常年水汽输送特征分析
杨镒如, 王斌, 李双双, 邢莉, 毛兴莉, 尚溦, 石培宏, 程颖, 段克勤
PDF(13063 KB)
秦巴山区夏季降水异常年水汽输送特征分析
Summer Water Vapor Transport and Sources in Anomalous Precipitation Years over the Qinba Mountains
秦岭-大巴山合称秦巴山区, 被称为我国的“中央水塔”, 是南北过渡带的主体组成部分, 对我国自然环境演变起着至关重要的调节作用。然而当前对于秦巴山区降水的水汽源地贡献量和变化成因尚不清楚, 严重制约了对其影响我国南北地理分界深层机理的理解。鉴于此, 基于HYSPLIT(Hybrid Single Particle Lagrangian Integrated Trajectory)拉格朗日轨迹追踪模式, 对1970 -2020年降水高、 低值年夏季降水进行后向轨迹追踪模拟, 并结合欧拉方法计算水汽通量及风场距平, 系统分析了秦巴山区6 -8月不同垂直高度层上的水汽输送路径与源地贡献特征。研究结果表明: (1)秦巴山区夏季主要水汽通道有: 局地通道、 欧亚通道、 西太平洋通道、 南海通道及印度洋通道。(2)从通道强度看, 降水高值年低层主要水汽通道为局地和南海通道; 中、 高层主要通道为欧亚通道和印度洋通道。降水低值年6 -8月各层主要通道几乎均为欧亚通道。(3)从源地贡献看, 高值年低层主要水汽源地为局地及南海地区, 低值年低层南海、 欧亚及西太平洋地区水汽贡献相当, 中、 高层主要源地为欧亚和印度洋地区。(4)东南地区环流异常与秦巴山区夏季降水量变化高度一致, 该地反气旋性及气旋性异常环流特征对降水高、 低值年水汽输送差异影响显著。研究结果初步揭示了秦巴山区夏季降水异常年的水汽输送特征和变化成因, 为进一步理解“中央水塔”的成因和秦巴山区的地理分界作用提供了关键证据。
The Qinling-Daba Mountains (Qinba Mountains) are referred to as the‘Central Water Tower’of China.They constitute the main transitional zone between the north and south and play a crucial regulatory role in the evolution of the natural environment.However, the current understanding of the contributions and causes of water vapor sources in the Qinba Mountains remains unclear, significantly impeding the comprehension of the underlying mechanisms that influence the geographical division between the north and south of China.In this study, we simulate the vapor trajectory in summer of years with high and low precipitation from 1970 to 2020 using the HYSPLIT model, and calculates the anomalies of vapor and wind using Eulerian method.The characteristics of vapor transport pathways and source contributions at different vertical levels from June to August over the Qinba Mountains were systematically analyzed.The results showed that: (1)The main summer water vapor channels in the Qinba Mountains are: the local channel, the Eurasian channel, the Western Pacific channel, the South China Sea channel and the Indian Ocean channel.(2)In terms of channel strength, the main vapor channels at the lower levels in high precipitation years are the local and South China Sea channels; that at the middle and upper levels are the Eurasian channel and the Indian Ocean channel.In the low precipitation year, the main channel at all levels is the Eurasian channel.(3)In terms of source contributions, the main source at the lower level in high precipitation years is the local and the South China Sea, that at the lower level in low years is the local, South China Sea and western Pacific.The main source at the middle and upper levels is the north Indian Ocean.(4)The anomalous characteristics of anticyclones and cyclonic circulation in the southeast have a significant impact on the difference in water vapor transport between high and low precipitation years.This study provides preliminary insights into the vapor transport characteristics during summer over the Qinba Mountains, thereby advancing our understanding of the underlying mechanisms of the Central Water Tower phenomenon and the geographic differentiation role of the Qinba Mountain region.
HYSPLIT模式 / 秦巴山区 / 降水异常 / 水汽输送 / 水汽源地 {{custom_keyword}} /
HYSPLIT model / Qinba Mountains / precipitation anomalies / vapor transport / vapor sources {{custom_keyword}} /
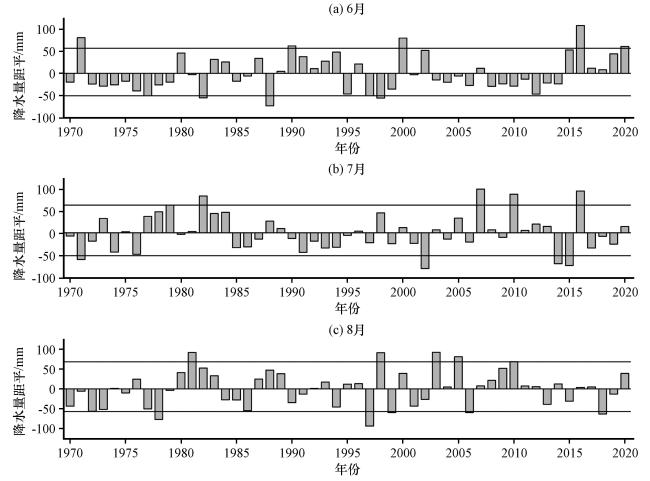
图3 秦巴地区1970 -2020年6 -8月降水量距平逐年变化Fig.3 Interannual variation of precipitation anomaly in the June-August from 1970 to 2020 over the Qinba Mountains |
表1 降水异常年份选取Table 1 Selection the years of precipitation anomaly |
| 月份 | 降水高值年 | 降水低值年 |
|---|---|---|
| 6月 | 1971 1990 2000 2016 2020 | 1977 1997 1982 1988 1998 |
| 7月 | 1979 1982 2007 2010 2016 | 1971 2002 2014 2015 |
| 8月 | 1981 1998 2003 2005 2010 | 1978 1997 1999 2006 2018 |
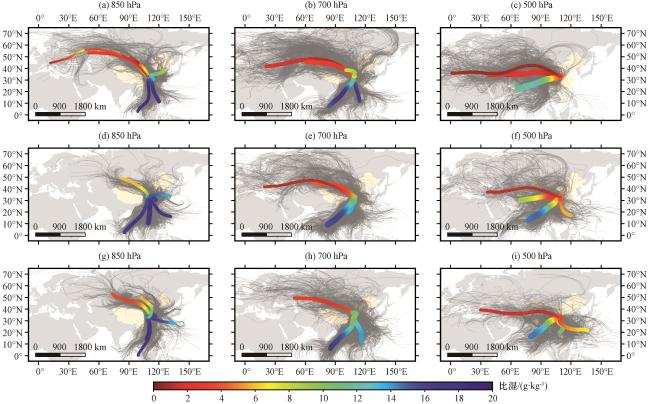
图4 降水高值年6月(a~c)、 7月(d~f)、 8月(g~i)在850 hPa(左, AGL=500 m)、 700 hPa(中, AGL=2000 m)以及500 hPa(右, AGL=5000 m)的水汽通道特征灰色细线为模式输出的原始气块运移轨迹, 彩色线为聚类后的轨迹结果, 粗细表示该通道聚类前包含的轨迹数量, 颜色表示通道上包含所有轨迹的平均比湿(单位: g·kg-1) Fig.4 Water vapor channel characteristics in June (a~c), July (d~f), and August (g~i) at 850 hPa (left, AGL=500 m), 700 hPa(center, AGL=2000 m), and 500 hPa (right.AGL=5000 m) in the high precipitation years.The thin gray line is the original gas block migration trajectory output by the mode, the colored line is the trajectory result after clustering, The channel thickness indicates the number of trajectories included in the channel before clustering, and the colour indicates the average specific humidity (units: g·kg-1) of all trajectories included in the channel |
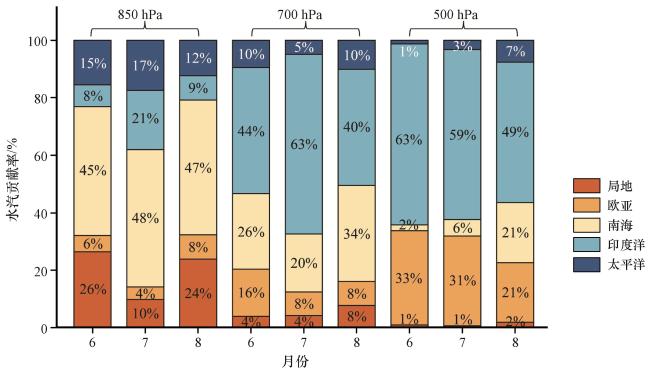
表2 秦巴地区降水高值年6-8月各通道在不同高度层的轨迹数量占比Table 2 The ratio of the trajectories’ number of each channel in June-August of the high precipitation years at different vertical heights over the Qinba Mountains |
| 高度层 | 月份 | 局地 | 欧亚大陆 | 南海 | 印度洋 | 太平洋 |
|---|---|---|---|---|---|---|
| 850 hPa | 6月 | 24.69% | 21.47% | 30.80% | 5.17% | 17.87% |
| 7月 | 17.71% | 10.84% | 42.15% | 14.84% | 14.45% | |
| 8月 | 20.72% | 24.56% | 35.26% | 6.76% | 12.70% | |
| 700 hPa | 6月 | 3.77% | 48.31% | 13.92% | 25.12% | 8.88% |
| 7月 | 3.82% | 27.11% | 16.00% | 48.46% | 4.61% | |
| 8月 | 7.02% | 23.59% | 27.45% | 31.59% | 10.36% | |
| 500 hPa | 6月 | 0.97% | 67.97% | 0.93% | 28.92% | 1.13% |
| 7月 | 0.52% | 43.66% | 8.16% | 42.06% | 5.62% | |
| 8月 | 2.42% | 28.35% | 21.54% | 34.41% | 13.31% |
| 加粗字体表示轨迹数量占比较大的通道, 表示主要水汽通道(Bold font indicates the channel with a relatively large number of tracks in each channel) |
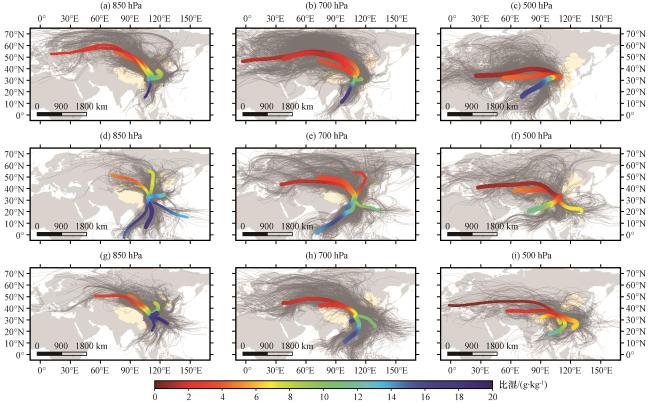
图6 降水低值年 6月(a~c)、 7月(d~f)、 8月(g~i)在850 hPa(左, AGL=500 m)、 700 hPa(中, AGL=2000 m)以及500 hPa(右, AGL=5000 m)的水汽通道特征灰色细线为模式输出的原始气块运移轨迹, 彩色线为聚类后的轨迹结果, 粗细表示该通道聚类前包含的轨迹数量, 颜色表示通道上包含所有轨迹的平均比湿(单位: g·kg-1) Fig.6 Water vapor channel characteristics in June (a~c), July (d~f), and August (g~i) at 850 hPa (left, AGL=500 m), 700 hPa(center, AGL=2000 m), and 500 hPa (right, AGL=5000 m) of the low precipitation years.The thin gray line is the original gas block migration trajectory output by the mode, the colored line is the trajectory result after clustering, The channel thickness indicates the number of trajectories included in the channel before clustering, and the colour indicates the average specific humidity (units: g·kg-1) of all trajectories included in the channel |
表3 秦巴地区降水低值年6 -8月各通道在不同高度层的轨迹数量占比Table 3 The ratio of the trajectories’ number of each channel in June-August of the low precipitation years at different vertical heights over the Qinba Mountains |
| 高度层 | 月份 | 局地 | 欧亚大陆 | 南海 | 印度洋 | 太平洋 |
|---|---|---|---|---|---|---|
| 850 hPa | 6月 | 20.91% | 51.43% | 10.41% | 1.41% | 15.86% |
| 7月 | 14.88% | 22.62% | 22.42% | 13.11% | 26.97% | |
| 8月 | 19.12% | 28.23% | 21.58% | 1.54% | 29.53% | |
| 700 hPa | 6月 | 4.54% | 77.42% | 8.39% | 6.90% | 2.75% |
| 7月 | 4.52% | 50.28% | 10.75% | 23.77% | 10.69% | |
| 8月 | 4.53% | 40.80% | 22.70% | 13.77% | 18.20% | |
| 500 hPa | 6月 | 1.45% | 65.21% | 2.14% | 30.82% | 0.40% |
| 7月 | 2.89% | 53.29% | 8.19% | 22.55% | 13.08% | |
| 8月 | 8.60% | 35.69% | 20.15% | 13.95% | 21.62% |
| 加粗字体表示轨迹数量占比较大的通道, 表示主要水汽通道(Bold font indicates the channel with a relatively large number of tracks in each channel) |
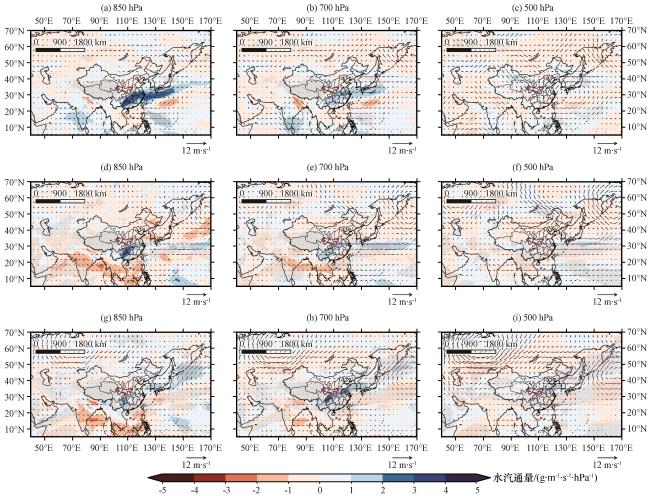
图8 降水高值年6月(a~c)、 7月(d~f)、 8月(g~i)850 hPa(左, AGL=500 m)、 700 hPa(中, AGL=2000 m)以及500 hPa(右, AGL=5000 m)水汽通量与1970 -2020年同期水汽通量(彩色区, 单位: g·m-1·s-1·hPa-1)及风场(矢量, 单位: m·s-1)的合成分析灰色阴影和红色箭头分别为通过显著性检验的水汽通量和风场, 红色实线范围表示秦巴山区范围 Fig.8 Water vapor fluxes anomalies (color area, unit: g·m-1·s-1·hPa-1) and wind anomalies (vectors, unit: m·s-1) in June (a~c), July (d~f), and August (g~i) at 850 hPa (left, AGL=500 m), 700 hPa (center, AGL=2000 m), and 500 hPa(right, AGL= 5000 m) in high precipitation years.The grey shading and the red arrows are respectively the water vapor fluxes and wind fields that passed the significance test, the solid red line range indicates the range of Qinba Mountain |
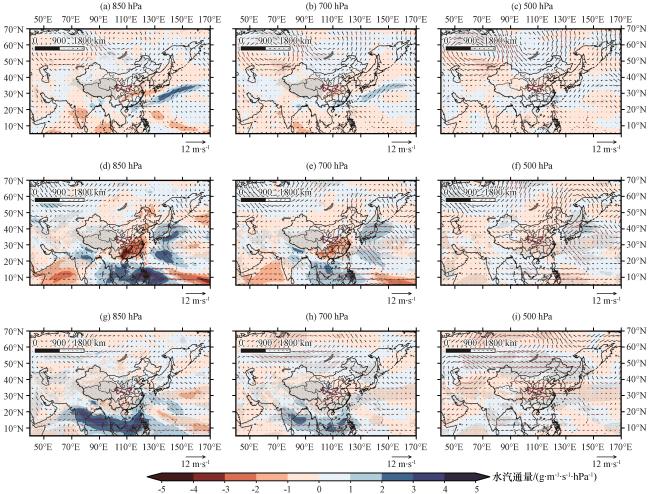
图9 降水低值年6月(a~c)、 7月(d~f)、 8月(g~i)850 hPa(左, AGL=500 m)、 700 hPa(中, AGL=2000 m)以及500 hPa(右, AGL=5000 m)水汽通量与1970 -2020年同期水汽通量(彩色区, 单位: g·m-1·s-1·hPa-1)及风场(矢量, 单位: m·s-1)的合成分析Fig.9 Water vapor fluxes anomalies (color area, unit: g·m-1·s-1·hPa-1) and wind anomalies (vectors, unit: m·s-1) in June (a~c), July (d~f), and August (g~i) at 850 hPa (left, AGL=500 m), 700 hPa (center, AGL=2000 m), and 500 hPa (right, AGL= 5000 m) in low precipitation years.The grey shading and the red arrows are respectively the water vapor fluxes and wind fields that passed the significance test, the solid red line range indicates the range of Qinba Mountain |
|
{{custom_citation.content}}
{{custom_citation.annotation}}
|
|
{{custom_citation.content}}
{{custom_citation.annotation}}
|
|
{{custom_citation.content}}
{{custom_citation.annotation}}
|
|
{{custom_citation.content}}
{{custom_citation.annotation}}
|
|
{{custom_citation.content}}
{{custom_citation.annotation}}
|
|
{{custom_citation.content}}
{{custom_citation.annotation}}
|
|
{{custom_citation.content}}
{{custom_citation.annotation}}
|
|
{{custom_citation.content}}
{{custom_citation.annotation}}
|
|
晁智龙,
{{custom_citation.content}}
{{custom_citation.annotation}}
|
|
杜一博, 李双双, 冯典, 等, 2024.全球变暖背景下陕西省夏季极端降水及其大尺度环流特征[J].高原气象, 43(2): 342-352.DOI: 10.7522/j.issn.1000-0534.2023.00062.Du Y B ,
{{custom_citation.content}}
{{custom_citation.annotation}}
|
|
黄秉维, 1958.中国综合自然区划的初步草案[J].地理学报, 24(4): 348-365.
{{custom_citation.content}}
{{custom_citation.annotation}}
|
|
孔祥伟, 李晨蕊, 杨秀梅, 等, 2024.甘肃河东夏季区域性短时强降水环流形势分类特征[J].高原气象, 43(2): 329-341.DOI: 10.7522/j.issn.1000-0534.2023.00056.Kong X W ,
{{custom_citation.content}}
{{custom_citation.annotation}}
|
|
李国翠, 钤伟妙, 车少静, 等, 2023.“21·7”特大暴雨系统北上引发太行山中段区域大暴雨成因分析[J].高原气象, 42(5): 1260-1270.DOI: 10.7522/j.issn.1000-0534.2022.00109.Li G C , QianWM, CheS J, et al, 2023.Characteristics and synoptic analysis of a regional heavy rain in midle part of Taihang Mountains caused by“21·7”torrential rain system moving northward[J].Plateau Meteorology, 42(5): 1260-1270.DOI: 10.7522/j.issn.1000-0534.2022.00109 .
{{custom_citation.content}}
{{custom_citation.annotation}}
|
|
刘荷, 邓晨晖, 邵景安, 等, 2021.1964-2017年秦岭山地降水时空变化特征及其南北差异[J].水土保持研究, 28(2): 210-216+223.DOI: 10.13869/j.cnki.rswc.2021.02.030.Liu H ,
{{custom_citation.content}}
{{custom_citation.annotation}}
|
|
李虎, 潘小多, 2022.青藏高原水汽输送过程及水汽源地研究方法综述[J].地球科学进展, 37(10): 1025-1036.DOI: 10.11867/j.issn.1001-8166.2022.049.Li H ,
{{custom_citation.content}}
{{custom_citation.annotation}}
|
|
刘俊杰, 张百平, 姚永慧, 等, 2022.秦巴山地植物南北变化与过渡模式研究[J].地理学报, 77(11): 2773-2786.DOI: 10.11821/dlxb202211006.Liu J J ,
{{custom_citation.content}}
{{custom_citation.annotation}}
|
|
李玲萍, 王博, 李天江, 等, 2023.河西走廊夏季旱涝和典型暴雨的水汽特征[J].高原气象, 42(4): 923-933.DOI: 10.7522/j.issn.1000-0534.2022.00058.Li L P ,
{{custom_citation.content}}
{{custom_citation.annotation}}
|
|
李明娟, 郭大梅, 冯典, 等, 2023.弱天气系统强迫下一次突发性大暴雨成因分析[J].高原气象, 42(4): 934-948.DOI: 10.7522/j.issn.1000-0534.2022.00101.Li M J ,
{{custom_citation.content}}
{{custom_citation.annotation}}
|
|
李双双, 汪成博, 延军平, 等, 2020.面向事件过程的秦岭南北极端降水时空变化特征[J].地理学报, 75(5): 989-1007.
{{custom_citation.content}}
{{custom_citation.annotation}}
|
|
李双双, 杨赛霓, 刘宪锋, 2015.1960-2013年秦岭-淮河南北极端降水时空变化特征及其影响因素[J].地理科学进展, 34(3): 354-363.DOI: 10.11820/dlkxjz.2015.03.010.Li S S ,
{{custom_citation.content}}
{{custom_citation.annotation}}
|
|
刘胜男, 冯典, 郭大梅, 等, 2023.秦岭山区东麓一次短时强降水特征及成因分析[J].中低纬山地气象, 47(1): 82-89.
{{custom_citation.content}}
{{custom_citation.annotation}}
|
|
廖伟, 程志刚, 李跃清, 2020.基于TRMM数据的秦巴山区降水特征分析[J].高原山地气象研究, 40(1): 11-17.
{{custom_citation.content}}
{{custom_citation.annotation}}
|
|
刘煜, 刘蓉, 王欣, 等, 2022.基于拉格朗日方法评估青藏高原若尔盖地区水汽输送特征[J].高原气象, 41(1): 58-67.DOI: 10.7522/ j.issn.1000-0534.2021.00100.Liu Y ,
{{custom_citation.content}}
{{custom_citation.annotation}}
|
|
苏军锋, 张锋, 黄玉霞, 等, 2021.甘肃陇南市短时强降水时空分布特征及中尺度分析[J].干旱气象, 39(6): 966-973.DOI: 10.11755/j.issn.1006-7639(2021)-06-0966.Su J F ,
{{custom_citation.content}}
{{custom_citation.annotation}}
|
|
宋琳琳, 郝成元, 何素楠, 2021.秦岭南北降水空间分异研究[J].地球与环境, 49(6): 615-622.DOI: 10.14050/j.cnki.1672-9250.2021.49.049.Song L L ,
{{custom_citation.content}}
{{custom_citation.annotation}}
|
|
王楠, 赵强, 井宇, 等, 2018.秦岭北麓一次冷锋触发的短时强降水成因分析[J].高原气象, 37(5): 1277-1288.DOI: 10.7522/j.issn.1000-0534.2017.00070.Wang N ,
{{custom_citation.content}}
{{custom_citation.annotation}}
|
|
王曼, 许美玲, 段旭, 等, 2022.影响云南高原地区的南海西行台风水汽输送特征[J].高原气象, 41(3): 584-592.DOI: 10.7522/j.issn.1000-0534.2020.00109.Wang M ,
{{custom_citation.content}}
{{custom_citation.annotation}}
|
|
王卫国, 李弘毅, 朱小凡, 等, 2022.1979-2018年青藏高原不同地区积雪季极端降水水汽来源分析[J].高原气象, 41(6): 1367-1383.DOI: 10.7522/i.issn.1000-0534.2021.00080.Wang W G ,
{{custom_citation.content}}
{{custom_citation.annotation}}
|
|
王晓玲, 任燕, 2012.秦岭山区近50年降水差异及可能局地成因探讨[J].气候与环境研究, 17(6): 911-918.DOI: 10.3878/j.issn.1006-9585.2012.06.28.Wang X L ,
{{custom_citation.content}}
{{custom_citation.annotation}}
|
|
王志毅, 高庆九, 胡邦辉, 等, 2017.近 50 a 江淮地区梅雨期水汽输送特征研究[J].大气科学学报, 40(1): 48-60.DOI: 10.13878/j.cnki.dqkxxb.20150916002.Wang Z Y ,
{{custom_citation.content}}
{{custom_citation.annotation}}
|
|
谢坤, 任雪娟, 2008.华北夏季大气水汽输送特征及其与夏季旱涝的关系[J].气象科学, 28(5): 508-514.DOI: 10.3969/j.issn.1009-0827.2008.05.006.Xie K ,
{{custom_citation.content}}
{{custom_citation.annotation}}
|
|
肖贻青, 娄盼星, 刘菊菊, 等, 2022.一次中-γ尺度短时大暴雨的成因及可预报性分析[J].气象与环境科学, 45(4): 13-22.DOI: 10.16765/j.cnki.1673-7148.2022.04.002.Xiao Y Q ,
{{custom_citation.content}}
{{custom_citation.annotation}}
|
|
杨浩, 江志红, 刘征宇, 等, 2014.基于拉格朗日法的水汽输送气候特征分析——江淮梅雨和淮北雨季的对比[J].大气科学, 38(5): 965-973.DOI: 10.3878/j.issn.1006-9895.1402.13228.Yang H ,
{{custom_citation.content}}
{{custom_citation.annotation}}
|
|
叶佳意, 王天阳, 李凤全, 2021.2018年金华地区冬季异常降水的水汽输送特征[J].自然灾害学报, 30(4): 172-180.DOI: 10.13577/j.jnd.2021.0419.Ye J Y ,
{{custom_citation.content}}
{{custom_citation.annotation}}
|
|
杨晓柳, 王平, 高大威, 等, 2020.1979-2014年秦巴山区MSWEP降水数据精度评估及变化特征分析[J].水土保持研究, 27(6): 146-152.
{{custom_citation.content}}
{{custom_citation.annotation}}
|
|
张百平, 2019.中国南北过渡带研究的十大科学问题[J].地理科学进展, 38(3): 305-311.DOI: 10.18306/dlkxjz.2019.03.001.Zhang B P , 2019.Ten major scientific issues concerning the study of China’s north-south transitional zone[J].Progress in Geography, 38(3): 305-311.DOI: 10.18306/dlkxjz.2019.03.001 .
{{custom_citation.content}}
{{custom_citation.annotation}}
|
|
朱昌睿, 宋敏红, 张少波, 等, 2023.不同水汽源地对夏季青藏高原降水过程影响的模拟研究[J].高原气象, 42(5): 1129-1143.DOI: 10.7522/j.issn.1000-0534.2022.00092.Zhu C R ,
{{custom_citation.content}}
{{custom_citation.annotation}}
|
|
朱家宁, 杨显玉, 吕雅琼, 等, 2023.中国西南地区干湿年份水汽来源个例对比分析[J].高原气象, 42(6): 1504-1517.DOI: 10.7522/j.issn.1000-0534.2023.00001.Zhu J N ,
{{custom_citation.content}}
{{custom_citation.annotation}}
|
|
朱梅, 肖天贵, 余兴, 等, 2014.秦巴谷地夏季降水的时空特征分析[J].气象科技, 42(4): 663-670.DOI: 10.3969/j.issn.1671-6345.2014.04.024.Zhu M ,
{{custom_citation.content}}
{{custom_citation.annotation}}
|
|
张善红, 齐贵增, 苏凯, 等, 2022.近60 年秦岭山地旱涝变化规律[J].生态学报, 42(12): 4758-4769.DOI: 10.5846 /stxb202107191951.Zhang S H ,
{{custom_citation.content}}
{{custom_citation.annotation}}
|
|
赵松乔, 1983.中国综合自然地理区划的一个新方案[J].地理学报, 38(1): 1-10.DOI: 10.11821/xb198301001.Zhao S Q , 1983.A new scheme for comprehensive physical regionalization in China[J].Acta Geographica Sinica, 38(1): 1-10.DOI: 10.11821/xb198301001 .
{{custom_citation.content}}
{{custom_citation.annotation}}
|
|
折远洋, 王圣杰, 王鹏, 等, 2023.西秦岭地区大气降水氢氧稳定同位素特征[J].地球与环境, 51(2): 143-152.DOI: 10.14050/j.cnki.1672-9250.2022.50.038.Zhe Y Y ,
{{custom_citation.content}}
{{custom_citation.annotation}}
|
| {{custom_ref.label}} |
{{custom_citation.content}}
{{custom_citation.annotation}}
|
PDF(13063 KB)
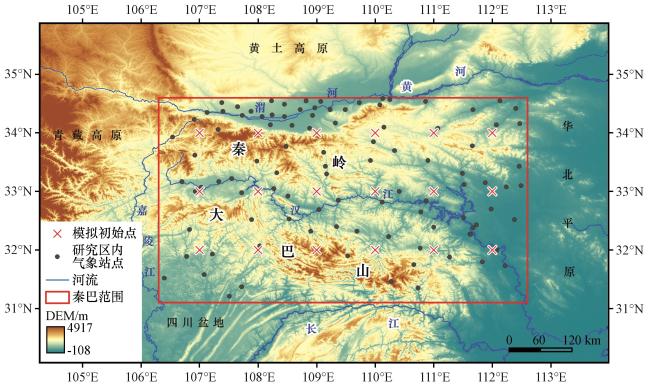
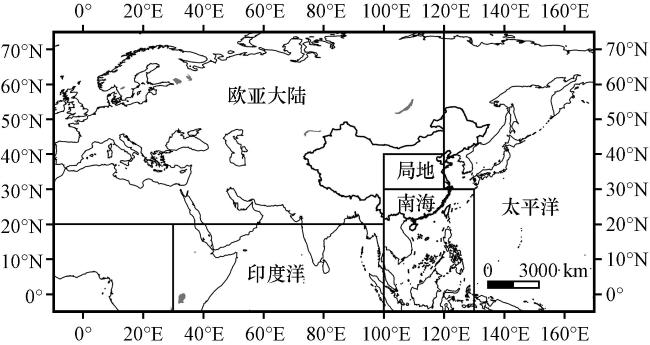
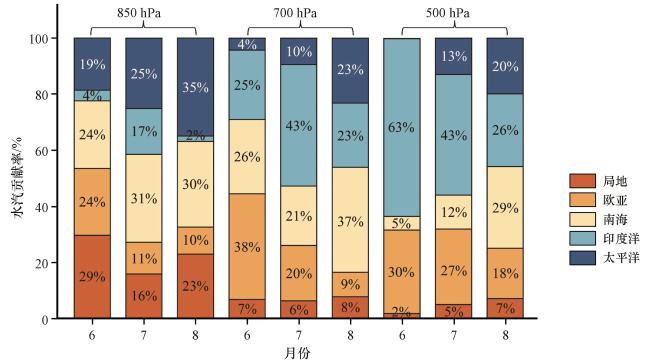
 图1 秦巴地区地形及气象站点分布图2 秦巴地区水汽源地的区域划分(局地、 欧亚大陆、 南海、 印度洋、 太平洋)图3 秦巴地区1970 -2020年6 -8月降水量距平逐年变化
 表1 降水异常年份选取图4 降水高值年6月(a~c)、 7月(d~f)、 8月(g~i)在850 hPa(左, AGL=500 m)、 700 hPa(中, AGL=2000 m)以及500 hPa(右, AGL=5000 m)的水汽通道特征表2 秦巴地区降水高值年6-8月各通道在不同高度层的轨迹数量占比图5 秦巴地区降水高值年6 -8月各水汽源区在850 hPa、 700 hPa及500 hPa高度层的水汽贡献率图6 降水低值年 6月(a~c)、 7月(d~f)、 8月(g~i)在850 hPa(左, AGL=500 m)、 700 hPa(中, AGL=2000 m)以及500 hPa(右, AGL=5000 m)的水汽通道特征表3 秦巴地区降水低值年6 -8月各通道在不同高度层的轨迹数量占比图7 秦巴地区降水低值年6 -8月各水汽源区在850 hPa、 700 hPa及500 hPa高度层的水汽贡献率图8 降水高值年6月(a~c)、 7月(d~f)、 8月(g~i)850 hPa(左, AGL=500 m)、 700 hPa(中, AGL=2000 m)以及500 hPa(右, AGL=5000 m)水汽通量与1970 -2020年同期水汽通量(彩色区, 单位: g·m-1·s-1·hPa-1)及风场(矢量, 单位: m·s-1)的合成分析图9 降水低值年6月(a~c)、 7月(d~f)、 8月(g~i)850 hPa(左, AGL=500 m)、 700 hPa(中, AGL=2000 m)以及500 hPa(右, AGL=5000 m)水汽通量与1970 -2020年同期水汽通量(彩色区, 单位: g·m-1·s-1·hPa-1)及风场(矢量, 单位: m·s-1)的合成分析
/
| 〈 |
|
〉 |
