 PDF(5994 KB)

去城市化作用前后华中区域气温对比分析
张玉翠, 赵琳, 谭江红, 闫彩霞, 秦鹏程
PDF(5994 KB)
去城市化作用前后华中区域气温对比分析
Comparative Analysis on Air Temperature before and after De-urbanization in Central China
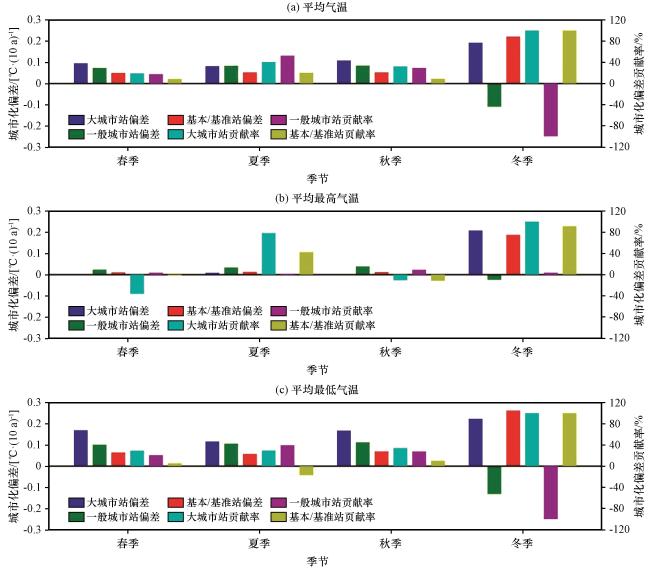
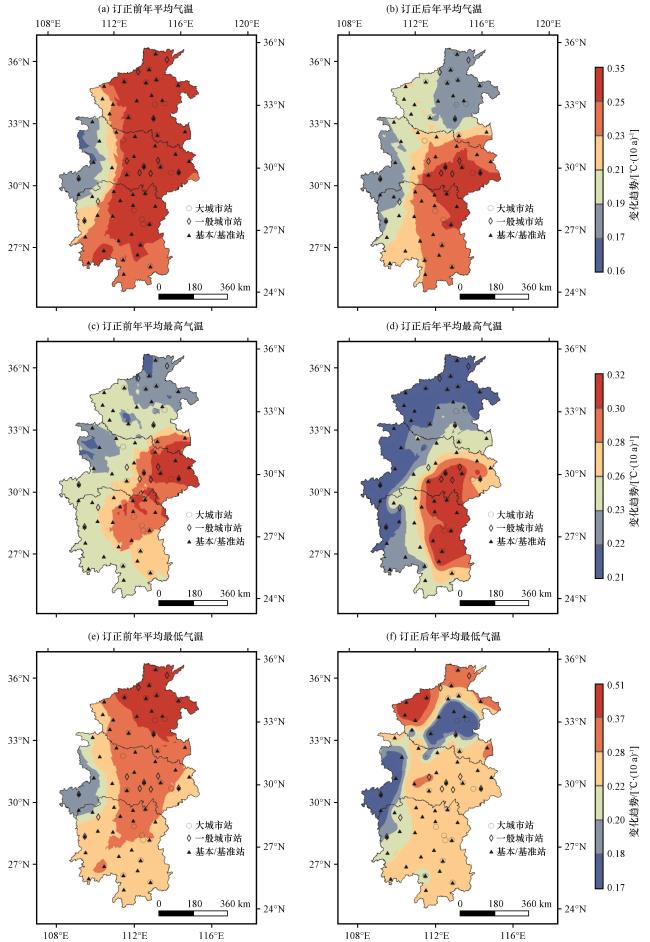
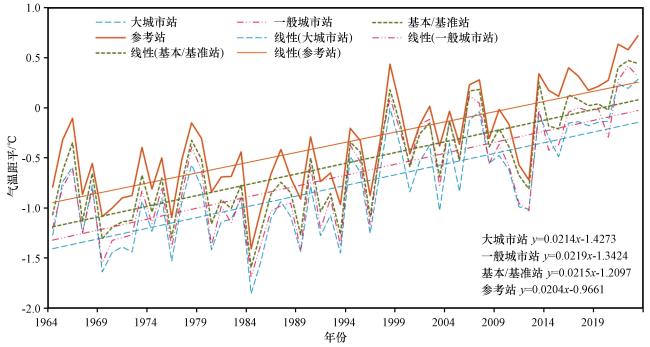
城市化水平不同, 其对地面气温序列的影响程度也不尽相同, 甚至差异较大。为明确华中区域不同程度的城市化对地面气温序列的影响, 基于1964 -2023年华中区域268个国家气象观测站的逐日气温资料, 选取了大城市站、 一般城市站、 国家基本/基准站, 并运用经验正交函数法(EOF)和邻站选取等方法选取了参考站; 构建了城市化偏差、 城市化偏差贡献率、 城市化偏差订正的计算公式; 分1964 -2023年和1979 -2023年两个时段, 对比分析了城市化对大城市站、 一般城市站、 国家基本/基准站年、 季平均气温、 平均最高和最低气温序列的影响, 并对上述台站年、 季气温序列中的城市化偏差进行了订正。结果表明: 两个时段城市化对城市站和基本/基准站年平均气温、 年平均最高和最低气温的影响均为增温, 且1979 -2023年上述台站三类气温城市化偏差较1964 -2023年均略有升高, 而大城市站和基本/基准站三类气温的城市化偏差贡献率却有所下降。就平均气温而言, 两个时段城市化对城市站和基本/基准站年平均最低气温的影响程度显著高于对年平均最高气温的影响程度; 就季节而言, 1964 -2023年, 城市化对冬季增温作用最明显, 而1979 -2023年冬季城市化增温速率显著减弱; 就不同等级台站而言, 1964 -2023年城市化对大城市站的影响最显著, 1979 -2023年一般城市站年平均气温的城市化偏差贡献率较大城市站高出5.6%, 两个时段国家基本/基准站年平均气温城市化偏差为0.040~0.041 ℃·(10a)-1。城市化偏差订正后, 1964 -2023年华中区域年平均气温、 年平均最高和最低气温的增温趋势分别减少了0.044 ℃·(10a)-1、 0.010 ℃·(10a)-1、 0.070 ℃·(10a)-1; 城市化程度最显著的河南省中东部增温趋势下降最明显, 因此在城市快速发展的同时应重点关注其对气候和环境带来的影响。
The effects on surface air temperature series are different or more by urbanization with different levels, in order to clarify this difference in Central China, based on the daily air temperature data of 268 national meteorological stations of Central China during 1964 -2023, the big city stations, general city stations and national basic/reference stations were selected, meanwhile the reference stations were selected by the methods of Empirical Orthogonal Function (EOF) and adjacent station selection.Then the calculation formulas of urbanization bias, contribution of urbanization bias and urbanization bias correction were constructed.The effects of urbanization on annual and seasonal average temperature, average maximum and minimum temperature series of big city, general city and national basic/reference stations were comparably analyzed in Central China in 1964 -2023 and 1979 -2023, and then the urbanization biases of the annual and seasonal temperature series in above stations were corrected.The results showed that: in the two periods, the annual average temperature, annual average maximum and minimum temperature in city and basic/reference stations increased by urbanization, and the urbanization biases of the three temperatures in above stations in 1979 -2023 were more than those in 1964 -2023, but the contributions of urbanization bias decreased in big city and basic/reference stations.As far as average temperature was concerned, the effect of urbanization on annual average minimum temperature was significantly higher than that in annual average maximum temperature in city and basic/reference stations in the two periods; As far as season was concerned, it was the most significant effect on winter warming by urbanization in 1964 -2023, while it decreased obviously in 1979 -2023; As far as different level stations were concerned, it was the most significant effect of urbanization on big city stations in 1964 -2023, while the contribution of urbanization bias of general city stations was 5.6% higher than that in big city stations in 1979 -2023, the urbanization biases of the annual average temperature in national basic/reference stations were 0.040~0.041 ℃·(10a)-1 in the two periods.After urbanization bias correction, the warming trends of annual average temperature, annual average maximum and minimum temperature reduced 0.044 ℃·(10a)-1, 0.010 ℃·(10a)-1, 0.070 ℃·(10a)-1 respectively in Central China in 1964 -2023; The areas with the most significant decrease of warming trend were the central east of Henan Province which were the areas with the most significant urbanization in Central China, as the rapid development of urban, the impacts on climate and environment should be put specially attention.
均一性检验 / 城市化偏差 / 城市化偏差订正 / 气温序列 / 华中区域 {{custom_keyword}} /
homogeneity adjustment / urbanization bias / urbanization bias correction / air temperature series / Central China {{custom_keyword}} /
表1 两个时段华中区域各级台站气温变化趋势Table 1 The trend of temperature variation of all level stations in Central China in the two periods |
| 时段 | 气温要素 | 大城市站/[℃·(10a)-1] | 一般城市站/[℃·(10a)-1] | 基本/基准站/[℃·(10a)-1] | 参考站/[℃·(10a)-1] |
|---|---|---|---|---|---|
| 1964 -2023年 | 年平均气温 | 0.304 | 0.282 | 0.255 | 0.204 |
| 年平均最高气温 | 0.245 | 0.265 | 0.247 | 0.229 | |
| 年平均最低气温 | 0.384 | 0.336 | 0.303 | 0.233 | |
| 1979 -2023年 | 年平均气温 | 0.398 | 0.363 | 0.345 | 0.293 |
| 年平均最高气温 | 0.375 | 0.377 | 0.364 | 0.339 | |
| 年平均最低气温 | 0.461 | 0.415 | 0.388 | 0.309 |
表2 两个时段华中区域各级台站四季气温变化趋势Table 2 The trend of temperature variation of all level stations in four seasons in Central China in the two periods |
| 季节 | 气温要素 | 1964 -2023年 | 1979 -2023年 | ||||||
|---|---|---|---|---|---|---|---|---|---|
| 大城市站 /[℃·(10a)-1] | 一般城市站 /[℃·(10a)-1] | 基本/基准站 /[℃·(10a)-1] | 参考站 /[℃·(10a)-1] | 大城市站 /[℃·(10a)-1] | 一般城市站 /[℃·(10a)-1] | 基本/基准站 /[℃·(10a)-1] | 参考站 /[℃·(10a)-1] | ||
| 春季 | 平均气温 | 0.424 | 0.422 | 0.374 | 0.286 | 0.617 | 0.608 | 0.566 | 0.484 |
| 平均最高气温 | 0.421 | 0.468 | 0.433 | 0.375 | 0.657 | 0.690 | 0.664 | 0.631 | |
| 平均最低气温 | 0.466 | 0.425 | 0.371 | 0.274 | 0.640 | 0.620 | 0.563 | 0.445 | |
| 夏季 | 平均气温 | 0.150 | 0.160 | 0.124 | 0.074 | 0.315 | 0.322 | 0.281 | 0.200 |
| 平均最高气温 | 0.080 | 0.131 | 0.092 | 0.087 | 0.312 | 0.358 | 0.324 | 0.261 | |
| 平均最低气温 | 0.258 | 0.240 | 0.204 | 0.143 | 0.364 | 0.350 | 0.299 | 0.217 | |
| 秋季 | 平均气温 | 0.296 | 0.279 | 0.245 | 0.194 | 0.368 | 0.340 | 0.316 | 0.269 |
| 平均最高气温 | 0.212 | 0.242 | 0.210 | 0.200 | 0.294 | 0.311 | 0.271 | 0.255 | |
| 平均最低气温 | 0.400 | 0.352 | 0.317 | 0.246 | 0.481 | 0.435 | 0.409 | 0.347 | |
| 冬季 | 平均气温 | 0.401 | 0.274 | 0.318 | 0.095 | 0.332 | 0.231 | 0.281 | 0.103 |
| 平均最高气温 | 0.403 | 0.295 | 0.305 | 0.084 | 0.353 | 0.259 | 0.271 | 0.098 | |
| 平均最低气温 | 0.440 | 0.300 | 0.337 | 0.086 | 0.370 | 0.278 | 0.313 | 0.108 | |
表3 两个时段华中区域城市站和基本/基准站气温的城市化偏差(U)和城市化偏差贡献率(C)Table 3 Urbanization bias (U) and its contribution (C) of temperature in city and basic/reference stations in Central China in the two periods |
| 时段 | 气温要素 | 大城市站 | 一般城市站 | 基本/基准站 | |||
|---|---|---|---|---|---|---|---|
| U/[℃·(10a)-1] | C/% | U/[℃·(10a)-1] | C/% | U/[℃·(10a)-1] | C/% | ||
| 1964 -2023年 | 年平均气温 | 0.090 | 24.3 | 0.063 | 21.9 | 0.040 | 6.5 |
| 年平均最高气温 | 0.001 | -18.4 | 0.020 | -0.4 | 0.006 | -8.7 | |
| 年平均最低气温 | 0.150 | 31.2 | 0.097 | 24.9 | 0.058 | 6.9 | |
| 1979 -2023年 | 年平均气温 | 0.092 | 13.8 | 0.076 | 19.4 | 0.041 | 1.0 |
| 年平均最高气温 | 0.021 | -18.5 | 0.054 | 4.4 | 0.012 | -9.3 | |
| 年平均最低气温 | 0.167 | 26.9 | 0.128 | 27.6 | 0.078 | 6.8 | |
表4 1964 -2023年华中区域城市化偏差订正前后四季气温变化趋势Table 4 The trend of temperature variation in four seasons before and after urbanization bias correction in Central China during 1964 -2023 |
| 季节 | 平均气温/[℃·(10a)-1] | 平均最高气温/[℃·(10a)-1] | 平均最低气温/[℃·(10a)-1] | |||
|---|---|---|---|---|---|---|
| 订正前 | 订正后 | 订正前 | 订正后 | 订正前 | 订正后 | |
| 春季 | 0.388 | 0.335 | 0.449 | 0.435 | 0.386 | 0.308 |
| 夏季 | 0.125 | 0.072 | 0.100 | 0.083 | 0.207 | 0.142 |
| 秋季 | 0.253 | 0.194 | 0.221 | 0.206 | 0.325 | 0.244 |
| 冬季 | 0.312 | 0.143 | 0.309 | 0.142 | 0.337 | 0.139 |
|
{{custom_citation.content}}
{{custom_citation.annotation}}
|
|
{{custom_citation.content}}
{{custom_citation.annotation}}
|
|
{{custom_citation.content}}
{{custom_citation.annotation}}
|
|
IPCC, 2021.Summary for policymakers.In: climate change 2021: the physical science basis.Contribution of working group I to the sixth assessment report of the intergovernmental panel on Climate Change[M].Cambridge and New York: Cambridge University Press, 1-41.
{{custom_citation.content}}
{{custom_citation.annotation}}
|
|
{{custom_citation.content}}
{{custom_citation.annotation}}
|
|
白虎志, 任国玉, 张爱英, 等, 2006.城市热岛效应对甘肃省温度序列的影响[J].高原气象, 25(1): 90-94.
{{custom_citation.content}}
{{custom_citation.annotation}}
|
|
鲍艳, 魏宇晨, 南素兰, 等, 2023.全球2 ℃温升背景下青藏高原植被对气候变化的响应[J].高原气象, 42(1): 49-59.DOI: 10.7522/j.issn.1000-0534.2022.00074.Bao Y ,
{{custom_citation.content}}
{{custom_citation.annotation}}
|
|
陈正洪, 王海军, 任国玉, 等, 2005.湖北省城市热岛强度变化对区域气温序列的影响[J].气候与环境研究, 10(4): 771-779.
{{custom_citation.content}}
{{custom_citation.annotation}}
|
|
初子莹, 任国玉, 2005.北京地区城市热岛强度变化对区域温度序列的影响[J].气象学报, 63(4): 534-540.
{{custom_citation.content}}
{{custom_citation.annotation}}
|
|
丁硕毅, 乔冠瑾, 郭媛媛, 等, 2015.珠三角城市群热岛及其气象影响因子研究[J].热带气象学报, 31(5): 681-690.DOI: 10.16032/j.issn.1004-4965.2015.05.011.Ding S Y ,
{{custom_citation.content}}
{{custom_citation.annotation}}
|
|
杜一博, 李双双, 冯典, 等, 2024.全球变暖背景下陕西省夏季极端降水及其大尺度环流特征[J].高原气象, 43(2): 342-352.DOI: 10.7522/j.issn.1000-0534.2023.00062.Du Y B ,
{{custom_citation.content}}
{{custom_citation.annotation}}
|
|
官雨洁, 刘寿东, 曹畅, 2018.不同城市化程度的城市气温变化研究-以福州和漳州为例[J].热带气象学报, 34(4): 554-560.DOI: 10.16032/j.issn.1004-4965.2018.04.013.Guan Y J ,
{{custom_citation.content}}
{{custom_citation.annotation}}
|
|
何萍, 赵锦玲, 2024.云南高原昆明市城市发展对雨季长短变化的反馈[J].高原气象, 43(3): 595-604.DOI: 10.7522/j.issn.1000-0534.2023.00088.He P ,
{{custom_citation.content}}
{{custom_citation.annotation}}
|
|
黄宏涛, 吴荣军, 王晓云, 等, 2016.城市化对珠三角地区气温及日较差的可能影响[J].气象, 42(7): 847-856.DOI: 10.7519/j.issn.1000-0526.2016.07.008.Huang H T ,
{{custom_citation.content}}
{{custom_citation.annotation}}
|
|
贾艳青, 张勃, 张耀宗, 等, 2017.城市化对长三角地区极端气温影响的时空分异研究[J].自然资源学报, 32(5): 814-828.DOI: 10.11849/zrzyxb.20160575.Jia Y Q ,
{{custom_citation.content}}
{{custom_citation.annotation}}
|
|
李宇, 周德成, 闫章美, 等, 2022.中国主要城市的城市化对局地增温的贡献[J].环境科学, 43(5): 2822-2830.DOI: 10.13227/j.hjkx.202109081.Li Y ,
{{custom_citation.content}}
{{custom_citation.annotation}}
|
|
梁萍, 丁一汇, 何金海, 等, 2011.上海地区城市化速度与降水空间分布变化的关系研究[J].热带气象学报, 27(4): 475-483.DOI: 10.3969/j.issn.1004-4965.2011.04.005.Liang P ,
{{custom_citation.content}}
{{custom_citation.annotation}}
|
|
纳丽, 许建秋, 任少云, 等, 2013.城市化对固原气温变化趋势的影响[J].干旱气象, 31(4): 738-743.DOI: 10.11755/j.issn.1006-7639(2013)-04-0738.Na L ,
{{custom_citation.content}}
{{custom_citation.annotation}}
|
|
任国玉, 张爱英, 初子莹, 等, 2010.我国地面气温参考站点遴选的依据、 原则和方法[J].气象科技, 38(1): 78-85.DOI: 10.19517/j.1671-6345.2010.01.016.Ren G Y ,
{{custom_citation.content}}
{{custom_citation.annotation}}
|
|
任玉玉, 任国玉, 张爱英, 2010.城市化对地面气温变化趋势影响研究综述[J].地理科学进展, 29(11): 1301-1310.
{{custom_citation.content}}
{{custom_citation.annotation}}
|
|
石涛, 杨元建, 蒋跃林, 等, 2011.城市热岛强度变化对安徽省气温序列的影响[J].气候与环境研究, 16(6): 779-788.
{{custom_citation.content}}
{{custom_citation.annotation}}
|
|
宋春城, 怀保娟, 张泽钰, 等, 2020.济南市气溶胶光学厚度变化与城市发展水平研究[J].绿色科技, (12): 239-241, 244.DOI: 10.16663/j.cnki.lskj.2020.12.089.Song C C ,
{{custom_citation.content}}
{{custom_citation.annotation}}
|
|
唐国利, 任国玉, 周江兴, 2008.西南地区城市热岛强度变化对地面气温序列影响[J].应用气象学报, 19(6): 722-730.
{{custom_citation.content}}
{{custom_citation.annotation}}
|
|
吴佳, 吴婕, 闫宇平, 2022.1961-2020年青藏高原地表风速变化及动力降尺度模拟评估[J].高原气象, 41(4): 963-976.DOI: 10.7522/j.issn.1000-0534.2022.00065.Wu J ,
{{custom_citation.content}}
{{custom_citation.annotation}}
|
|
徐园园, 任永健, 许存华, 等, 2017.城市化对咸宁地区气温变化的贡献分析[J].江西农业学报, 29(5): 101-106.DOI: 10.19386/j.cnki.jxnyxb.2017.05.20.Xu Y Y ,
{{custom_citation.content}}
{{custom_citation.annotation}}
|
|
晏红明, 王灵, 金燕, 等, 2023.云南冬季气温变化的主要模态及其影响的关键环流因子[J].高原气象, 42(2): 386-402.DOI: 10.7522/j.issn.1000-0534.2021.00070.Yan H M ,
{{custom_citation.content}}
{{custom_citation.annotation}}
|
|
杨元建, 荀尚培, 石涛, 等, 2011.基于遥感的合肥土地利用变化对气温序列影响分析[C]//杨军编著.2010年卫星遥感应用技术交流论文集.北京: 气象出版社, 185-194.
{{custom_citation.content}}
{{custom_citation.annotation}}
|
|
张爱英, 2009.国家基本基准站地面气温序列中城市化影响的检测与订正[D].北京: 中国气象科学研究院, 1-60.
{{custom_citation.content}}
{{custom_citation.annotation}}
|
|
张西雅, 扈海波, 2017.京津冀地区气溶胶时空分布及与城市化关系的研究[J].大气科学, 41(4): 797-810.DOI: 10.3878/j.issn.1006-9895.1611.16186.Zhang X Y ,
{{custom_citation.content}}
{{custom_citation.annotation}}
|
|
周雅清, 任国玉, 2005.华北地区地表气温观测中城镇化影响的检测和订正[J].气候与环境研究, 10(4): 743-753.
{{custom_citation.content}}
{{custom_citation.annotation}}
|
| {{custom_ref.label}} |
{{custom_citation.content}}
{{custom_citation.annotation}}
|
PDF(5994 KB)
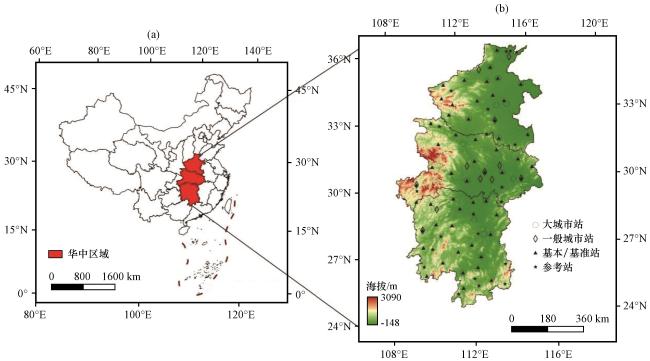
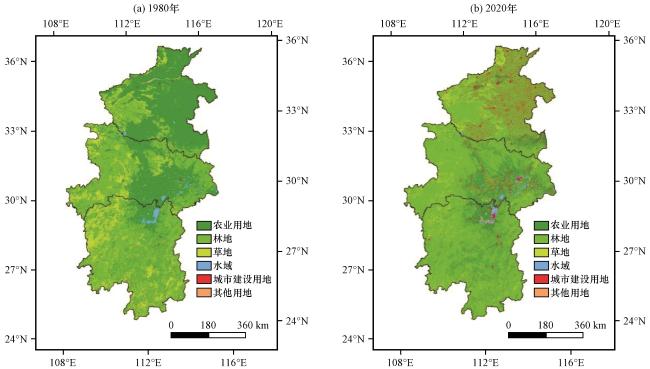
 图1 华中区域位置及气象台站分布图2 1980年(a)和2020年(b)华中区域土地利用类型的空间分布
 表1 两个时段华中区域各级台站气温变化趋势表2 两个时段华中区域各级台站四季气温变化趋势表3 两个时段华中区域城市站和基本/基准站气温的城市化偏差(U)和城市化偏差贡献率(C)图3 1964 -2023年华中区域城市站和基本/基准站四季气温的城市化偏差和城市化偏差贡献率图4 1964 -2023年华中区域城市化偏差订正前后气温变化趋势[单位: ℃·(10a)-1]表4 1964 -2023年华中区域城市化偏差订正前后四季气温变化趋势图5 1964 -2023年华中区域城市化偏差订正后各级台站年平均气温距平变化趋势
/
| 〈 |
|
〉 |
