
1 引言
自19世纪工业革命以来, 全球变暖已是毋庸置疑的事实(Stocker et al, 2013)。Alexander(2016)对全球极端气候事件长期变化的研究进行的综述表明: 尽管全球平均地表温度出现变暖间断, 但极端高温事件继续上升, 极端低温事件继续下降; 极端降水增加的区域在增多。Donat et al(2016)的分析表明, 在过去一个世纪中, 全球和大多数陆地地区的极端温度趋势是一致的; 在20世纪的大部分时间里, 全球倾向于更强的降雨。最近, Papalexiou et al(2019)对1964 -2013年极端降水事件特征进行了全球分析, 发现在欧亚大陆、 澳大利亚北部和美国中西部的大部分地区极端降水出现越来越多的趋势。Zhang and Zhou(2019)对全球陆地季风区的极端降水进行了分析, 发现在1901 -2010年, 南非季风区南部、 南亚季风区、 北美季风区和南美洲季风区东部的年最大日降水量随全球变暖显著增加。Cui et al (2019)和Wang et al (2020)分析和预估了东亚极端降水的变化, 发现华南、 东南亚、 华北地区极端降水频次和数量增加而在长江流域则有减少的趋势。近年, 关于全球极端事件变化研究的文献很多, 这些研究表明, 随着全球变暖, 很多国家和地区的极端降水事件都呈现出增多的趋势。
全球变暖背景下, 我国平均暴雨和极端强降水事件频率和强度有所增长, 特别是长江中下游和东南地区、 西部特别是西北地区有较明显增长(任国玉等, 2010; 李娟等, 2020)。我国的西北和长江以南地区极端降水事件频数与气温呈正相关关系, 而东北-西南走向一带为负相关关系, 夏季气温和极端降水事件均在1992年左右发生突变(陈金明等, 2016)。中国极端降水趋势有三个显著区域: 东南地区和西北地区为正趋势区, 华北地区为负趋势区; 极端降水存在三个频发时期: 1960年代早期, 1990年代中晚期和21世纪早期(Sun and Zhang, 2017)。我国西北干旱区的极端降水和湿日呈现出增加的趋势, 连续干日的持续期在缩短(Wang et al, 2017)。黄河上游地区极端降水的发生频率在降低(马佳宁和高艳红, 2019)。黄土高原地区平均日降雨强度表现出明显的区域下降, 而连续干日表现出显著的增加, 最大连续5天降水、 非常湿和极端湿日降水、 连续湿日没有显著趋势(Sun et al, 2016)。我国西南地区在过去60年中普遍变得较干燥, 但极端降水增强, 极端降水的空间变异性呈现出不均匀的变化趋势, 但空间变异性降低(Liu et al, 2014, 2015a)。我国南方地区各极端降水指数的变化趋势存在空间差异, 最大5日降水量、 湿日降水均值和非常湿日降水量呈增加趋势的格点所占比例分别为60.85%, 75.32%和75.74%; 各极端降水指数与总降水量之间均存在较好的相关性(任正果等, 2014)。我国东北松花江流域的降水量、 非常湿日降水和极端湿日降水过去54年中均呈上升趋势, 而湿日降水均值在同一时期表现出明显的下降(Song et al, 2015)。Wang et al(2017)分析了我国东北地区的12个极端降水指数, 发现连续干日在明显下降, 而其他极端降水虽然也在下降, 但趋势不显著。Liu et al (2015b)的研究则表明中国东部地区小雨明显减少, 强降水增加, 而总降水变化不大。杨志刚等(2014)发现西藏西部、 北部和东南部极端降水事件出现频数呈减少趋势, 而沿雅鲁藏布江一线、 西藏南部和东北部极端降水事件出现频数呈增多趋势。卢珊等(2020)分析了1961 -2016年中国极端降水特征, 也发现全国极端降水事件明显增多, 极端降水量和极端降水日数的增加主要集中在东南沿海和西部地区, 全国平均的连续性极端降水事件表现为不显著的增加趋势, 极端降水事件的开始时间和结束时间分别呈现出明显的提前和推迟趋势。分季节来看, Huang and Wen(2013)研究认为华东地区的小雨事件在夏季和冬季半年呈下降趋势, 而在西北地区冬季半年呈增长趋势, 但夏季半年没有趋势。龙妍妍等(2016)的分析表明中国夏季极端降水事件空间分布存在明显的区域性差异, 长江中下游地区、 华南地区、 西北地区表现为增加趋势, 东北地区、 华北地区、 西南部分地区表现为减少趋势。而曾颖婷和陆尔(2016)的分析结果表明夏季总降水量和极端降水量在我国东南和西南部呈上升趋势, 在东北和西北部呈下降趋势。
综上所述, 极端降水的变化随季节和地区存在着差异, 不同类型的极端降水其变化特征也存在异同, 有些结论彼此间还存在模糊和矛盾, 我国极端降水变化的研究还有待进一步深入完善。
中国华南地区特别是粤港澳大湾区是我国经济最发达的地区之一, 极端气候的现状和趋向对该地区防灾减灾与可持续发展政策的制定具有非常重要的意义。陆虹等(2012)发现一致性异常特征是华南极端强降水频次分布的最主要空间模态, 而东、 西反向和南、 北反向变化模态也是比较重要的异常模态; 华南地区20世纪60 年代和80年代极端强降水频次较少, 从80年代中后期起, 极端强降水频次有由少变多的趋势。Zhao et al(2014)利用42个气象站1960 -2012年的观测资料分析了珠江流域的极端降水特征, 发现湿日降水、 最大连续湿日和强降水日数呈下降趋势, 而最大持续干日和湿日降水均值显著上升。Li et al(2016)的分析则表明自1992/1993年以来, 我国华南地区夏季的极端降水经历了明显的年代间增加, 极端降水的频率和强度的变化在夏季总降水变化中起着重要的作用。李丽平等(2010, 2012)分前汛期和后汛期分析了华南极端降水的特征, 发现20世纪90年代以来华南前汛期总降水量的显著增加与强降水量、 强降水频率以及暴雨日数显著增加密切相关, 且极端强降水量异常程度明显增强; 华南后汛期极端降水在1992 -1993年发生一次明显的年代际转折, 1993年以来华南发生极端旱涝的情况增多。蔡悦幸等(2018)在此基础上又对华南地区前后汛期极端降水事件进行了对比分析, 发现华南地区前、 后汛期极端降水都呈上升趋势, 但是变化周期不同; 华南地区前汛期在广西东北部和广东中部极端降水指数较大, 后汛期在华南沿海地区极端降水指数较大。
目前, 学者对华南沿海极端气温事件和台风的变化比较关注, 而对我国华南沿海极端降水事件的变化分析还不充分, 本文将对华南地区各季与年主要极端降水类型的变化进行比较分析, 以全面认识该区域在全球变暖背景下极端降水的特征, 为相关部门应对气候变化提供科学依据。
2 数据来源和方法介绍
选用中国气象局再分析数据CN05.1逐日气温(TM)和降水(PRE)资料, 长度为1961 -2018年, 空间分辨率为0.25°×0.25°。CN05.1资料是基于2400余个中国地面气象台站的观测资料, 通过常用的“距平逼近”插值方法, 首先将计算得到的气候平均场使用薄板样条方法进行插值, 随后使用“角距权重法”对距平场进行插值, 然后将两者叠加, 得到最终的数据集(吴佳和高学杰, 2013)。该资料已被广泛应用于气候变化的分析研究中。
本文所选的华南范围为中国传统意义下的华南地区(18°N -28°N, 105°E -122°E)。包括广东、 广西、 福建、 海南全境和相邻周边省域部分地区。
截至目前, 关于极端降水事件的定义很多, 大多数文献采用气候变化检测和指数专家组(ETCCDI)发展的极端气候指数(Zhang et al, 2011), 本文也严按照ETCCDI的定义挑选了其中的9种极端降水指数进行分析研究。它们是: (1)R99P (Extremely wet days, 极端湿日降水量): 降水量大于99%排序值的日数的总降水量(单位: mm)。(2)R95P (Very wet days, 非常湿日降水量): 降水量大于95%排序值的日数的总降水量(单位: mm)。(3)RX1day (Maximum 1-day precipitation amount, 最大日降水量): 日降水量最大值(单位: mm)。(4)RX5day (Maximum 5-day precipitation amount, 最大5日降水量): 持续 5日降水量最大值(单位: mm)。(5)R10day (Number of heavy precipitation days, 强降水日数): 日降水量大于等于10 mm的日数(单位: d)。(6)R20day (Number of very heavy precipitation days, 特强降水日数): 日降水量大于等于20 mm的日数(单位: d)。(7)SDII (Simple daily intensity index, 湿日降水均值): 日降水量大于1mm日数的降水均值(单位: mm)。(8)CWDday (Consecutive wet days, 最大连续湿日): 日降水量大于等于1 mm的持续日数的最大值(单位: d)。(9)CDDday (Consecutive dry days, 最大连续干日): 日降水量小于1 mm的持续日数的最大值(单位: d)。
首先严格按照定义计算了研究区域1961 -2018年年和各季的气温、 降水和9种极端降水量, 然后分析它们线性趋势的时空分布, 并对趋势进行显著性T检验。冬季指上年12月至当年2月, 春季指当年3 -5月, 夏季指当年6 -8月, 秋季指当年9 -11月; 因为缺少上年12月的值, 对于平均变量, 1961年的冬季值是1961年1 -2月的均值; 对于累计变量, 1961年的冬季值是由1961年1 -2月的均值乘以3计算得到。然后对9种极端降水进行归类, 挑出4种代表性指数进一步进行经验正交函数分解(主分量分析), 以充分了解该区域极端降水的变化特征。
文中涉及的地图是基于国家测绘地理信息局标准地图服务网站下载的审图号为GS(2016)2923的中国地图制作, 底图无修改。
3 全球变暖下华南的气候响应
首先来了解华南地区气温(TM)和降水(PRE)近几十年对全球变暖的响应, 由1961 -2018年华南年和各季平均气温趋势的空间分布和区域平均气温的变化曲线(图1)可知, 华南地区年和各季气温明显升高, 冬季升温最明显, 幅度大, 显著范围广, 夏季升温相对弱, 湖南中部甚至存在一小块降温区域; 沿海升温相对显著, 大城市地区的升温相对显著。通过计算区域平均气温的气候倾向率(见表1中TM)发现, 在1961 -2018年, 华南年平均气温的升温率为0.018 ℃·a-1, 冬季、 春季、 夏季和秋季的升温率分别为0.023 ℃·a-1, 0.017 ℃·a-1, 0.011 ℃·a-1和0.020 ℃·a-1, 置信度都达到了α=0.05水平的显著性检验, 冬季的升温率超过夏季的2倍。
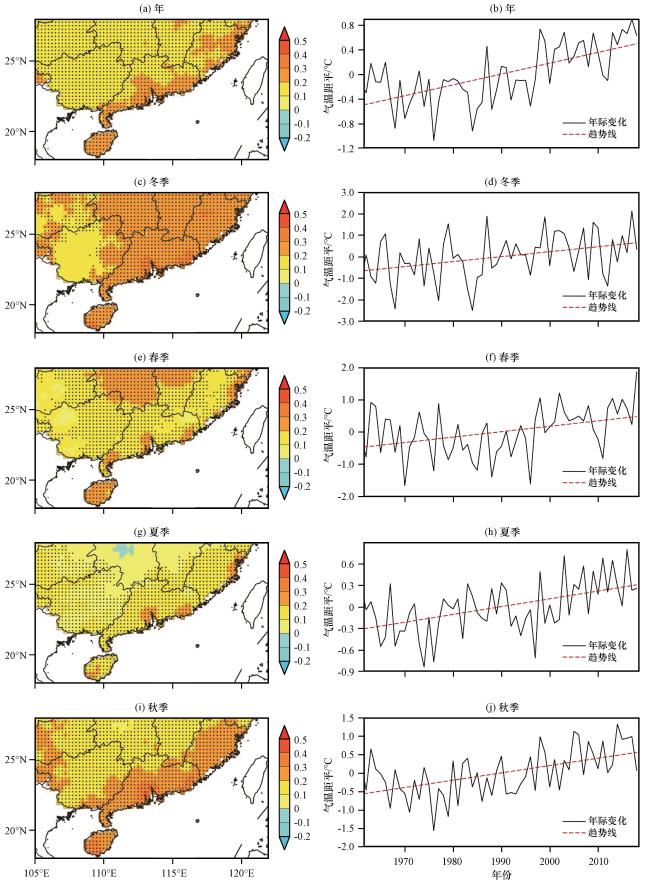
图1 1961 -2018年华南年和各季平均气温趋势的空间分布[左, 单位: ℃·(10a)-1]和区域平均气温距平的变化曲线(右)左图中加点区域置信度达到了α=0.05水平的显著性检验 |
表1 1961 -2018年华南区域平均的年和各季极端降水的气候倾向率Table 1 |
| 名称 | TM /(℃·a-1) | PRE /(mm·a-1) | R99P /(mm·a-1) | R95P /(mm·a-1) | RX1day /(mm·a-1) | RX5day /(mm·a-1) | R10day /(d·a-1) | R20day /(d·a-1) | SDII /(mm·a-1) | CWDday /(d·a-1) | CDDday /(d·a-1) |
|---|---|---|---|---|---|---|---|---|---|---|---|
| 年 | 0.018* | 2.610 | 0.915* | 1.870* | 0.156* | 0.238 | 0.051* | 0.042* | 0.006 | 0.047* | -0.041* |
| 冬季 | 0.023* | 0.597 | 0.236 | 0.460 | 0.172* | 0.357* | 0.017 | 0.014 | 0.014* | 0.022 | -0.060* |
| 春季 | 0.017* | 0.161 | 0.042 | 0.232 | 0.046 | -0.042 | -0.010 | 0.002 | -0.002 | 0.025* | -0.009 |
| 夏季 | 0.011* | 1.509* | 0.457* | 0.768* | 0.134 | 0.294 | 0.041* | 0.019* | 0.013* | 0.017 | -0.025 |
| 秋季 | 0.020* | 0.348 | 0.180 | 0.409 | 0.106 | 0.141 | 0.002 | 0.008 | 0.005 | 0.004 | -0.011 |
*表示趋势置信度达到了α=0.10水平 |
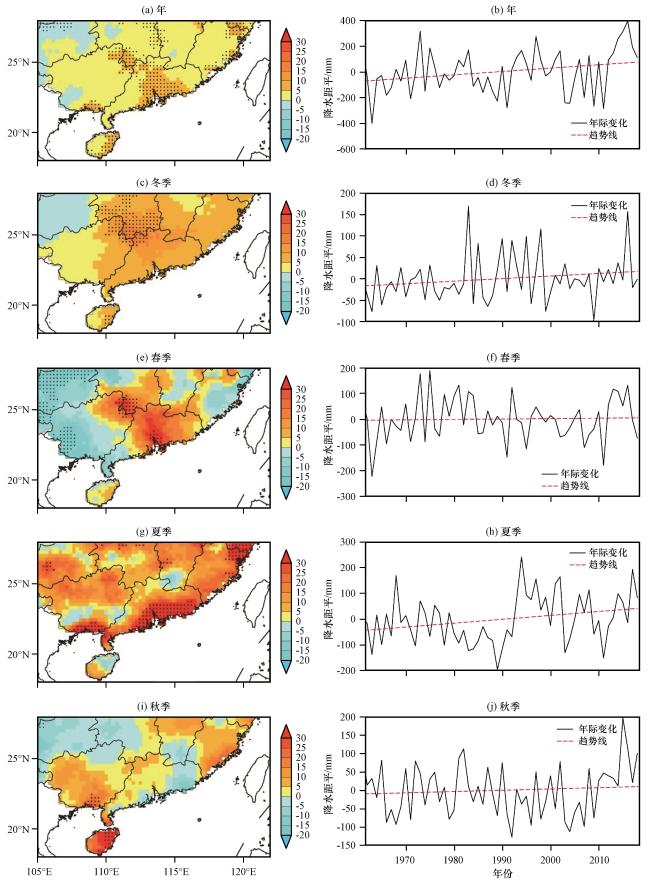
从1961 -2018年华南年和各季降水趋势的空间分布和区域平均降水的变化曲线(图2)可以看出, 年、 冬季和夏季降水以大范围增加为主, 年和夏季降水增加显著区域主要是粤港澳湾区, 春季降水增加显著区域在湖南南部和广西东北部; 春季降水的增加区域在广东、 湖南南部和广西东北部, 其余地区降水在反而在减少; 秋季降水在海南、 广西、 粤东西部、 以及福建地区增加, 在粤东到赣南区域、 湘西、 桂东北和贵州减少。通过计算区域平均降水的气候倾向率(见表1中PRE)发现, 在1961 -2018年, 华南年平均降水的气候倾向率为2.610 mm·a-1, 冬季、 春季、 夏季和秋季平均降水的气候倾向率分别为0.597, 0.161, 1.509 和0.348 mm·a-1, 虽然都呈增加趋势, 但只有夏季平均降水趋势的置信度达到了α=0.10水平的显著性检验, 降水的增加较显著, 其他季节为不显著增加。
4 华南各类极端降水及其趋势变化的空间分布
通过分析华南地区9种极端降水指数年和各季的分布和变化特征, 发现它们的变化可归为4类: R99P、 R95P、 RX1day和RX5day的年和各季值的空间分布及其变化趋势的空间分布基本一致, 总体变化特征也基本一致; R10day、 R20day和SDII的年和各季值的空间分布及其变化趋势的空间分布基本一致, 总体变化特征也基本一致; CWDday和CDDday的年和各季的空间分布、 变化趋势的空间分布与上述两类不同, 而且各有差异。下面以R95P、 R20day、 CWDday和CDDday代表, 比较这些极端降水的变化特征。
图3为1961 -2018年华南年和各季R95P及其变化趋势的空间分布, R99P、 RX1day和RX5day的分布形势与R95P基本相似(图略), 从图3 R95P的空间分布(左列)可以看出, 这类极端降水的年值以粤港澳大湾区、 粤西到广西沿海、 海南和广西东北地区较大; 冬季的极端降水相对较少, 分布呈中部和东部偏多, 西部偏少的态势, 中部和北部区域最高, 沿海西部和西南区域次之, 西部最少; 春季的高值区在广东、 湖南和江西南部、 福建西部以及广西东部区域; 夏季和秋季的分布基本相同, 高值区在华南沿海区域、 海南和广西北部地区。从图3中R95P变化趋势的空间分布(右列)可以看出, 在1961 -2018年, 这类极端降水的年值在华南地区除个别零星区域外都呈增加趋势, 福建、 广西、 江西南部和湖南东南显著增多, 粤港澳大湾区虽然也增多, 但不显著; 冬季的极端降水除华南北部边界个别零星区域外, 都呈增加趋势, 显著增加区域主要在海南、 广西西北部, 以及福建的东北角; 春季极端降水增加的区域占多数, 但几乎没有显著增加区域, 仅广西和湖南的南交界区域有一小块显著增加地区, 在湖南西部反而显著减少; 夏季极端降水增加的区域比春季扩大, 但系统性比较差, 显著增加区域也零星分布在珠江口, 福建东北沿海和湖南西北部; 秋季极端降水也是大部区域呈增加态势, 与夏季相比, 显著增多区域相对集中在广西东部和南部、 以及江西北部地区, 海南呈现增加趋势, 但广东沿海是减少的。
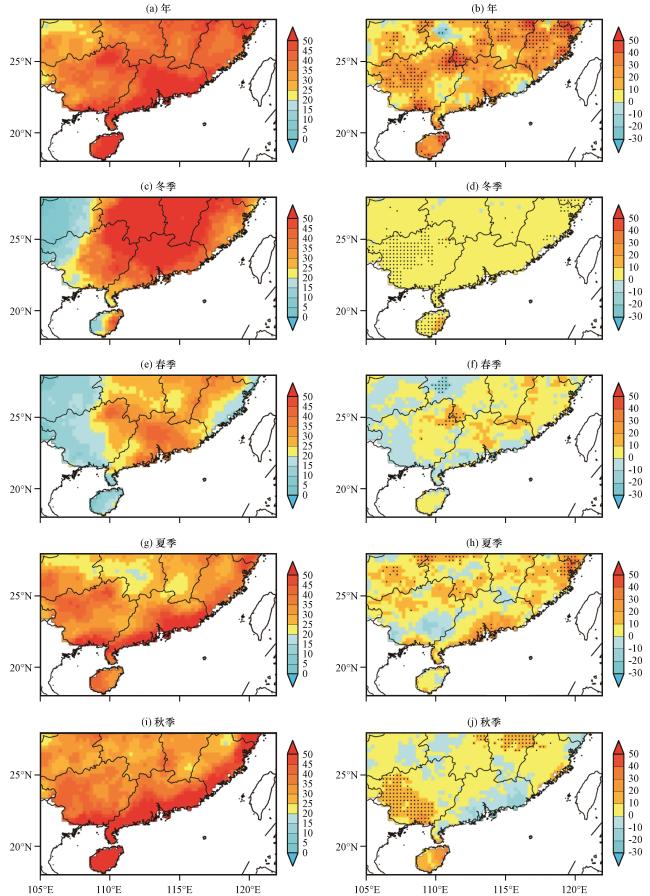
图4为1961 -2018年华南年和各季R20day及其变化趋势的空间分布, R10day和SDII的分布形势与R20day基本相似(图略), 从R20day的空间分布(图4左列)可以看出, 这类极端降水的年值以粤港澳大湾区为最大, 次大值在海南、 闽赣相接处和广西东北地区; 冬季的极端降水相对较少, 分布特征明显, 东北区域高, 西部和西南区域低; 春季极端降水明显增多, 高低值分布与冬季类似, 但高值区域向西南有所延申; 夏季的极端降水最多, 分布特征较冬春有明显变化, 大值区移向西部和南部区域, 特别是粤港澳大湾区; 秋季的极端降水比夏季弱, 但比冬春强, 海南和粤西的值最高。从R20day变化趋势的空间分布(图4右列)可以看出, 在1961 -2018年, 这类极端降水的年值在华南大多数区域都呈增加趋势, 特别是粤港澳大湾区、 海南、 广西沿海区域、 福建东北沿海地区、 以及广西东北地区显著增多; 冬季的极端降水除华南北部边界少数区域外都是增加的, 尤以海南和广西中北部地区增加明显; 与冬季相比, 春季极端降水增加区域明显回缩减少, 主要增加区域是粤港澳大湾区, 但不显著; 夏季极端降水增加区域又占据大部分地区, 呈现中部减少, 南北增多, 粤港澳大湾区和广西沿海是显著增多区域; 秋季极端降水则呈现华南东北部和西南部增多的态势, 但显著区域零星分布, 粤港澳大湾区反而减少。
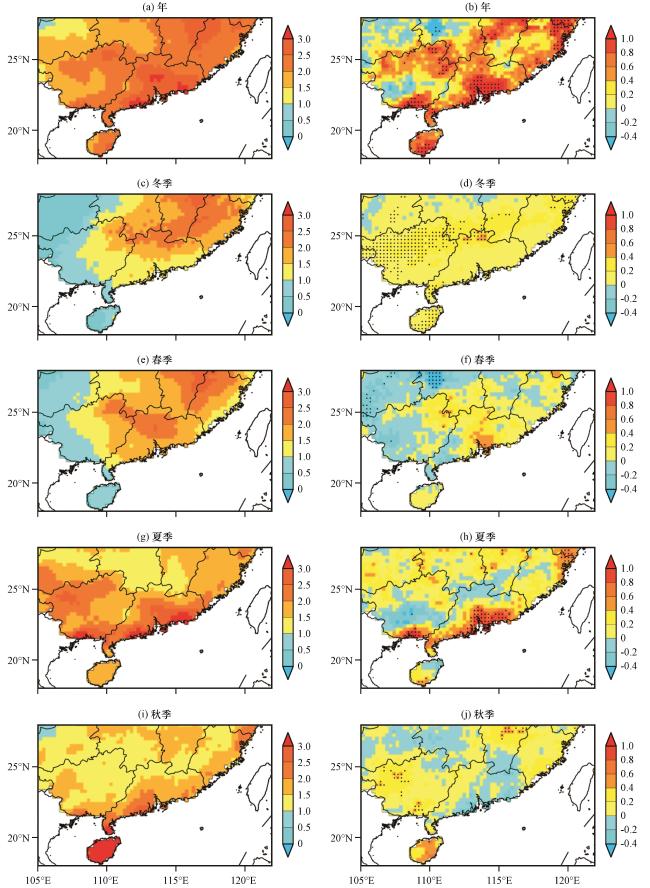
图5为1961 -2018年华南年和各季CWDday及其变化趋势的空间分布。从CWDday的空间分布(图5左列)可以看出, CWDday年值的空间分布以粤港澳大湾区、 粤西到广西沿海、 海南、 福建和广西东北地区较大, 与R95P的年值分布基本一致, 但增加福建为较大值区; 冬季的极端降水大值区范围比R95P小, 高值区主要在华南的中部和北部地区; 春季高值区明显南移和西伸, 呈现中东部高、 西部低的形势; 夏季的值明显偏大, 高低范围与年值分布基本一致, 年值的分布主要由夏季的分布决定; 秋季的高值区主要在华南沿海区域, 海南最大。从CWDday变化趋势的空间分布(图5右列)可以看出, 在1961 -2018年, CWDday年值的增加有三块显著区域, 一是湖南及湖南与广西、 江西的交界区和广东中北部地区, 二是广西西部至海南东部一线地区, 三是福建北部边界区域; 冬季CWDday显著增加的区域只在年值显著增加的第一块区域, 范围偏小; 春季CWDday显著增加区域在冬季的基础上向周边扩大, 向南扩大到粤港澳大湾区, 此外, 福建北部边界区也显著增多, 但在福建中南部地区和华南西部显著减少; 夏季CWDday的显著增加区域则主要在华南西部广西及以北地区, 福建北部边界区也显著增多, 粤港澳大湾区和粤东闽南沿海地区虽然也增多, 但不显著; 秋季CWDday的显著增加区域在华南沿海和海南地区, 在福建北部和江西东部则显著减少。
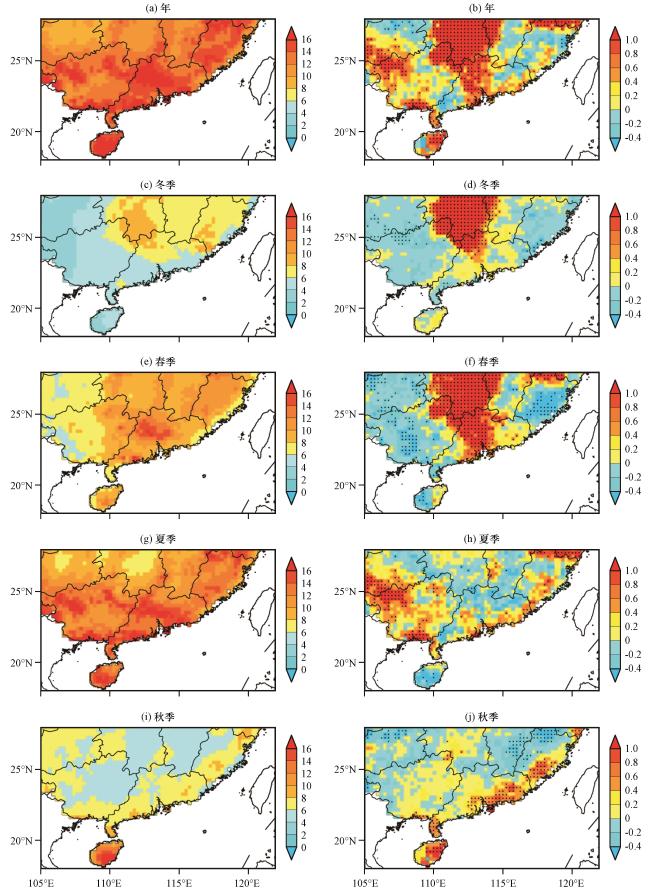
图6为1961 -2018年华南年和各季CDDday及其变化趋势的空间分布。从CDDday的空间分布(图6左列)可以看出, CDDday年值在广东沿海和海南西部最大, 从华南南部到北部逐渐减少; 冬季CDDday的分布形势与年值分布基本一致, 年值的分布主要由冬季的分布决定; 春季CDDday高值区在西部和南部地区, 华南中部和北部为低值区; 夏季CDDday高值区在华南中部和北部、 福建近海地区, 低值区在西部和南部地区, 除福建近海区域外分布与春季基本相反; 秋季的高低值区分布近似冬季, 与冬季相比, 高值范围有所回缩和偏小。从图6中CDDday变化趋势的空间分布(图6右列)可以看出, 在1961 -2018年, CDDday年值的增加范围很小, 在华南西部贵州和广西西北部、 以及海南西北区域, 有零星显著区, 华南大部区域为减少趋势, 其中湖南中东部、 江西西部到粤港澳地区都显著减少; 冬季CDDday也是大范围呈减少趋势, 其中湖南、 广西东北部和广东北部地区显著减少, 增加的区域与年值一致, 但不显著; 与冬季相比, 春季CDDday呈减少的区域有所缩小, 但依然占据华南大部区域, 显著减少区主要分布在粤东、 湘南和赣南, 贵州和广西东北部则显著增加; 夏季CDDday除海南和一些零星地区外, 呈现大范围的减少趋势, 显著减少的区域也比春季扩大, 主要在粤东、 福建近海、 以及华南中北部的一些零星区域; 秋季CDDday呈减少的区域为多, 粤港澳地区、 粤西和海南、 江西和广西沿海都呈减少趋势, 但基本都不显著, 显著增加的区域在贵州西部。
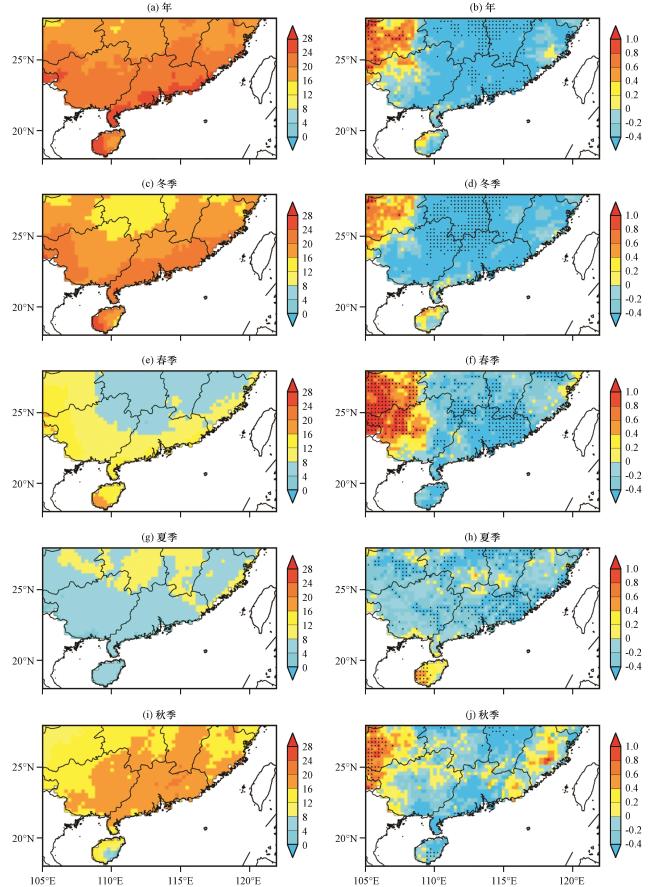
综上所述, 本研究所分析的华南地区9种极端降水的变化可归为4类: (1)R99P、 RX1day和RX5day的年和各季值的空间分布及其变化趋势的空间分布与R95P基本一致, 这类极端降水的年值在华南地区基本都呈增加趋势, 福建、 广西、 江西南部和湖南东南显著增多, 冬季的极端降水也基本都呈增加趋势, 显著增加区域主要在海南、 广西西北部, 以及福建的东北角, 春季、 夏季和秋季的极端降水在大多数区域呈增加趋势, 春季极端降水增加的区域占多数, 但几乎没有显著增加区域, 夏季极端降水显著增加区域零星分布在珠江口, 福建东北沿海和湖南西北部, 秋季极端降水显著增多区域相对集中在广西东部和南部、 以及江西北部地区。(2) R10day和SDII的年和各季值的空间分布及其变化趋势的空间分布与R20day基本一致, 这类极端降水的年值在华南大多数区域都呈增加趋势, 特别是粤港澳大湾区、 海南、 广西沿海区域、 福建东北沿海地区、 以及广西东北地区显著增多, 冬季的极端降水除华南北部边界少数区域外都是增加的, 尤以海南和广西中北部地区增加明显, 春季极端降水增加区域重要是粤港澳大湾区, 但不显著, 夏季极端降水增加区域占据大部分地区, 粤港澳大湾区和广西沿海是显著增多区域, 秋季极端降水则呈现华南东北部和西南部增多的态势, 粤港澳大湾区反而减少。(3) CWDday年值的增加有三块显著区域, 一是湖南及湖南与广西、 江西的交界区和广东中北部地区, 二是广西西部至海南东部一线地区, 三是福建北部边界区域, 冬季显著增加的区域只在年值显著增加的第一块区域, 春季显著增加区域在冬季的基础上向周边扩大, 向南扩大到粤港澳大湾区, 夏季显著增加区域则主要在华南西部广西及以北地区和福建北部边界区, 秋季CWDday显著增加区域在华南沿海和海南地区。(4)CDDday年值在华南大部区域为减少趋势, 其中湖南中东部、 江西西部到粤港澳地区都显著减少, 冬季CDDday也是大范围呈减少趋势, 其中湖南、 广西东北部和广东北部地区显著减少, 春季呈减少的区域有所缩小, 但依然占据华南大部区域, 夏季呈现大范围的减少趋势, 秋季CDDday呈减少的区域为多, 粤港澳地区、 粤西和海南、 江西和广西沿海都呈减少趋势, 但基本都不显著。
5 华南典型极端降水的总体变化特征分析
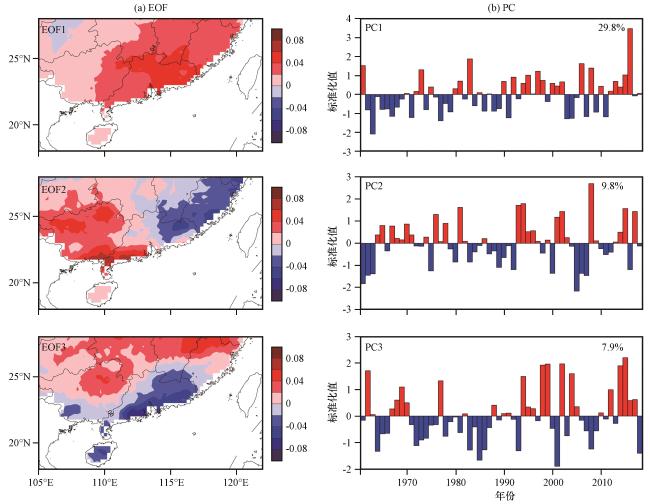
上面分析中将华南地区9种极端降水指数, 根据分布和变化特征归为4类, 本节针对这4类极端降水R95P、 R20day、 CWDday和CDDday, 进行了年和各季的时空特征的EOF分析。时间维长度为1961 -2018年, 共58年。 空间范围为中国传统意义下的华南地区(18°N -28°N, 105°E -122°E)。包括广东、 广西、 福建、 海南全境和相邻周边省域部分地区。分析结果表明, 这些极端降水在华南地区分析所得的第1特征向量场的符号基本相同, 只是一些变量在个别很小区域存在异号低值, 总的来说第1特征向量场代表了全区一致的变化特征。第2特征向量场和第3特征向量场表现为南北或东西的反相变化, 极端降水各变量南北或东西的边界大致相同。这里只给出R95P年值的前3个EOF特征向量场分布[图7(a)], 以此为代表, 描述其具体特征。从图7可以看出, 第1特征向量场(EOF1)除贵州北有一小块弱负值区外, 华南区域均为正, 正值中心在广东中部和东部地区, 表示全区一致的变化; 第1特征向量场(EOF2)东部和西部反号, 呈现东西反相的变化, 东西大致以114°E为界, 东部负高值区主要在粤东地区和福建省, 西部正高值区主要在粤西沿海和广西。第3特征向量场(EOF3)南部和北部反号, 呈现南北反相的变化, 南北大致以23°N(华南西部) -25°N(华南东部)为界, 反映沿海地区和北部山区的反相变化。图7(b)显示的是R95P年值的前3个主分量的年际变化, 第一主分量(PC1)呈增大趋势, 它所对应的特征向量场EOF1反映华南全区基本一致的变化, 特征向量场基本为正, 这表明在1961 -2018年, 华南地区R95P总体成增长的趋势; 第二主分量(PC2)的变化没有明显的趋势, 它反映的是东西反相的变化, 因为所对应的特征向量场EOF2呈现西正东负的分布, PC2的值为正(负)时, 华南西部R95P偏多(少)而东部偏少(多); 第三主分量(PC3)的变化没有明显的趋势, 它反映的是南北反相的变化, 因为所对应的特征向量场EOF3呈现北正南负的分布, PC3的值为正(负)时, 华南北部R95P偏多(少)而南部偏少(多)。
R95P各季节与R20day、 CWDday和CDDday年及季节的EOF第1特征向量场(图略)均表现为全区符号基本相同, 也就是基本一致的变化特征, 第2特征向量场(图略)或表现为东西反相、 或表现为南北反相变化, 而第3特征向量场(图略)或表现为南北反相、 或表现为东西反相变化。表2统计了华南年和各季极端降水前3个EOF向量场方差占比和主要特征。从表2中可以看出, R95P、 R20day和CWDday第1特征向量的方差占总方差的比例冬季最大, 分别为59.1%, 56.1%和54.5%, 春季次之, 夏季或秋季最小, 表明R95P、 R20day和CWDday冬季的一致变化最强, 其主分量所占方差比例最大; 而CDDday第1特征向量的方差占总方差的比例秋季最大(52.3%)、 冬季次之(47.8)。从表2还可以发现, R95P、 R20day、 CWDday和CDDday年值的第2特征向量场都表现为东西反相变化, 第3特征向量场都表现为南北反相变化, 说明, 从年尺度来看, 这些极端降水的变化除了一致变化为主外, 第2重要的特征是东西反相变化; R95P和R20day冬季、 春季和夏季的第2特征向量场都表现为南北反相变化, 只有秋季的第2特征向量场都表现为东西反相变化, 与年值的一致; CWDday和CDDday冬季和春季的第2特征向量场都表现为南北反相变化, 而夏季和秋季的第2特征向量场都表现为东西反相变化, 与年值的一致, 这或许说明各季极端降水变化对年值贡献的重要程度。
表2 华南年和各季极端降水前3个EOF向量场方差占比和主要特征Table 2 |
| 时间 | R95P | R20day | |||||||||||||||
|---|---|---|---|---|---|---|---|---|---|---|---|---|---|---|---|---|---|
| EOF1 | EOF2 | EOF3 | EOF1 | EOF2 | EOF3 | ||||||||||||
| 方差占比/% | 主要特征 | 方差占比/% | 主要特征 | 方差占比/% | 主要特征 | 方差占比/% | 主要特征 | 方差占比/% | 主要特征 | 方差占比/% | 主要特征 | ||||||
| 年 | 29.8 | 一致变化 | 9.8 | 东西反相 | 7.9 | 南北反相 | 38.5 | 一致变化 | 10.8 | 东西反相 | 7.9 | 南北反相 | |||||
| 冬季 | 59.1 | 一致变化 | 11.1 | 南北反相 | 5.8 | 东西反相 | 56.1 | 一致变化 | 9.2 | 南北反相 | 7.0 | 东西反相 | |||||
| 春季 | 28.5 | 一致变化 | 9.7 | 南北反相 | 6.6 | 东西反相 | 42.7 | 一致变化 | 9.4 | 南北反相 | 7.2 | 东西反相 | |||||
| 夏季 | 20.6 | 一致变化 | 12.0 | 南北反相 | 10.1 | 东西反相 | 29.6 | 一致变化 | 15.0 | 南北反相 | 9.2 | 东西反相 | |||||
| 秋季 | 21.8 | 一致变化 | 17.6 | 东西反相 | 9.9 | 南北反相 | 30.2 | 一致变化 | 13.9 | 东西反相 | 9.7 | 南北反相 | |||||
| 时间 | CWDday | CDDday | |||||||||||||||
| EOF1 | EOF2 | EOF3 | EOF1 | EOF2 | EOF3 | ||||||||||||
| 方差占比/% | 主要特征 | 方差占比/% | 主要特征 | 方差占比/% | 主要特征 | 方差占比/% | 主要特征 | 方差占比/% | 主要特征 | 方差占比/% | 主要特征 | ||||||
| 年 | 42.2 | 一致变化 | 8.4 | 东西反相 | 4.8 | 南北反相 | 42.4 | 一致变化 | 9.3 | 东西反相 | 6.6 | 南北反相 | |||||
| 冬季 | 54.5 | 一致变化 | 14.3 | 南北反相 | 3.8 | 东西反相 | 47.8 | 一致变化 | 10.1 | 南北反相 | 6.2 | 东西反相 | |||||
| 春季 | 52.2 | 一致变化 | 10.9 | 南北反相 | 3.6 | 东西反相 | 30.7 | 一致变化 | 20.3 | 东西反相 | 1.0 | 南北反相 | |||||
| 夏季 | 20.8 | 一致变化 | 10.6 | 东西反相 | 8.0 | 南北反相 | 31.2 | 一致变化 | 8.5 | 东西反相 | 972 | 南北反相 | |||||
| 秋季 | 26.8 | 一致变化 | 11.6 | 东西反相 | 7.9 | 南北反相 | 52.3 | 一致变化 | 7.1 | 东西反相 | 6.1 | 南北反相 | |||||
既然R95P、 R20day、 CWDday和CDDday的第一特征向量场(EOF1)都反映全区基本一致的变化特征, 那相应的主分量也就反映华南区域平均的极端降水的总体变化特征, 文中分析了这4种极端降水年及季节的第1主分量(PC1)与区域平均值的关系, 发现PC1与区域均值的趋势和变化特征是一致的。第2主分量(PC2)和第3主分量(PC3)所占总体方差一般都较小, 对总体变化特征的贡献有限, 限于篇幅, 这里不再以主分量的变化来分析各极端降水的特征, 而以区域均值的变化来分析华南极端降水的总体变化特征。
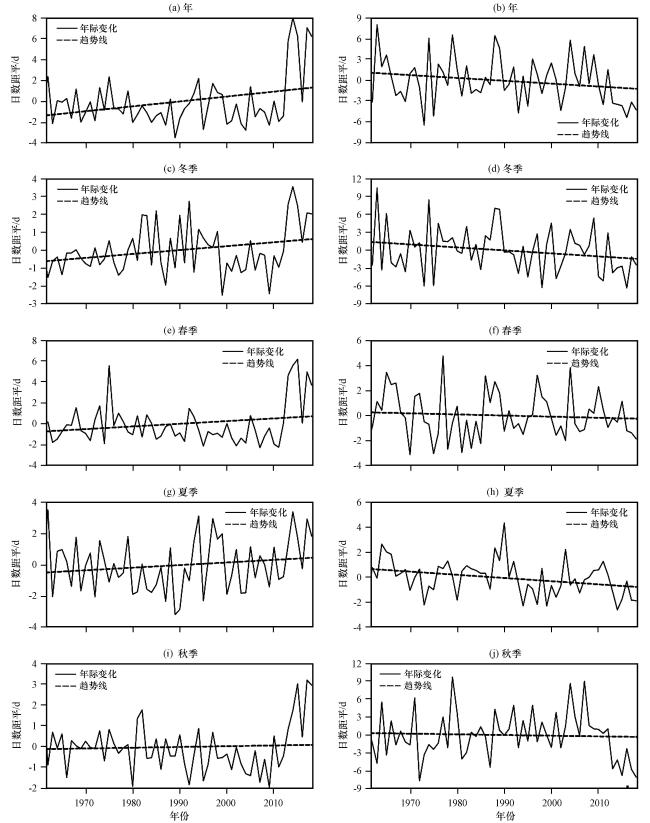
图8 和图9给出1961 -2018年华南区域平均的年和各季R95P、 R20day、 CWDday和CDDday的年际距平和趋势变化。也计算了1961 -2018年华南区域平均的年和各季9种极端降水的气候倾向率(表1), 结合表1、 图8和图9发现, 华南区域平均的R99P、 R95P、 RX1day、 RX5day、 R10day、 R20day和SDII这7种极端降水春季外都呈增加趋势, 年和夏季的R99P、 R95P、 R10day和R20day的增加趋势的置信度都达到了α=0.10水平的显著性检验, 表明R99P、 R95P、 R10day和R20day在夏季较显著增加, 年和冬季的RX1day和RX5day的增加趋势的置信度达到了α=0.10水平的显著性检验, 表明RX1day和RX5day在冬季较显著增加, SDII在冬季和夏季的增加趋势的置信度达到了α=0.10水平的显著性检验, 表明SDII在冬季和夏季较显著增加, CWDday在年和春季增加趋势的置信度达到了α=0.10水平的显著性检验, 表明CWDday在春季也较显著增加; 但是, 年和各季的CDDday都呈下降趋势, 年和冬季下降趋势的置信度达到了α=0.10水平的显著性检验, 表明CDDday在冬季较显著下降。从1中还可看出, 除了CWDday外, 春季各极端降水没有显著的变化趋势。
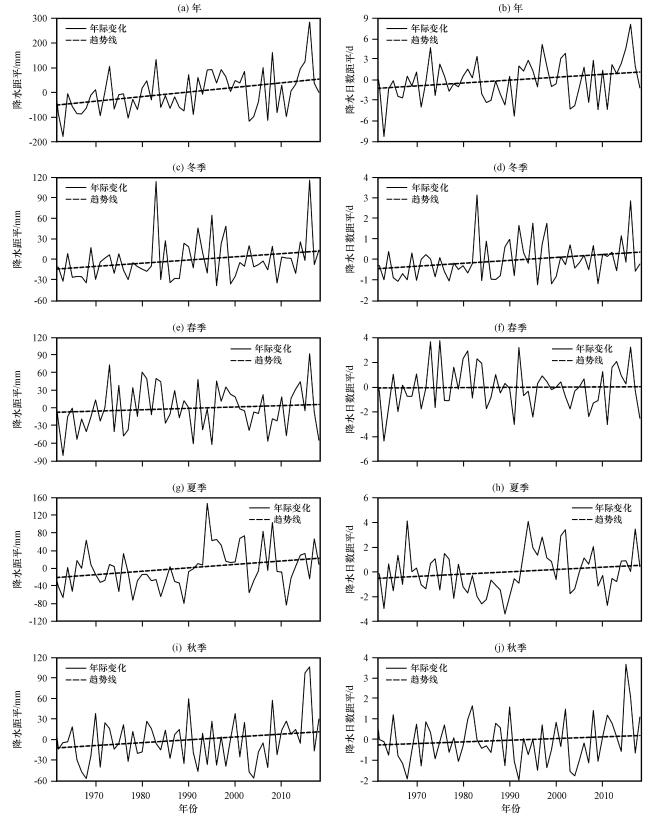
图8 1961 -2018年华南区域平均的年和各季R95P(左)和R20day(右)距平的变化Fig.8 |
5 结论和讨论
利用中国气象局CN05.1逐日气温(TM)和降水(PRE)资料(时间长度: 1961 -2018年, 空间分辨率: 0.25°×0.25°), 采用ETCCDI对极端降水事件的定义和经验正交函数分解, 分析比较了华南地区9种年和各季极端降水(R99P、 R95P、 RX1day、 RX5day、 R10day、 R20day、 SDII、 CWDday和CDDday)的变化特征, 得到以下主要结论:
(1) 华南地区年和各季气温明显升高, 冬季升温最明显, 幅度大, 显著范围广, 沿海地区和大城市的升温相对显著。在1961 -2018年, 华南年平均气温的升温率为0.018 ℃·a-1, 冬季、 春季、 夏季和秋季的升温率分别为0.023 ℃·a-1, 0.017 ℃·a-1, 0.011 ℃·a-1和0.020 ℃·a-1, 冬季的升温率超过夏季的2倍。华南地区年、 冬季和夏季降水以大范围增加为主, 年和夏季降水增加显著区域主要是粤港澳湾区, 春季降水增加显著区域在湖南南部和广西东北部; 春季降水的增加区域在广东、 湖南南部和广西东北部; 秋季降水在海南、 广西、 粤东西部、 以及福建地区增加, 在粤东到赣南区域、 湘西、 桂东北和贵州减少。冬季、 春季、 夏季和秋季平均降水都呈增加趋势。
(2) 按照空间分布和变化趋势, 华南地区9种极端降水可归为4类: 第1类为R99P、 R95P、 RX1day和RX5day, 第2类为R10day、 R20day和SDII, 第3类和第4类分别为CWDday和CDDday。华南区域平均的第1类和第2类极端降水除春季外都呈增加趋势, R99P、 R95P、 R10day和R20day在夏季较显著增加, RX1day和RX5day在冬季较显著增加, SDII在冬季和夏季较显著增加; CWDday在春季较显著增加; 但是, 年和各季的CDDday都呈下降趋势, CDDday在冬季较显著下降; 除了CWDday外, 春季各极端降水没有显著的变化趋势。以R95P、 R20day、 CWDday和CDDday为代表, 详细分析了4类极端降水年和各季变化趋势的空间分布特征。
(3) EOF分析表明, 华南地区极端降水主要是全区一致的变化, 其次为南北反相或东西反相的变化; 南北大致以23°N(华南西部) -25°N(华南东部)为界, 反映沿海地区和北部山区的反相变化; 东西大致以114°E为界, 东部负高值区主要在粤东地区和福建省, 西部正高值区主要在粤西沿海和广西。冬季的一致变化最强, 其主分量所占方差比例最大。
(4) 需要指出的是, 文中主要分析了华南极端降水的区域总体变化的趋势特征, 没有再进行细化分区研究, 从EOF的分析结果看, 一些年份, 华南极端降水南北或东西反相的特征很明显, 华南地区的极端降水存在区域差异, 另外, 本文还未对华南地区各类极端降水的年际和年代际振荡及其影响因子的探析, 这些都需要进一步仔细分析。