

1 引言
2 资料来源与方法介绍
2.1 资料来源
2.2 研究方法
表1 本文空气质量等级Table 1 The level of air quality in this paper |
| 空气质量指数 | 空气质量等级 | 空气质量类别 |
|---|---|---|
| 0~50 | 一级 | 优良 |
| 51~100 | 二级 | 优良 |
| 101~150 | 三级 | 轻度污染 |
| 151~200 | 四级 | 中度污染 |
| 201~300 | 五级 | 重度及以上污染 |
| 300 | 六级 | 重度及以上污染 |
3 干西南涡产生的大气环境效应
3.1 冬春季西南涡活动及空气质量统计
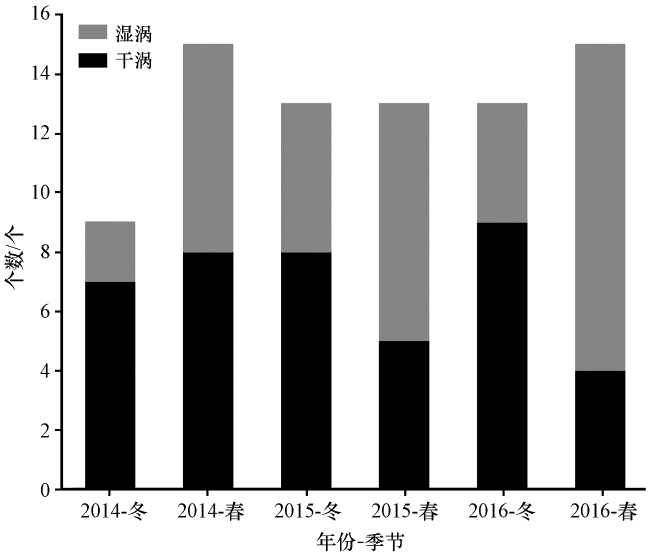
表2 与不同空气质量等级相关的西南涡数量Table 2 Numbers of SWVs associated with differentair quality grades |
| 西南涡 | 优良 | 轻度污染 | 重度污染 | 重度污染及以上 |
|---|---|---|---|---|
| 干西南涡 | 14 | 14 | 4 | 9 |
| 湿西南涡 | 27 | 8 | 2 | / |
表3 与不同空气质量等级相关的西南涡个数占比Table 3 Proportions of SWVs associated with differentair quality grades |
| 西南涡 | 优良 | 轻度污染 | 重度污染 | 重度污染及以上 |
|---|---|---|---|---|
| 干西南涡 | 34% | 34% | 10% | 22% |
| 湿西南涡 | 73% | 22% | 5% | / |
3.2 受干西南涡影响的重污染过程概述
3.3 干西南涡影响下的边界层特征
3.3.1 最大混合层厚度
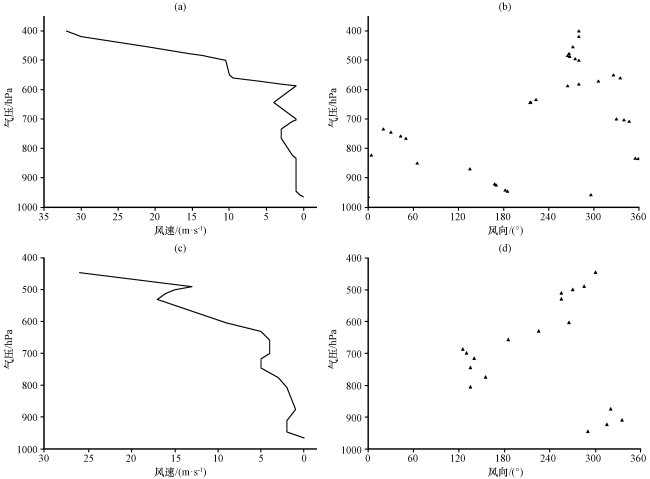
3.3.2 风场剖面
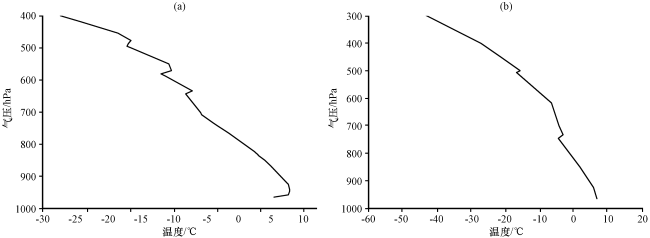
3.3.3 大气温度层结
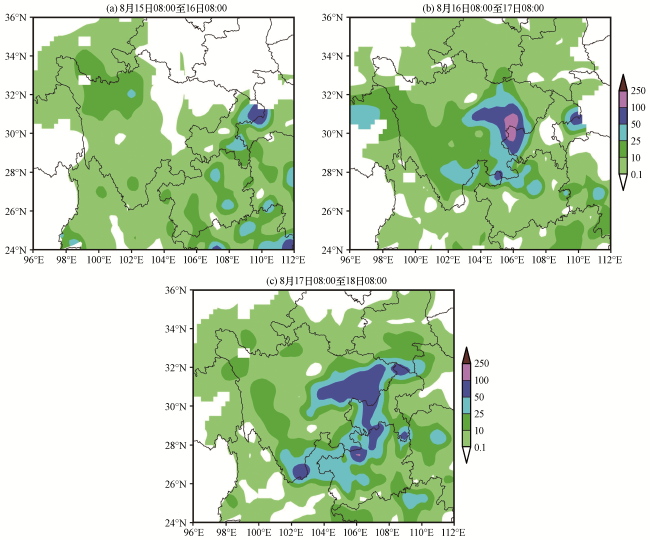
4 湿西南涡产生的湿清除效应
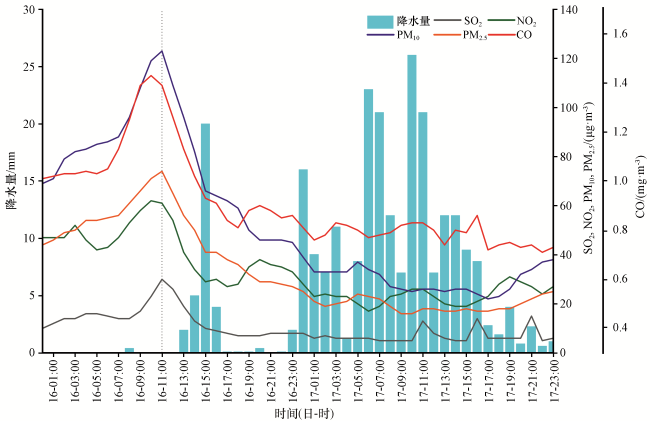
5 干、 湿西南涡的环流形势差异
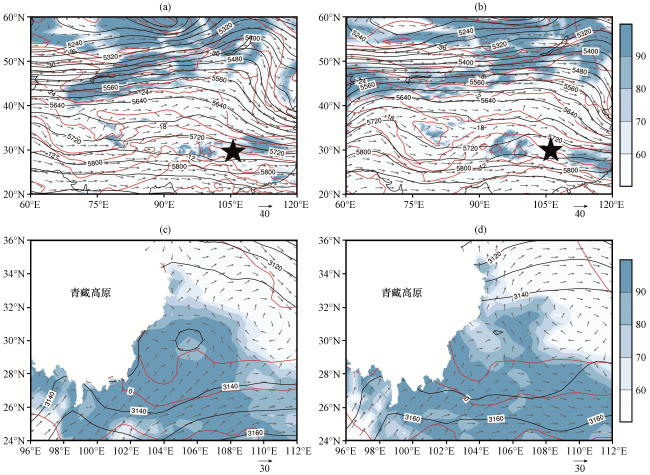
图9 2015年12月30日08:00(左)和20:00(右) 500 hPa(a, b)及700 hPa(c, d)位势高度场(黑实线, 单位: gpm)、 温度场(红实线, 单位: ℃)、 风场(矢量, 单位: m·s-1)及相对湿度(彩色区, 单位: %)分布五角星标记处为四川盆地 Fig.9 Distribution of the geopotential height field (black line, unit: gpm), temperature field (red line, unit: ℃), wind field (vector, unit: m·s-1) and relative humidity (color area, unit: %) at 500 hPa (a, b) and 700 hPa (c, d) at 08:00 (left) and 20:00 (right) on 30 December 2015.The star indicates the location of the Sichuan Basin |
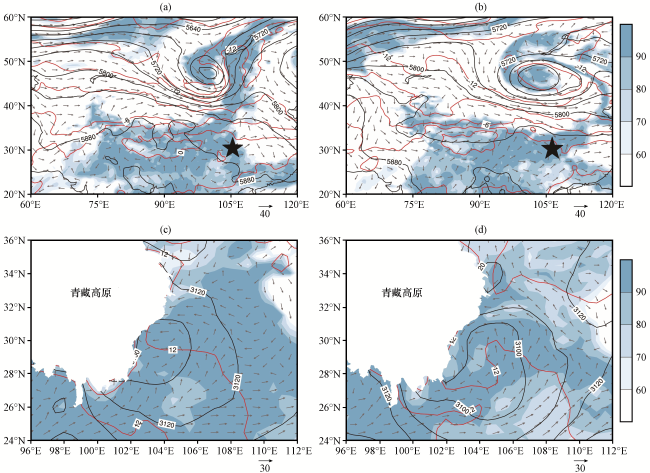
图10 2015年8月16日14:00(左)和17日14:00(右), 500 hPa(a, b)及700 hPa(c, d)位势高度场(黑实线, 单位: gpm)、 温度场(红实线, 单位: ℃)、 风场(箭头, 单位: m·s-1)及相对湿度(彩色区, 单位: %)分布五角形标记处为四川盆地 Fig.10 Distribution of the geopotential height field (black line, unit: gpm), temperature field (red line, unit: ℃), wind field (vector, unit: m·s-1) and relative humidity (color area, unit: %) at 500 hPa (a, b) and 700 hPa (c, d) at 14:00 on 16 (left) and at 14:00 on 17 (right) August 2015.The star indicates the location of Sichuan Basin |
6 干、 湿西南涡的结构差异
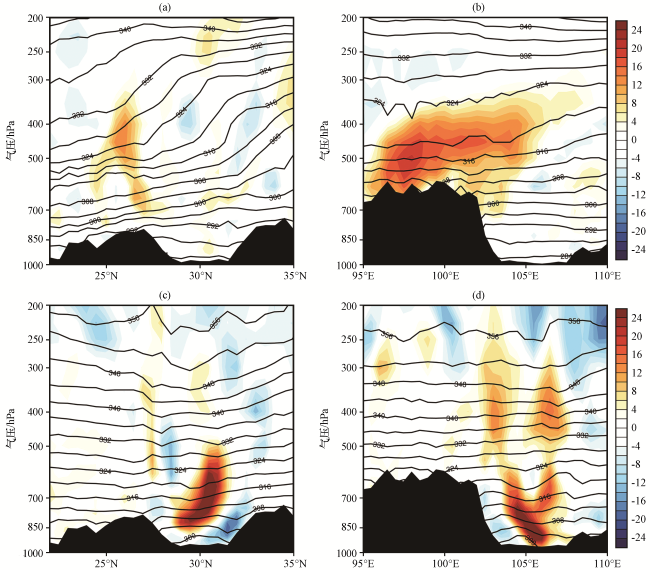
图11 2015年12月30日08:00干西南涡(a, b)和8月17日08:00湿西南涡(c, d)沿着其中心所在经纬度(30°N, 104.5°E)的经向(a, c)和纬向(b, d)垂直剖面黑色实线表示位温(单位: K), 彩色区表示相对涡度(单位: ×10-5 s-1), 黑色阴影区表示地形 Fig.11 Cross‑section of the dry SWV (a, b) at 08:00 on 30 December and wet SWV (c, d) at 08:00 on 17 Augest 2015, along latitude (a, c) and longitude (b, d) of the center of SWV.Solid line denotes potential temperature (unit: K).Color shading denotes relative vorticity (unit: ×10-5 s-1).The black shaded denotes topography |
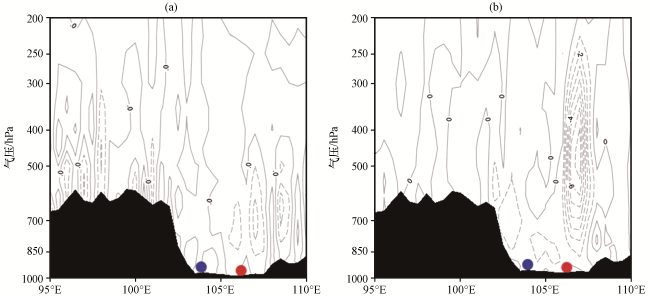


图12 2015年12月30日08:00干西南涡(a)和8月17日08:00湿西南涡(b)沿30°N的垂直运动剖面(单位: Pa·s-1)虚线表示上升运动, 蓝色点和红色点分别代表成都和重庆的位置, 黑色阴影区表示地形 Fig.12 Cross‑section of vertical motion along 30°N of the dry SWV at 08:00 on 30 December (a) and wet SWVat 08:00 on 17 August (b) 2015.Unit: Pa·s-1.Dotted line denotes upward motion, red and blue dots indicatethe location of Chongqing and Chengdu, respectively.The black shaded denotes topography |