
1 引言
2 资料来源与方法介绍
2.1 资料来源
2.2 方法介绍
3 结果分析
3.1 江淮地区极端干旱年时欧洲地区能量频散特征
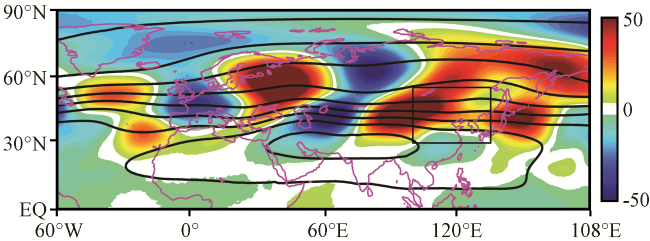
图1 江淮流域初夏200 hPa典型极端干旱年份(1998-2002年)高度距平场(彩色区, 单位: ×10-1 m2·s2)和位势高度气候平均场(等值线, 单位: ×10-4 m2·s2)分布方框为100°E以东、 30°N以北的我国北方地区(刘诗梦等, 2018) Fig.1 The distribution of geopotential height anomaly field (color area, unit: ×10-1m2·s2) and geopotential height climatic field (contour, unit: ×10-4 m2·s2) in the typical year of extremely arid (from 1998 to 2002) at 200 hPa duringthe early summer in the Yangtze‑Huaihe river basin.The rectangle represents the northern part of Chinawith a range of 100°E to the east and 30°Nto the north (From Liu et al, 2018) |
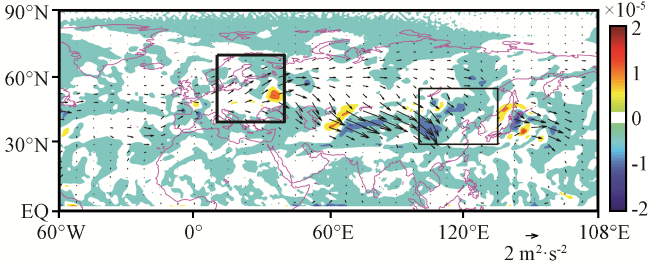
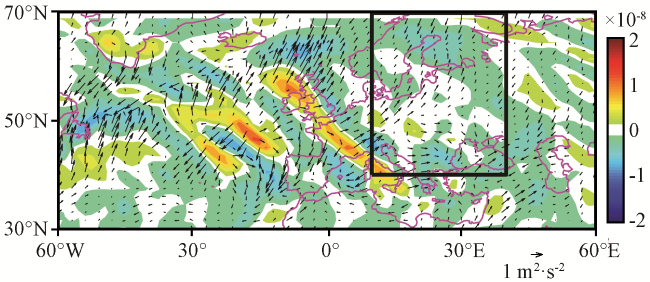
图2 初夏典型极端干旱年份(1998 -2002年)200 hPa波作用矢量(矢量, 单位: m2·s-2)与波通量散度(彩色区, 单位: m·s-2)细线方框为100°E以东30°N以北的我国北方地区, 粗线方框为关键区(刘诗梦等, 2018) Fig.2 The wave activity fluxes (vector, unit: m2·s-2) and its divergence (color area, unit: m·s-2) in the early summerat 200 hPa in the typical year of extremely arid (from 1998to 2002).The thin rectangle represents the northern partof China with a range of 100°E to the east and 30°N tothe north, and the thick rectangle represents keyarea (From Liu et al, 2018) |
3.2 动能分析
3.2.1 动能变率分析
3.2.2 动能变率的各项比重分析
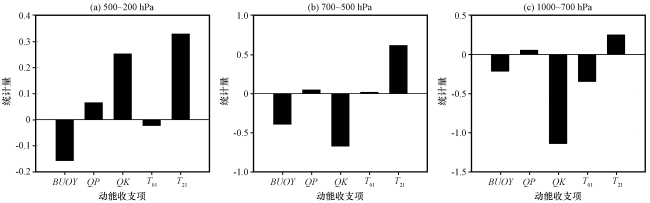
图4 欧洲关键区在江淮极端干旱年份时高层(a, 500~200 hPa)、 中层(b, 700~500 hPa)和低层(c, 1000~700 hPa)动能收支项经过标准化处理后的统计值Fig.4 Kinetic energy budget by standardized treatment in the upper (a, 500~200 hPa), middle (b, 700~500 hPa)and lower (c, 1000~700 hPa) levels of European key area in the typical year of extremely arid |
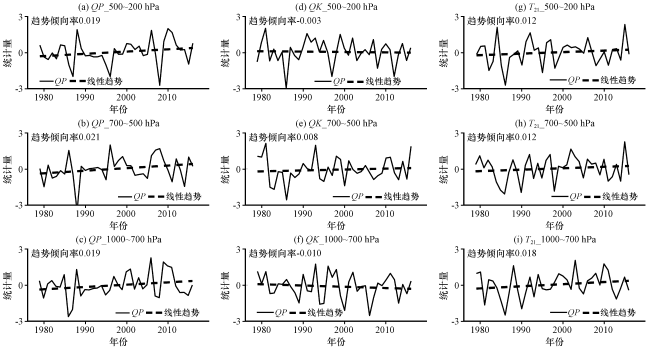
图5 初夏欧洲关键区在江淮极端干旱年份时高层(上, 500~200 hPa)、 中层(中, 700~500 hPa)和低层(下, 1000~700 hPa) QP(a~c)、 QK(d~f)、 T 21(g~i)的时间序列Fig.5 Time series of QP (a~c)、 QK (d~f)、 T 21 (g~i) in the upper (up, 500~200 hPa), middle (medium, 700~500 hPa) and lower (down, 1000~700 hPa) levels of European key area during the early summer |
3.3 高层动能的来源项分析
3.3.1 气压梯度力做功项和垂直动能平流项做功的诊断分析
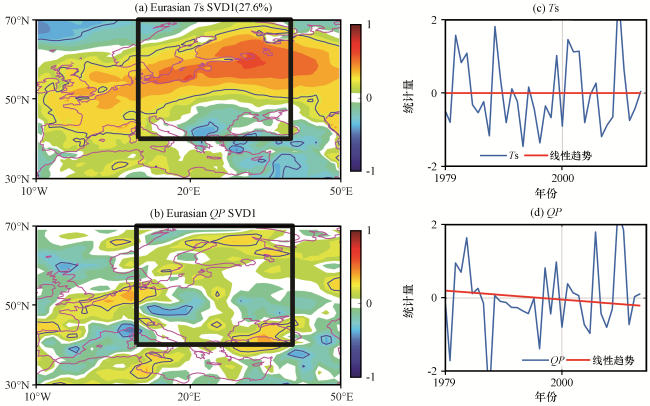
图7 初夏欧洲地表温度与整层(1000~200 hPa)气压梯度力做功项的SVD第一模态特征向量异类相关分布(a, b)及其标准化后的时间系数(c, d)Fig.7 Heterogeneous correlograms between the eigenvectors of the first mode derived from SVD of surface temperature and pressure work of European key area during the early summer (a, b) and the time coefficients (c, d) which have been standardized |
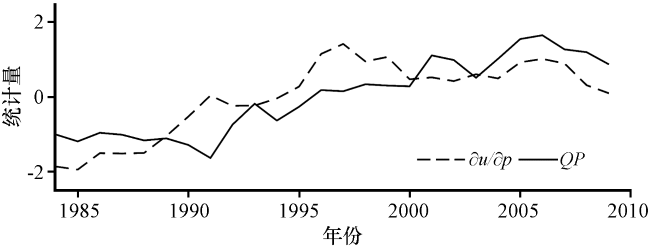
图8 初夏欧洲关键区低层(1000~700 hPa)垂直风切变(U)和气压梯度力做功项(QP)的区域平均随时间的变化曲线所有数值均经过标准化处理, 相关系数为0.74, 通过了99%的信度检验 Fig.8 Time series of vertical wind shear (U) and pressure work (QP) in lower (1000~700 hPa) levels of Europeankey area during the early summer.All data have beenstandardized, and the correlation coefficients was0.74 that passed the confident level of 99% |
3.3.2 天气尺度传输项的诊断分析
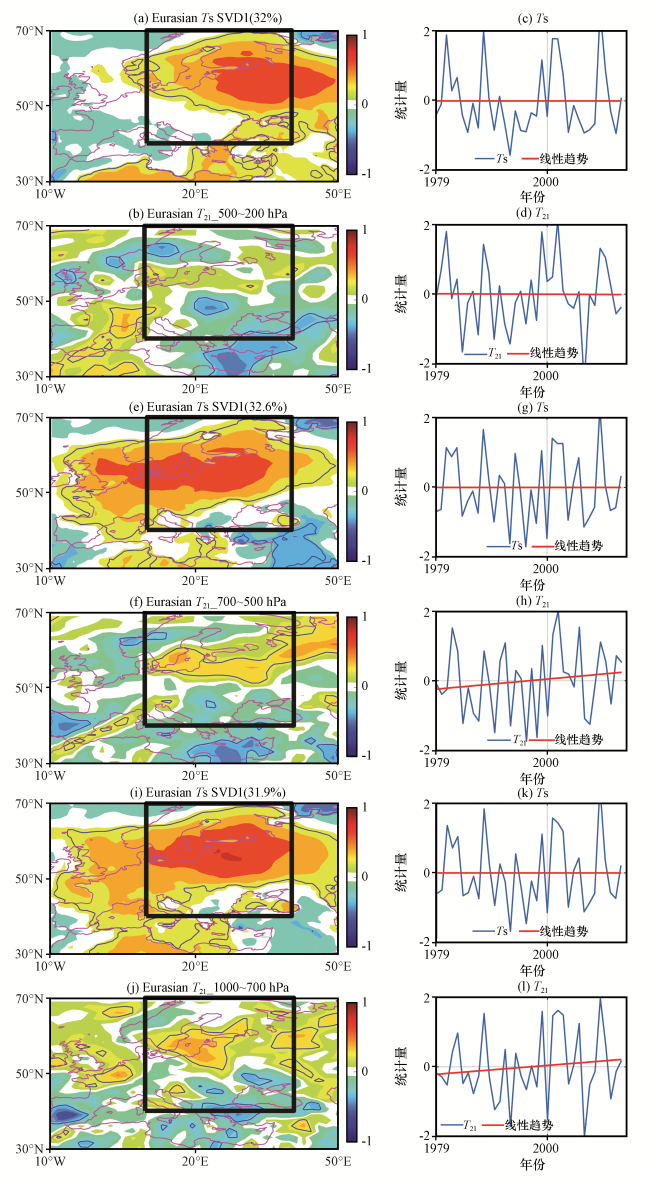
图10 初夏欧洲地表温度和高层(a~d, 500~200 hPa)、 中层(e~h, 700~500 hPa)和低层(i~l, 1000~700 hPa)天气尺度传输项的SVD的第一模态特征向量异类相关分布(左)及其标准化后的时间系数(右)Fig.10 Heterogeneous correlograms between the eigenvectors of the first mode derived from SVD of energy conversion fromsynoptic‑scale eddy in the upper (a~d, 500~200 hPa), middle (e~h, 700~500 hPa) and lower(i~l, 1000~700 hPa) level andsurface temperature of European during the early summer (left) and the time coefficients (right) which have been standardized |