

1 引言
近100年来全球气候变暖趋势明显, 中国气候变化蓝皮书(中国气象局气候变化中心, 2019)指出, 中国是全球气候变暖的敏感区, 1951 -2018年中国年平均气温增幅达0.24 ℃·(10a)-1, 升温率高于全球平均水平, 极端高温事件在20世纪90年代中期以来明显增多。干热风是高温、 低湿并伴有一定风力的三种气象因子综合作用的一种特殊灾害性天气(中国气象局, 2007; 董安祥等, 2005), 气候变暖必然导致干热风气象灾害发生变化, 气候暖干化使干热风发生区域扩大、 次数增多、 强度增强、 危害加重(邓振镛等, 2009)。
干热风的发生对区域粮食产出造成影响, 其中对小麦的生长发育影响最大(Lüttger et al, 2017)。干热风出现时, 各气象要素发生剧烈变化(中国科学院兰州高原大气物理研究所, 1975), 构成对小麦灌浆的环境胁迫, 籽粒早衰, 千粒重下降, 造成大幅减产(刘德祥等, 2008; 北方小麦干热风科研协作组, 1983)。针对干热风对小麦造成的巨大危害, 已有学者对此作了相关研究: 早期研究多集中于防御措施, 目的是减轻其危害(山东菏泽地区气象局, 1976; 华北农业大学干热风科研协作组, 1978), 20世纪80年代初, 小麦干热风科研协作组确定了北方小麦干热风气象指标, 做出我国第一个北方小麦干热风气候区划(小麦干热风科研协作组, 1981), 之后在区域指标(北方小麦干热风科研协作组, 1983)、 灾害成因(北方干热风科研协作组, 1984)和气候特征(陈昌毓, 1982)等方面取得许多成果, 并开始对预测模型进行研究(曹玲等, 1997), 干热风防御技术得到提高。2000年之后在研究内容和方法上均有所改进, 主要集中在干热风对小麦灌浆影响(张志红等, 2015)、 区域时空分布(邬定荣等, 2012; 李森等, 2018)和风险区划(李香颜等, 2017)等方面, 遥感(刘晓丹, 2018)和不同气候模式(刘玲等, 2012)也为监测和预报干热风提供了依据。
河西地区是我国春小麦主要产区, 分析该地区干热风发生特征对春小麦减灾预测和安全生产有重要意义。此前河西地区干热风研究多集中于成因、 时空分布、 造成的危害和防御对策等方面(中国科学院兰州高原大气物理研究所, 1975; 邓振镛等, 2009; 陈昌毓, 1982; 曹玲等, 1997; 候启等, 2019), 主要针对河西整体区域进行研究。但干热风灾害局地性、 突发性较强(成林等, 2011), 干热风对不同地区的影响不尽相同。此外以往研究针对气候变化对干热风灾害的影响多与同期气象要素和高温天数进行相关分析(刘德祥等, 2008; 李红忠等, 2015), 少与同期蒸散发的变化进行对比分析, 而干热风发生时农作物植株水分大量蒸腾进而造成巨大危害。基于此, 本研究根据河西地区两条自然分界线对干热风进行分区, 在年际变化特征基础上, 分析灾害开始和结束日期及影响范围变化情况, 探讨发生日数与其相关气象要素及潜在蒸散量之间的关系; 依据全球气候变化特征将1960 -2017年划分为1960 -1987年(时段Ⅰ)和1988 -2017年(时段Ⅱ)两个时段(施雅风等, 2003; 张耀宗等, 2016), 统计分析各站点在干热风发生时段内日最高气温≥32 ℃及14:00(北京时, 下同)相对湿度≤30%的日数, 结合实际发生干热风气象灾害日数计算达到某一气象条件时发生灾害的概率, 为河西地区小麦干热风重点防范区域的演变和预警防御提供参考。
2 资料选取与方法介绍
2.1 研究区概况
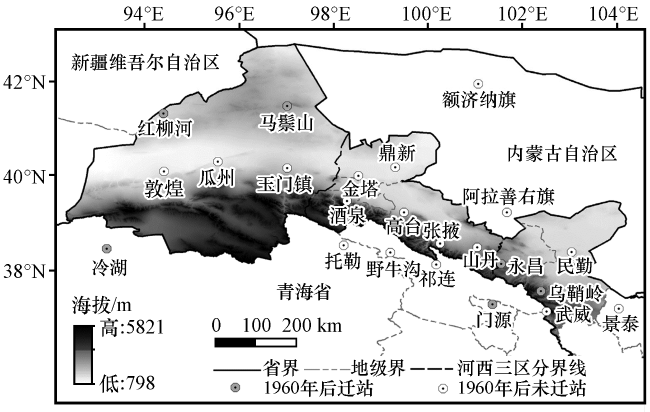
甘肃省河西地区位于中国西北干旱区, 介于祁连山北麓与阿拉善高原之间, 从甘新交界处的星星峡到乌鞘岭, 包括武威、 金昌、 张掖、 嘉峪关和酒泉五个地级市。河西地区年平均温度5.8~9.3 ℃, 年降水量少且分布不均匀, 日照时间长, 光照资源丰富, 对春小麦生长发育十分有利。大黄山隆起带和黑山隆起带把河西三大内流河流域分隔开, 据此对区域内气象站点进行分区: 武威、 永昌和民勤站代表河西地区东部, 张掖、 山丹、 酒泉、 鼎新和金塔站代表中部, 敦煌、 瓜州、 玉门镇和马鬃山代表西部(图1)。人口、 农业分布在走廊地区, 丰富的高山冰雪资源和地下水资源, 为发展灌溉农业提供了优越的条件。
2.2 数据来源
选取了甘肃河西及周边地区共23个气象站点的1960 -2017年的日最高气温、 平均气温、 日最低气温、 平均相对湿度、 最小相对湿度、 平均风速、 日照时数和降水量数据, 数据来自中国气象局国家气象信息中心的中国地面气候资料日值数据V3.0, 本文选取的站点中有6个站点在1960年后有迁站的情况, 站点分布如图1所示。气象数据经过严格的质量控制与均一性检验、 订正, 对缺测数据通过均值法和回归法进行确认和插补, 查阅研究区所选站点的气象台站简史, 对因台站变迁、 仪器更换等原因出现断点的数据序列进行订正, 确保数据的真实性。文中涉及的地图底图来源于中华人民共和国自然资源部标准地图服务(http: //bzdt.ch.mnr.gov.cn/), 根据审图号为GS(2016)2885号的标准地图绘制, 底图无修改。干热风灾害记录来自于国家气象信息中心的中国农业气象灾情旬值数据集和《中国气象灾害大典·甘肃卷》。
2.3 研究方法
2.3.1 干热风指标
影响甘肃河西春麦区小麦扬花灌浆期的主要干热风类型是高温低湿型, 根据2007年中国气象局发布的中华人民共和国气象行业标准《小麦干热风灾害等级》, 确定河西干热风等级指标和天气过程等级指标。干热风轻型指标为日最高气温≥32 ℃, 14:00相对湿度≤30%; 重型指标为日最高气温≥35 ℃, 14:00相对湿度≤25%, 14:00风速不是限制性要素。重干热风过程为连续出现≥2天重日或在1次干热风天气过程中出现2天不连续重日, 或1个重日加2个以上轻日; 轻干热风过程为除重干热风天气过程所包括的轻日外, 连续出现≥2天轻日或连续2天出现1轻1重干热风日, 或出现1天重日。一次干热风过程中有两个或以上站点同时或先后发生干热风事件为一次大面积干热风事件。
2.3.2 单一指标满足时干热风发生概率
达到某一干热风气象条件时干热风预计发生概率为干热风发生时段内日最高气温≥32 ℃、 14:00相对湿度≤30%天数与实际发生干热风的天数的比值, 计算公式如下:
.
2.3.3 潜在蒸散量
潜在蒸散量又称参考作物蒸散量, 是水分循环的重要组成部分, 也是能量平衡的重要部分。相关研究指出FAO-56适用于干旱气候条件下潜在蒸发量估算(焦丹丹等, 2018), 因此采用FAO推荐的Penman-Monteith方法(Allen et al, 1998)计算逐日潜在蒸散量, 计算公式如下:
,
式中: ET 0为潜在蒸散量(单位: mm·d-1); Rn为净辐射(单位: MJ·m-2·d-1); G为土壤热通量(单位: MJ·m-2·d-1); T为日平均气温(单位: ℃); u 2为2 m高处风速(单位: m·s-1), 由10 m处的风速乘以0.75所得; es为饱和水汽压(单位: kPa); e a为实际水汽压(单位: kPa); Δ为饱和水汽压-温度曲线斜率(单位: kPa·℃-1); γ为干湿表常数(单位: kPa·℃-1)。
2.3.4 小波分析
小波分析是一种广泛应用于气候变化等领域的一种新的实频局部变化的分析方法(魏凤英, 2007), 选用Morlet复数小波研究方法, 该小波是Gauss包括下的单频率复正弦函数, 在时域和频域内有较好的局部聚集性(Grinsted et al, 2004)。Morlet复数小波函数为:
,
式中: t为自变量; ω0为无量纲频率, 其值通常取6。对于时间序列χb(b*=0, 1, 2, …, N-1, N为时间序列长度), 小波变换为:
,
式中: Wb*(a, b)为小波变换系数; ψ*表示其共轭复数; a为时间平移因子; δt为采样时间间隔。
2.3.5 其他方法
对气候变化的趋势分析采用气候倾向率法, 气候变化突变分析采用Mann-Kendall突变方法和滑动T检验法, 对干热风发生趋势分析选用了快速傅里叶变换(Fast Fourier Transform,FFT)进行分析。用Matlab、 SPSS和Origin软件进行计算, 通过ArcGIS10.2的RBF插值方法进行空间表达。
3 结果与分析
3.1 气候资源变化特征
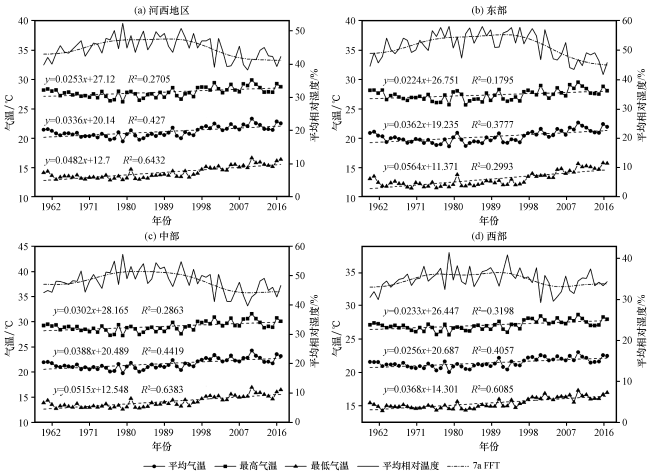
从河西地区58年来6 -7月日平均气温、 日最高气温、 日最低气温和日平均相对湿度平均值随时间的变化(图2)中可以看出, 河西地区气温总体呈上升趋势, 平均、 最高和最低气温的气候倾向率分别为0.34, 0.25和0.48 ℃·(10a)-1。中部是升温幅度最大的区域, 受气候变化影响最为敏感, 其中最高气温和平均气温升幅最大, 分别为0.3 ℃·(10a)-1和0.39 ℃·(10a)-1; 东部近年来相对湿度降低较快, 最低气温和平均气温均有较大升幅, 分别为0.56 ℃·(10a)-1和0.36 ℃·(10a)-1; 西部升温幅度相对较小, 其相对湿度较低且变化较小。河西地区相对湿度总体呈先升高后降低的趋势, 西部地区相对湿度变化较小, 东部和中部地区变化较大。
3.2 干热风变化特征
3.2.1 年际变化
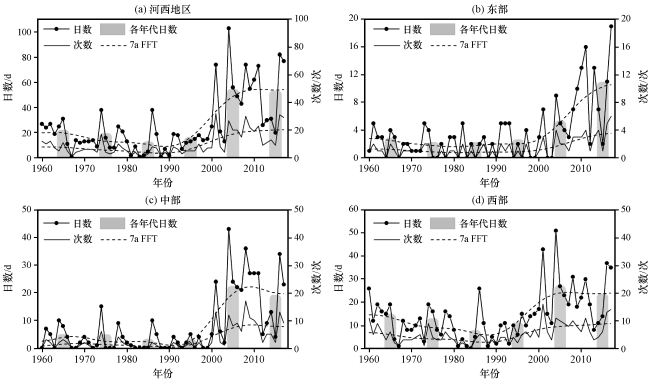
从图3中可以看出, 河西地区干热风发生总次数和日数先缓慢减少后迅速增多, 近年有减少趋势。河西地区东部、 中部和西部干热风发生次数和日数发生趋势与干热风发生总体趋势大致相同, 发生特征有区域差异。东部地区发生次数和日数较少, 2000年之后干热风明显增多, 且持续时间增长; 中部干热风发生次数和日数较东部多, 2000年后出现爆发式增长, 其年际趋势与河西地区干热风发生总日数相关性最高(α=0.938), 表明河西地区2000年之后干热风发生日数迅速增多主要是由于中部干热风日数的增加所致; 西部是干热风发生最多也是最严重的区域, 研究时段内多数年份都有干热风发生。
3.2.2 影响范围变化
统计河西地区大面积干热风事件(表1)可知, 大面积干热风事件发生站数和日数在年际变化上先缓慢减少后迅速增多, 干热风波及的站点越多, 发生次数越少。对站点进行分区分析可知, 大面积干热风事件只发生在河西一个区域的有21次, 且绝大多数发生在西部地区, 只发生在一个区域的大面积大热发事件次数有逐渐减少趋势; 影响两个区域的干热风事件有52次, 占发生次数的46%, 且绝大多数发生在中西部, 在年际变化上与干热风发生总体趋势大致相同, 均在2000年之后有了爆发性的增长; 影响整个河西地区的干热风事件有40次, 2000年之后波及整个河西地区的干热风发生次数变多, 表示干热风影响范围进一步扩大。
表1 各年代大规模干热风事件影响的区域及次数统计Table 1 Statistics on the area and frequency of large-scaledry-hot wind events in various eras |
| 年代 | 一个区域 | 两个区域 | 整个区域 | ||
|---|---|---|---|---|---|
| 东-西 | 中-西 | 东-中 | |||
| 1960s | 7 | 4 | 3 | 1 | 4 |
| 1970s | 4 | 3 | 6 | 0 | 3 |
| 1980s | 1 | 2 | 0 | 1 | 2 |
| 1990s | 5 | 0 | 4 | 1 | 4 |
| 2000s | 3 | 0 | 18 | 1 | 17 |
| 2010s | 1 | 3 | 4 | 1 | 10 |
表中数值单位为次 |
3.2.3 起始和结束时间变化
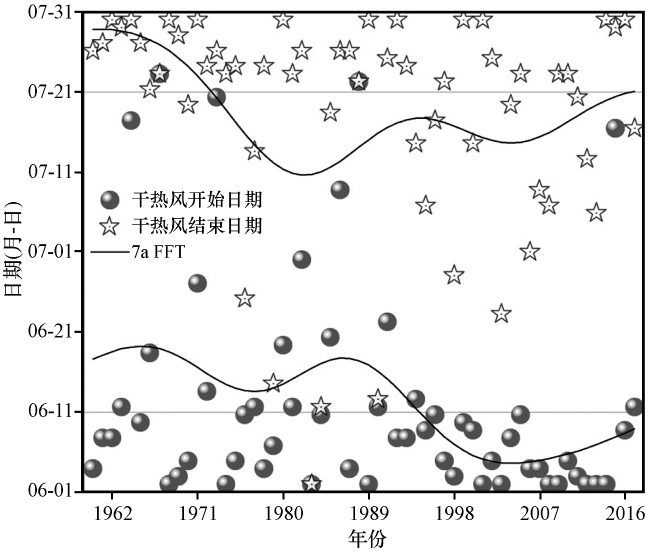
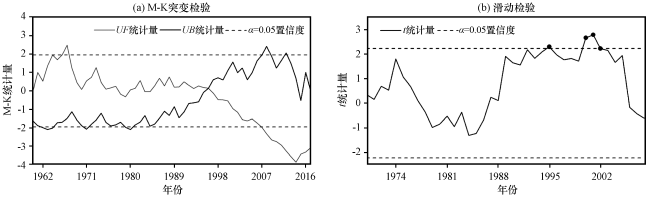
统计河西地区历年干热风发生起始和结束日期(图4), 干热风起始日期年际分布结合Mann-Kendall突变分析[图5(a)]可知, 河西地区干热风起始日期UF和UB曲线交于信度线±1.96(α=0.05)之间, 交点为1995年。根据图5(b)可知自1970年以来, t统计量有4处超过信度线±2.23(α=0.05), 认为在1995年干热风起始日期发生突变。在此之前起始日期变动幅度相对较大, 年际间变化不稳定, 之后则多稳定在6月上旬, 总体干热风起始日期有提前趋势。干热风结束日期在1993年之前多数年份分布在7月下旬, 此后干热风结束日期呈不稳定变化。滑动t检验显示在1993年超过了信度线±2.23(α=0.05), 但并未通过M-K突变检验(图略)。结束日期先提前、 后推迟, 整体上呈提前趋势。结合干热风历年发生日数特征可知, 干热风发生较少时期, 其起始和结束时间不稳定且开始和结束日期所间隔日数较少, 干热风多发年份则间隔日数较多。
3.3 气候变化对干热风的影响
3.3.1 对发生日数的影响
利用Morlet小波对河西及其三个区域历年干热风日数与各相关要素进行分析, 提取其小波系数实部过程线, 并计算不同年代的相关系数(图6), 分析各相关要素与干热风日数之间的响应关系。河西地区干热风日数主要表现为6年左右的周期, 21世纪之前平均气温、 最高气温和潜在蒸散量偏高期对应干热风日数的偏少期, 这种趋势在20世纪80年代后最为显著, 21世纪以后转变为平均气温、 最高气温和潜在蒸散量偏高期对应干热风日数的偏多期, 主要是由于21世纪之后河西地区气温明显升高, 随之干热风发生日数增多, 使其对应关系最好; 最低气温与干热风日数的整体对应性较好, 相对湿度的低值期则多对应干热风日数的偏多期。
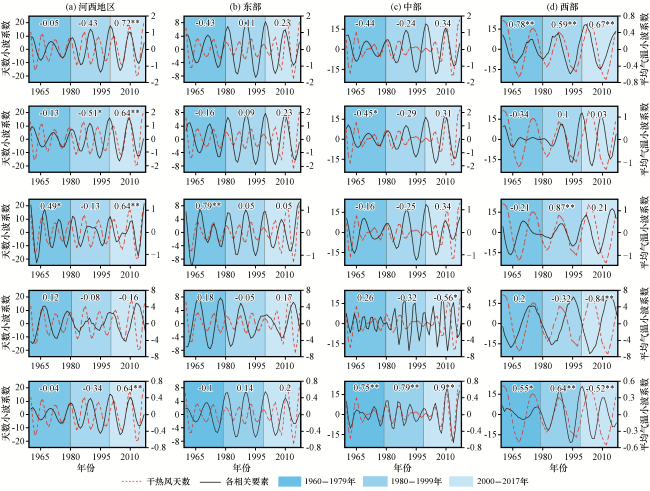
图6 干热风日数与各相关要素小波系数实部过程线**和*为相关系数分别通过0.01和0.05水平的显著性检验, 1960 -1999年α 0.01=0.537, α 0.05=0.423, 2000 -2017年α 0.01=0.575, α 0.05=0.456 Fig.6 The real part transforms of dry-hot wind days and correlation factors in the wavelet coefficients.** and * are thesignificance tests for the correlation coefficients passing the 0.01 and 0.05 levels respectively.From 1960 to 1999, α 0.01=0.537, α 0.05=0.423, from 2000 to 2017, α 0.01=0.575 and α 0.05=0.456 |
东部干热风日数主要表现为5年左右周期, 干热风日数与各相关要素的对应均较差, 各年代小波实部过程线的相关系数较低, 仅在20世纪60、 70年代与最低气温小波系数通过显著正相关检验, 主要是由于东部地区干热风发生日数总体较少, 周期表现不明显。中部干热风日数表现为5年周期, 21世纪之前平均气温、 最高气温和最低气温偏高期对应干热风日数的偏少期, 21世纪之后平均气温、 最高气温和最低气温偏高期对应干热风日数偏多期; 相对湿度在20世纪80年代之后的偏低期对应干热风日数偏多期, 且在21世纪之后趋势最为显著; 潜在蒸散量与干热风日数周期对应最为明显, 其相关系数在不同年代均通过了0.01水平的置信度检验检验; 21世纪后中部升温明显, 相对湿度降低, 干热风日数迅速增多, 干热风日数与各相关要素小波系数相关性较好。西部干热风日数表现为12年周期, 干热风日数与平均气温和潜在蒸散量小波系数的对应性较好, 相关系数均通过了0.01水平的置信度检验; 20世纪80年代之后干热风日数的偏多期对应最高气温、 最低气温的偏高期和相对湿度的偏低期, 21世纪后与相对湿度负对应最为显著。总体而言, 干热风发生日数小波系数偏高期多对应气温和潜在蒸散量偏高期, 中、 西部地区干热风日数与潜在蒸散量的对应关系最好; 干热风日数与相对湿度多为负对应, 即日数高值期多对应相对湿度的低值期, 这些对应关系均在21世纪后表现最为明显; 20世纪80年代至20世纪末, 干热风日数与各相关要素的对应性相对较差。
3.3.2 对发生范围和时间的影响
3.3.3 对发生概率的影响
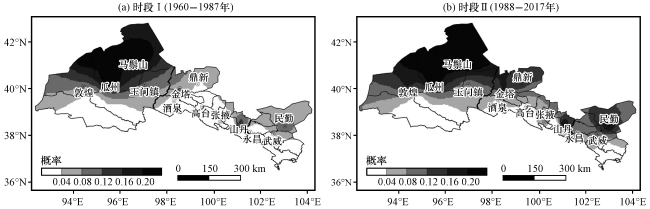
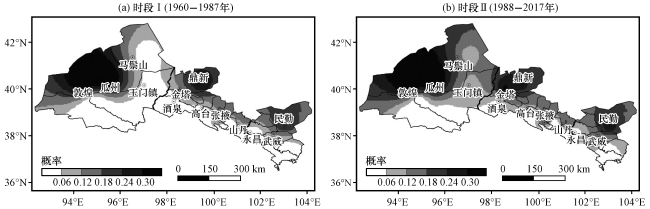
从图8中可以看出, 14:00相对湿度≤30%时河西安敦盆地及鼎新、 民勤地区发生干热风灾害的可能性最大, 总体呈现由海拔较低的站点向较高站点风险性逐渐降低的趋势。海拔较低的地区温度达到干热风指标的日数较多, 当14:00相对湿度条件达到时, 发生干热风事件的风险性最大, 典型站点如敦煌、 鼎新等站。相比两个时段, 14:00相对湿度低于30%时发生干热风的范围明显向更高海拔地区扩展, 概率高值区范围变化较少, 中部地区湿度条件达到时发生干热风的风险范围较大, 发生概率值明显升高的站点有金塔、 民勤等站。14:00相对湿度≤30%时发生干热风灾害的概率大于日最高气温≥32 ℃时的概率, 表明当14:00相对湿度达到干热风条件时, 更有可能发生干热风。


4 结论与讨论
4.1 结论
(1) 干热风发生时段内气温明显升高, 平均气温和最高气温升幅最大的均为中部地区, 最低气温升幅最大的是东部; 相对湿度变化先升高后降低, 东部和中部变化较大; 中部地区是升温幅度和湿度变化最大的区域, 受气候变化影响最为敏感。
(2) 干热风年际变化呈先缓慢减少后迅速增多的趋势, 发生特征有区域差异性。西部干热风发生次数最多, 2000年之后中部干热风发生日数迅速增多。干热风影响范围进一步扩大, 大面积干热风事件中影响中部地区的频次明显增多, 且影响整个河西地区的干热风事件也在21世纪后有了爆发性增长。干热风开始日期在1995年发生突变, 之后稳定在6月上旬, 总体有提前趋势; 在干热风发生较少时期, 起始和结束日期不稳定且间隔日数较少, 干热风频发年份则间隔日数较多。
(3) 干热风发生日数小波系数偏高期多对应气温和潜在蒸散量偏高期, 日数与相对湿度则多为负对应, 这些对应关系均在21世纪后表现最为明显。东部地区日数与各相关要素的对应相对较差, 中、 西部地区日数与潜在蒸散量的对应关系较好。
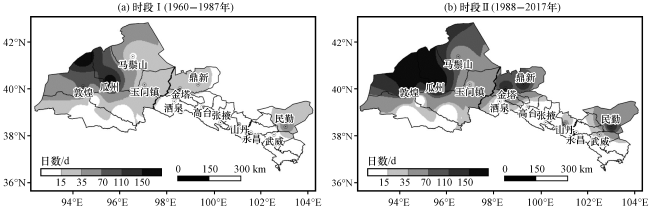
(4) 河西地区时段Ⅱ相较时段Ⅰ日最高气温达到32 ℃与14:00相对湿度低于30%的日数均有增多。日最高气温达到32 ℃时, 河西地区西北部地区发生干热风气象灾害的可能性最大, 总体呈现由北向南风险概率逐渐降低的趋势。14:00相对湿度≤30%时河西安敦盆地及鼎新、 民勤地区发生干热风灾害的可能性最大, 总体呈现由低海拔的站点向高海拔站点风险概率逐渐降低。
4.2 讨论
近几十年河西地区气候变暖明显, 气候不稳定性增加(贾文雄, 2012; 刘琼等, 2018), 1961 -2014年河西地区平均气温升幅达0.36 ℃·(10a)-1(王鹤龄等, 2017), 上升速度远大于全国平均气温升温速度的0.24 ℃·(10a)-1和西北干旱区的0.32 ℃·(10a)-1(中国气象局气候变化中心, 2019; 马转转等, 2019)。极端高温日数在20世纪60 -80年代变化不大, 90年代中后期以后明显增多(孙兰东等, 2006), 此变化与河西地区90年代后干热风日数增多、 范围扩大的变化趋势一致; 在空间分布上, 河西地区极端高温高值区位于西部的敦煌、 瓜州, 中部的鼎新、 金塔和东部的民勤, 极端气温高值区与本研究中干热风发生高值区所对应; 且河西中部夏季独特的极端高温特征也在本文中得到印证: 中部地区气温升高明显, 尤其在20世纪末高温日数迅速增多也使得干热风发生日数迅速增多。
在气候显著变化背景下, 小麦的物候发生明显变化, 河西地区春小麦生长季呈缩短趋势, 成熟期提前(张亚宁等, 2017), 本研究表明干热风发生的开始日期较之前年份更加稳定在6月上旬, 并且整体上有提前趋势, 此趋势下干热风在小麦生殖生长期会造成更加严重的危害。对未来极端高温事件预测结果显示, 在小麦扬花灌浆期所受热胁迫事件会进一步增多, 在此趋势下春小麦受热胁迫导致的减产量更大(Yang et al, 2017)。为适应气候变化, 近年河西地区在农业产业结构进行了调整, 春小麦种植面积缩小, 瓜果、 棉花等经济作物种植比重增加(张洁等, 2013), 由于一些作物在河西种植历史较短或分布海拔较高未曾大规模遭受干热风侵袭, 没有形成有效的预防和应对干热风的措施。近年干热风进一步蔓延至更高海拔地区, 在干热风出现时温度更高, 影响的作物种类范围扩大, 因此这类作物应对干热风的防御措施等还需继续研究, 以保证作物生产安全。