
1 引言
2 资料来源和方法介绍
2.1 OMI卫星臭氧数据
2.2 模式模拟和实验设置
3 结果分析
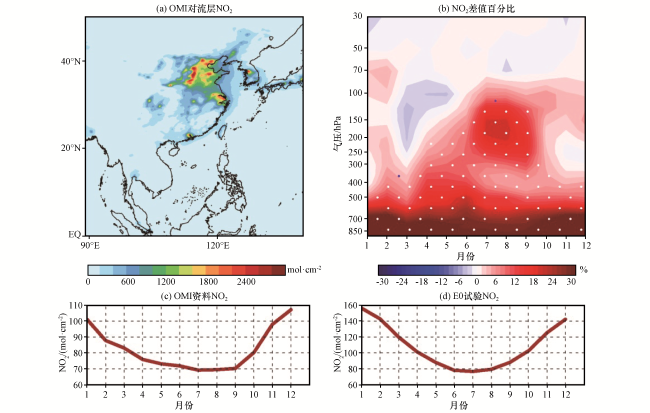
图1 2004年10月至2016年12月OMI卫星观测得到的NO2对流层柱总量气候态分布(a, 单位: mol·cm-2)、E4试验与E0试验模拟的东亚地区上空NO2浓度差值百分比(b, 单位: %)、 2004年10月至2016年12月OMI卫星资料(c)及E0试验中(d)NO2对流层柱总量季节变化图(b)中打点区域为通过90% t检验置信水平区域 Fig.1 Climatological mean distribution of NO2 tropospheric column derived from OMI satellite data from October 2004 toDecember 2016 (a, unit: mol·cm-2), percentage differences in NO2 concentration over East Asia between E4 and E0(b, unit: %), seasonal cycle of total tropospheric NO2 column from OMI satellite data from October 2004 toDecember 2016 (c)and from WACCM experiment E0 (d).The dotted regions in Fig.1(b) arestatistically significant at the 90% confidence level according to Student’s t-test |
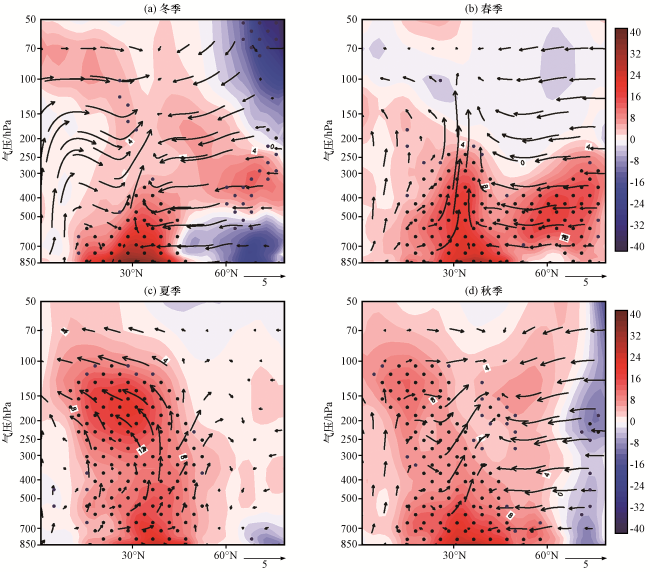
图2 不同季节E4试验与E0试验NOx浓度在90°E -140°E区域内差值百分比(彩色区, 单位: %)及E0试验经向风速和垂直速度合成的风场(矢量, 单位: m·s-1)分布打点区域为通过90% t检验置信水平区域 Fig.2 Distribution of percentage differences (color area, unit: %) in NOx concentration between E4 andE0 in the 90°E -140°E section, and the wind field (vector, unit: m·s-1) composed of meridional windspeed and vertical velocity in E0 in different season.The dotted regions are statisticallysignificant at the 90% confidence level according to Student’s t-test |
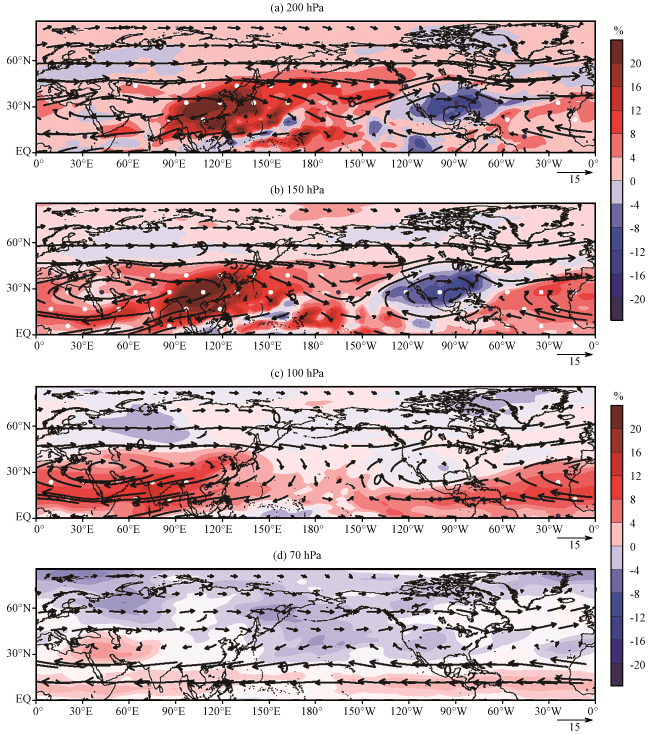
图3 不同高度E4试验与E0试验北半球夏季的NOx浓度差值百分比(彩色区, 单位: %)及E0试验纬向风速和经向风速合成的水平风场(矢量, 单位: m·s-1)分布打点区域为通过90% t检验置信水平区域 Fig.3 Distribution of percentage differences (color area, unit: %) in NOx concentration in the northern hemisphere in summer between E4 and E0, and the horizontal wind field (vector, unit: m·s-1)composed of zonal and meridional wind speeds in E0 at different highs.The dotted regionsare statisticallysignificant at the 90% confidence level according to Student’s t-test |
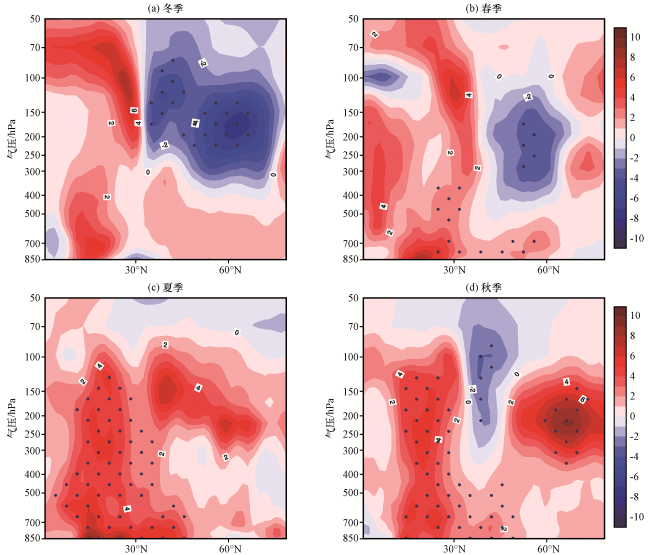
图4 90°E -140°E区域内不同季节E4试验与E0试验臭氧浓度差值百分比分布(单位: %)打点区域为通过90% t检验置信水平区域 Fig.4 Distribution of percentage differences in ozone concentration between E4 and E0 at different seasons in the 90°E -140°Esection.Unit; %.The dotted regions are statistically significant at the 90% confidence level according to Student’s t-test |
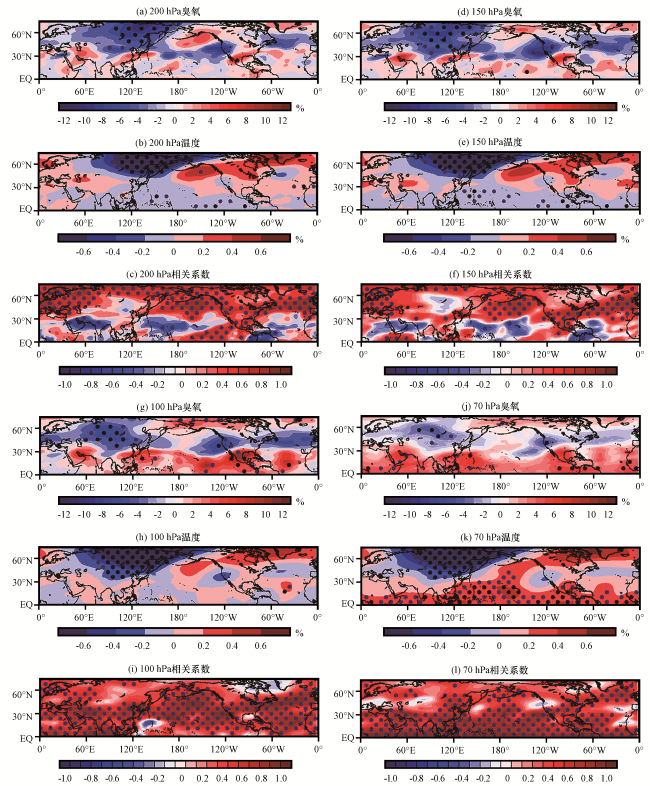
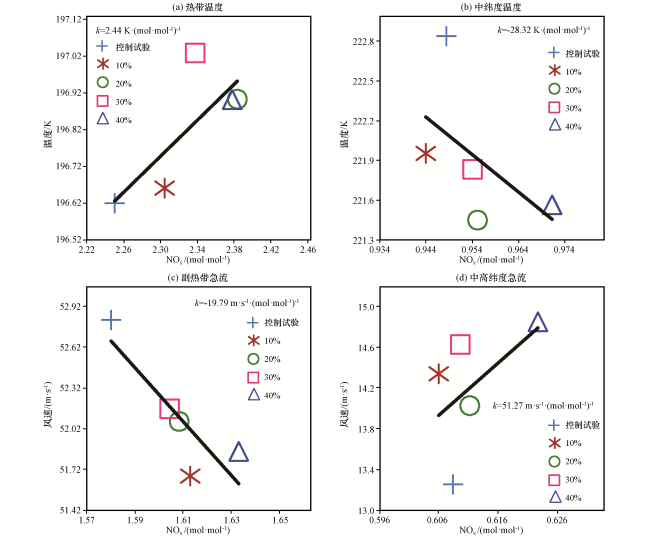
图5 E4试验与E0试验北半球冬季不同高度臭氧浓度差值百分比(单位: %)、温度差值百分比(单位: %)及二者的相关系数打点区域为通过90% t检验置信水平区域 Fig.5 The percentage differences in ozone concentration (unit: %) and temperature (unit: %) in winter betweenE4 and E0 and correlation coefficients between ozone and temperature at different highs.The dottedregions are statisticallysignificant at the 90% confidence level according to Student’s t-test |
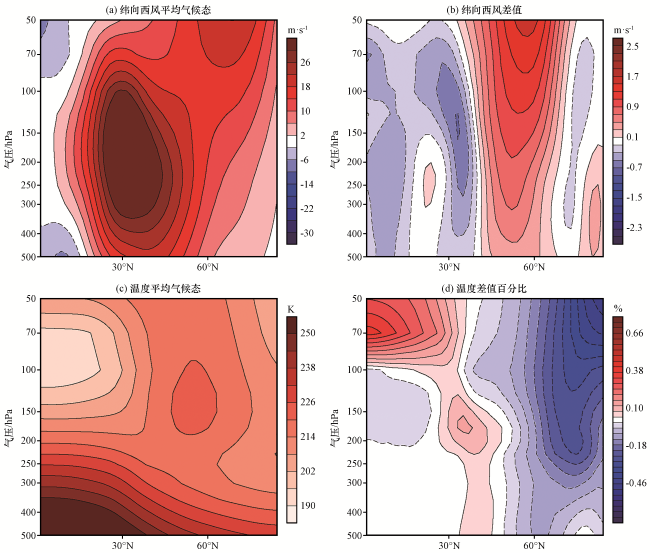
图6 E0试验北半球冬季纬向西风候态分布(a, 单位: m·s-1), E4试验与E0试验北半球冬季纬向西风差值(b, 单位: m·s-1),E0试验北半球冬季温度平均气候态(c, 单位: K)及E4试验与E0试验北半球冬季温度差值百分比(d, 单位: %)Fig.6 Climatological mean of the zonal westerly wind derived from E0 (a, unit: m·s-1), the differences in zonal westerlywind between E4 and E0 (b, unit: m·s-1), climatological mean of temperature derived from E0 (c, unit: K),the differences percentage in temperature between E4 and E0 (d, unit: %) |
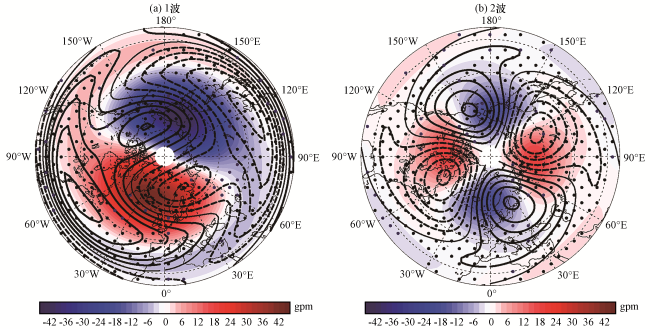
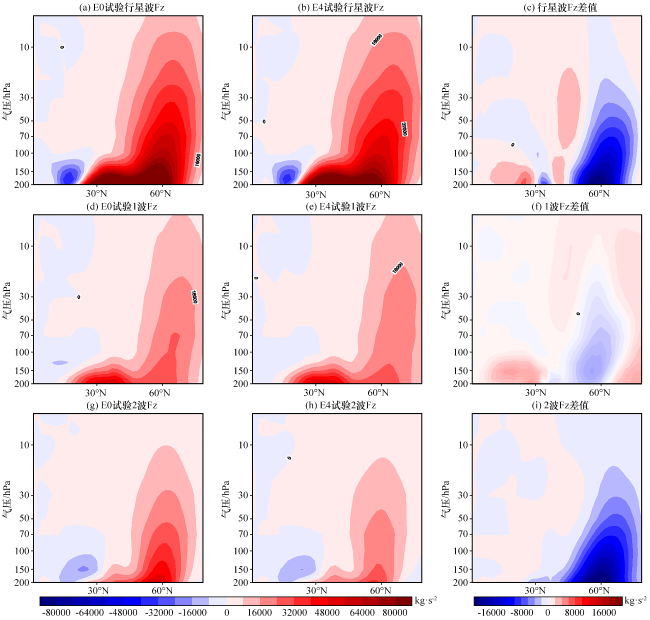
图7 冬季100 hPa E4试验与E0试验位势高度差值(彩色区, 单位: gpm)和E0试验中常年平均的位势高度气候平均态(等值线, 单位: gpm)分布实线、 虚线分别表示正、 负值, 等值线间隔为10 gpm; 打点区域为通过90% t检验置信水平区域 Fig.7 Differences of geopotential height component (color area, unit: gpm) between E4 and E0 and climatologicalmean of geopotential height component derived from E0 (contour, unit: gpm) at 100 hPa in winter.Positive andnegative contours are presented by the solid and dashed lines, respectively, and contour interval is 10 gpm.The dotted regions are statistically significant at the 90% confidence level according to Student’s t-test |