
1 引言
作为氧气(O2)的同素异形体, 臭氧(O3)是天然大气的重要微量成分, 约90%的O3存在于平流层, 仅10%左右的O3分布在对流层中(Pan et al, 2015)。平流层中的O3能够吸收紫外线, 保护人类与生态环境, 但O3是一种强氧化剂, 如果对流层大气中, 特别是近地面O3浓度增高, 则会引发城市光化学烟雾, 给人类健康和植物生长甚至生态环境造成严重危害(孔琴心等, 1999; 金明红等, 2003; Jiang et al, 2012)。近年来随着社会经济的快速发展和机动车保有量的激增, 中国城市O3污染问题愈发严重, 已引起了社会公众和学者们的广泛关注。
对流层臭氧的来源主要有两方面: 一是平流层臭氧通过平流层—对流层交换过程的向下输送(汪明圣等, 2017; 周天娇等, 2018; 焦铂洋等, 2017), 二是由氮氧化物(NOx=NO+NO2)、 一氧化碳(CO)和挥发性有机化合物(VOCs)等前体物在合适的气象条件下发生光化学反应产生(Wang et al, 2012)。因此, 前体物、 光化学反应速率、 扩散传输是影响局地臭氧浓度的三个主要因素(朱毓秀等, 1994), 而光化学反应速率和传输扩散与气象条件密切相关。研究表明, 辐射和温度决定着近地层光化学反应强度, 云量少、 气温高、 日照长、 湿度低有利于光化学反应的进行, 能够促进臭氧的生成(谈建国等, 2007; 丁国安等, 1995; Jia et al, 2014; Wang et al, 2016)。风向和风速影响近地层O3及其前体物的水平扩散, 小风速通常有利于局地O3浓度的累积, 同时O3浓度与风向的相关性也很大(赵辉等, 2016a)。
不同城市, 由于具有不同的气象条件及气候背景, 以及因不同经济发达程度、 产业结构、 机动车保有量等而形成的特有前体物排放特点, 使其臭氧污染特征及其与气象条件的关系也存在差异性。目前, 许多学者对我国不同地区臭氧污染进行了丰富的研究, 安俊琳等(2007)和王占山等(2014, 2018)研究发现北京定陵站臭氧浓度水平较市区其他监测点高, 各站点最高值均出现在6 -8月, 日变化呈单峰型, 峰值均在15:00(北京时, 下同) -16:00出现, 且温度对O3浓度的影响最大, 其次是气压和湿度。单源源等(2016)分析了2005 -2014 年长三角地区及其典型城市对流层O3柱浓度, 结果表明长三角地区对流层O3柱浓度最大值出现在3 -5 月, 高值区分布在长三角中部、 北部区域。谈建国等(2007)研究表明天气条件对上海臭氧形成具有明显的作用, 晴天少云, 紫外线辐射较强, 相对湿度较低, 气温较高, 地面和高空吹偏北风, 且风速较小时容易产生高浓度臭氧污染。齐冰等(2017)利用2012 -2016年杭州市近地面臭氧资料研究指出臭氧浓度冬季较低, 其余季节均较高, 超标时段主要出现在11:00 -18:00。刘建等(2017)统计分析发现2012年珠三角地区O3和NOx分别于10月和3月达到峰值, NOx对O3有显著的滴定作用, 当珠三角受偏西风控制时, 下风向地区的O3浓度最高, 而盛行偏北风时, 下风向地区的O3浓度最低。黄俊等(2018)研究得出2015年广州地区城郊的O3浓度高于中心城区, 当气温高于30 ℃时, O3浓度随温度升高增加明显, 当相对湿度大于60%时, O3浓度显著降低, 当气压小于1010 hPa时, 与气压呈负相关, 当气压大于1010 hPa时, 与气压呈正相关。吴锴等(2017)研究发现当紫外辐射大于12 MJ·m-2、 气温高于15 ℃、 相对湿度低于65%, 成都市容易发生高浓度O3污染。王闯等(2015)研究表明沈阳臭氧浓度受温度、 风速、 湿度、 能见度、 天气情况的影响, 是多因素共同作用的结果。以上研究大多是针对单个城市或区域的臭氧污染及其影响因素进行分析, 且多集中于京津冀、 长三角和珠三角等地区, 而对不同气候背景城市臭氧污染特征及其与气象条件关系的对比研究较少(赵辉等, 2016b)。
为此, 选取我国华北、 东北、 西北、 华东、 西南、 华南等不同气候带上典型代表性城市北京、 沈阳、 银川、 南京、 成都和广州, 开展不同气候背景城市臭氧污染的比较研究。选择这些典型城市是考虑到它们处于不同的地理位置, 气候特征、 地理分布、 海拔等有一定的代表性, 北京作为我国的首都, 地处华北中部, 属温带半干旱区, 气温、 湿度较低, 日照较长; 沈阳位于我国东北地区, 属温带半湿润区, 气温低, 湿度较高, 日照条件较好; 银川是西北部重要城市, 属于温带干旱区, 气温低, 空气干燥, 光照充足, 其气象条件代表着典型的西北地区气候; 南京地处我国华东地区, 属亚热带湿润区, 湿度高, 日照时数较短; 成都是我国西南地区的代表性城市, 温度、 湿度较高, 光照条件较差; 广州是华南代表性城市, 气温高, 湿度大, 日照少(郑景云等, 2013; 杨春宇等, 2017)。对比研究这6个典型代表性城市臭氧污染特征及其与气象条件关系的异同, 具有一定的普遍意义, 对于深入了解和掌握我国不同气候背景城市臭氧污染特性, 科学制定臭氧污染治理对策具有重要科学价值。
2 资料来源
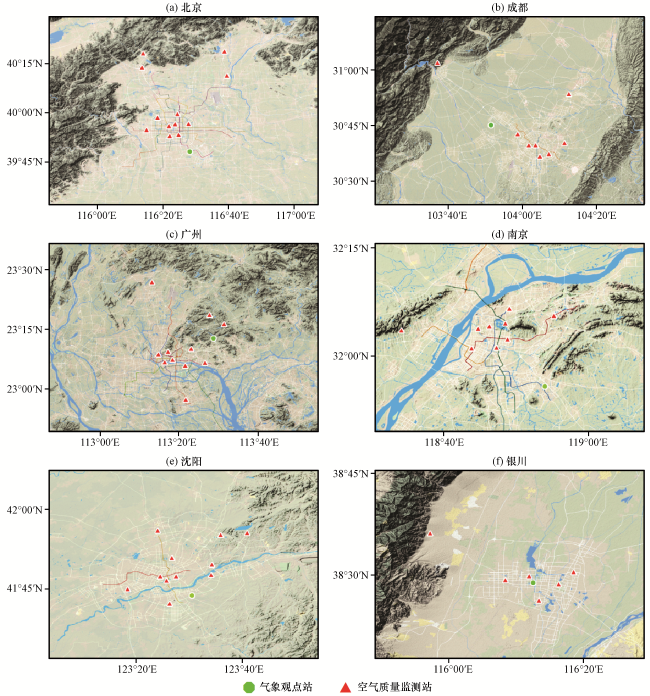
所用大气污染物数据为国家环境空气质量监测网发布的2014 -2016年北京、 成都、 广州、 南京、 沈阳和银川6个城市(图1)的环境监测国控点的O3的逐时质量浓度资料, 数据缺测率为9.6%。依据环境空气质量指数技术规定(HJ633-2012)和环境空气质量标准(GB3095-2012), 日平均浓度为01:00 -24:00时次平均值(数据有缺漏时, 以实际观测次数计算), 月平均值为全月日平均浓度的算术平均值, 年平均为一个日历年内各日平均浓度的算术平均值。同期各城市的逐日气温、 相对湿度、 风速、 日照时数等气象资料来源于国家气象信息中心。
3 结果与讨论
3.1 气象条件特征
表1给出了2014 -2016年各典型城市气象要素统计特征值。从表1中可以看出, 广州年平均气温最高, 为22.1 ℃, 其次是南京和成都, 分别为17.3 ℃和16.0 ℃, 北京和银川年平均气温分别为13.9 ℃和10.7 ℃, 沈阳年平均气温最低, 为8.9 ℃。南京年平均风速最大, 为2.5 m·s-1, 广州、 沈阳、 北京年平均风速相当, 分别为2.3 m·s-1, 2.2 m·s-1和2.1 m·s-1, 银川和成都年平均风速较小, 分别为1.7 m·s-1和1.3 m·s-1。成都、 广州年平均相对湿度较高, 分别达81%和80%, 南京稍低为74%, 沈阳年平均相对湿度62%, 北京和银川年平均相对湿度较低, 分别为53%和50%。广州年降水量最高, 达2704.8 mm, 其次是南京为1406.2 mm, 沈阳和成都年降水量分别为770.8 mm和705.9 mm, 北京和银川降水量较少, 分别为529.7 mm和220.4 mm。年日照时数银川最大, 为2609.3 h, 其次是北京和沈阳, 分别达2422.2 h和2417.5 h, 广州和南京年日照时数分别为1536.8 h和1523.1 h, 成都年日照时数最小, 仅658.4 h。
表1 2014 -2016年各典型城市气象要素特征值Table 1 Annual characteristic values of meteorological elements in typical cities during 2014 -2016 |
| 年平均气温/℃ | 年平均风速/(m·s-1) | 年平均相对湿度/% | 年降水量/mm | 年日照时数/h | |
|---|---|---|---|---|---|
| 北京 | 13.9 | 2.1 | 53 | 529.7 | 2422.2 |
| 成都 | 16.0 | 1.3 | 81 | 705.9 | 658.4 |
| 广州 | 22.1 | 2.3 | 80 | 2704.8 | 1523.1 |
| 南京 | 17.3 | 2.5 | 74 | 1406.2 | 1536.8 |
| 沈阳 | 8.9 | 2.2 | 62 | 770.8 | 2417.5 |
| 银川 | 10.7 | 1.7 | 50 | 220.4 | 2609.3 |
从总体气候特征来看, 广州为高温高湿中等日照时数, 南京为中等温度中等湿度中等日照时数, 成都为中等温度高湿度低日照时数, 北京和银川为中等温度低湿度长日照时数, 沈阳为低温中等湿度长日照时数。
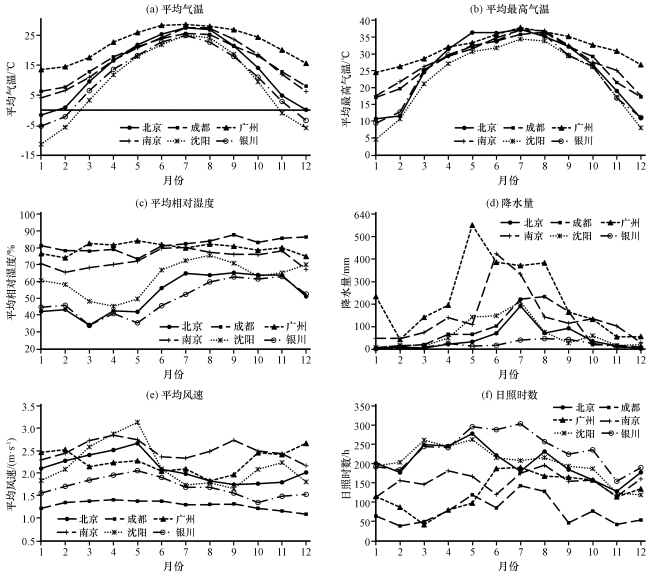
图2为2014 -2016年各典型城市气象要素月变化特征。由图2可知, 各典型城市平均气温和平均最高气温的月变化特征基本一致[图2(a), (b)], 均呈单峰型, 最高季节均为夏季, 但不同城市的气温年变幅有所差异, 从高到低的顺序依次为沈阳、 银川、 北京、 南京、 成都和广州。不同城市相对湿度月变化特征略有差异, 相对湿度最高的季节, 广州为春季, 南京和沈阳为夏季, 成都、 北京和银川为秋季; 相对湿度最低的季节, 广州和南京为冬季, 其他城市均为春季。北京、 沈阳、 银川相对湿度年变幅较高, 普遍在30%左右, 南京、 成都、 广州相对湿度年变幅较小, 均不超过15%[图2(c)]。6个城市降水量最大的季节均为夏季, 降水量次大季节有所差异, 广州和沈阳为春季, 其他城市为秋季, 降水量最小的季节均为冬季[图2(d)]。各城市平均风速月变化特征存在显著差异, 广州呈“U”型分布, 平均风速最大月为12月, 最小月为8月; 北京、 银川呈单峰型, 平均风速最大月均为5月, 最小月分别为9月和10月; 沈阳和南京呈双峰型, 最高峰分别出现在4月和5月, 次高峰分别为9月和11月; 成都平均风速明显低于其他城市, 且各月变化差异不大。平均风速年变幅从大到小的顺序为沈阳、 北京、 广州、 银川、 南京和成都[图2(e)]。不同城市日照时数月变化特征差异明显, 广州日照时数夏季最大, 春季最小; 北京、 南京、 沈阳日照时数春季最大, 秋季最小; 成都、 银川夏季日照时数最长, 冬季日照时数最短。北京日照时数年变幅最大, 其次是银川, 再次为广州, 之后为沈阳、 成都, 南京日照时数年变幅最小[图2(f)]。
3.2 不同城市臭氧浓度水平
分析2014 -2016年各城市臭氧浓度水平[图3(a)]可以看出, 臭氧年平均浓度最高的城市为南京, 达62.3 µg·m-3, 其次是沈阳, 为57.8 µg·m-3, 再次是北京, 为57.4 µg·m-3, 银川和成都较低, 分别为55.9 µg·m-3和52.5 µg·m-3, 广州年平均臭氧浓度最低, 为46.0 µg·m-3。从年际变化来看[图3(b)], 广州臭氧浓度呈下降趋势, 从2014年的48.1 µg·m-3下降到2015年的38.5 µg·m-3以及2016年的34.8 µg·m-3。沈阳臭氧年平均浓度变化不大, 2014, 2015和2016年分别为56.6, 57.5和56.9 µg·m-3。其他城市臭氧浓度总体都呈上升趋势, 其中, 北京增幅最小, 自2014年的55.9 µg·m-3增加至2016年的57.8 µg·m-3, 增幅为1.9 µg·m-3; 其次是成都, 从2014年的46.3 µg·m-3升高至2016年的55.1 µg·m-3; 再次是南京, 2016年为68.1 µg·m-3, 较2014年的56.4 µg·m-3增加了11.6 µg·m-3。银川是6个城市中臭氧浓度增加最显著的城市, 2014年仅48.5 µg·m-3, 2016年增高至67.2 µg·m-3, 增幅达18.7 µg·m-3。程麟钧等(2017)研究发现我国华南地区2014 -2016年臭氧日最大8 h浓度呈下降趋势, 与本文研究广州臭氧浓度降低的结论一致, 这表明广州近年来大气污染治理成效显著(湛社霞, 2018)。
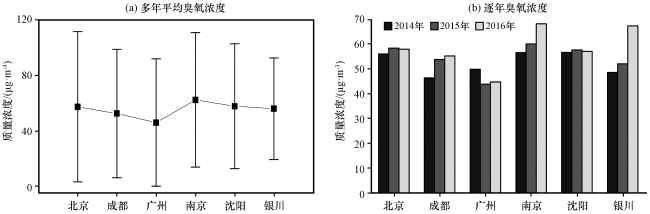
不同年份各城市臭氧浓度来看, 2014年臭氧浓度由高到低的顺序为沈阳>南京>北京>广州>银川>成都; 2015年为南京>北京>沈阳>成都>银川>广州; 2016年为南京>银川>北京>沈阳>成都>广州。
3.3 不同城市臭氧月变化特征
对不同城市郊区、 市区以及全市臭氧浓度月变化特征进行分析, 由图4可知, 北京[图4(a)]、 沈阳[图4(e)]、 银川[图4(f)]呈单峰变化特征, 臭氧浓度随时间变化先逐渐升高, 5 -7月间达到峰值(北京6月、 沈阳5月、 银川7月), 然后开始逐渐下降, 至11月或12月降至最低值。成都[图4(b)]和南京[图4(d)]表现为双峰变化特征, 臭氧浓度先上升, 至5月均达到第一峰值, 随后有所下降后又逐步回升, 成都于7月、 南京于9月分别达到第二峰值, 之后臭氧浓度再次下降, 分别于12月和次年1月降至最低。广州[图4(c)]呈三峰型变化特征, 全市臭氧浓度最高峰出现在8月, 为62.3 µg·m-3, 次高峰为10月的60.4 µg·m-3, 第三峰值出现在2月, 为40 µg·m-3, 一年中臭氧浓度最低的月份为3月(31.7 µg·m-3)。这表明臭氧浓度月变化受纬度影响较大, 纬度越高, 臭氧浓度的单峰结构越明显, 与段晓瞳等(2017)的研究结果一致。
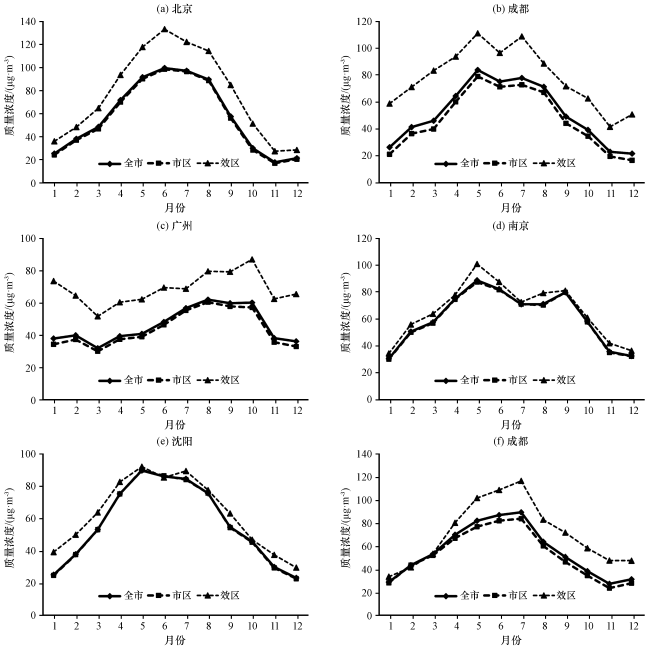
从不同季节来看, 除广州臭氧浓度由高到低依次为: 夏季>秋季>春季>冬季, 其他城市均为: 夏季>春季>秋季>冬季。这主要是由于夏季太阳辐射强、 气温高、 日照长, 光化学反应强烈, 利于臭氧生成。春季广州降水多、 日照条件差, 可能是造成广州春季光化反应弱, 臭氧浓度低于秋季的主要原因。其他城市春季臭氧较高, 可能是因为春季辐射渐强、 气温渐高, 有助于光化学反应生成臭氧, 加之春季风速较大, 有利于平流层或对流层上部高浓度臭氧向下输送(Kalabokas et al, 2017)。秋冬季辐射较弱、 气温较低、 日照时数较短不利于前体物光化学反应, 以及大气层结较稳定, 致使秋冬季臭氧浓度较低。另外, 有研究表明, 大气颗粒物浓度的升高会造成气溶胶光学厚度的增加, 从而抑制光化学过程, 导致大气氧化能力降低, 致使地面臭氧浓度下降(蔡彦枫等, 2013), 而冬季颗粒物污染严重(宋艳玲等, 2005; 严晓瑜等, 2015), 这可能也一定程度上使得冬季臭氧浓度较其他季节低。
3.4 不同城市臭氧日变化特征
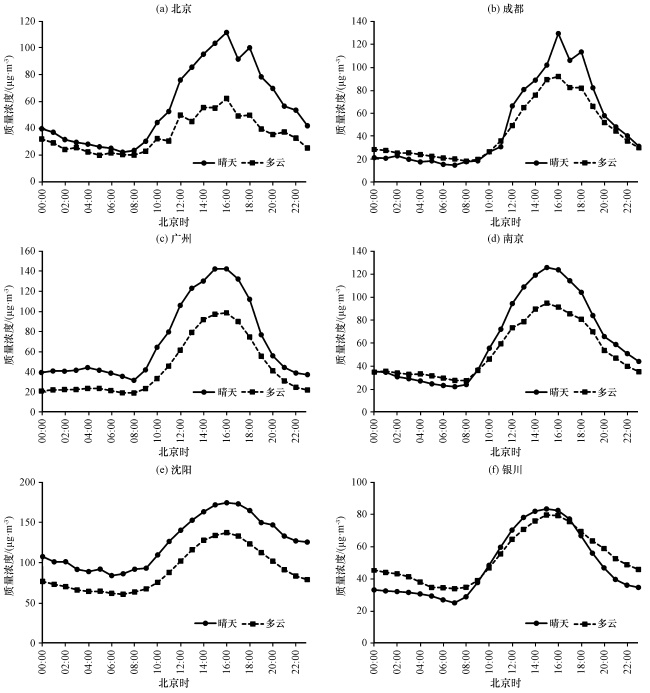
分析不同城市臭氧日变化特征, 发现各城市臭氧浓度日变化特征基本一致, 最小值普遍出现在07:00 -08:00, 随后迅速上升, 至15:00 -16:00臭氧浓度达到一天中的最大值, 然后开始逐渐下降。这主要是受前体物浓度、 光化学反应强度以及大气扩散能力共同作用而形成, 日出后由于交通出行等人类活动导致NO增加, 而O3会将NO氧化为NO2, 导致臭氧浓度较低, 但随着太阳辐射的增强, 大气光化学反应加剧, 臭氧浓度逐渐升高, 正午后, 太阳辐射强度逐渐减弱, 前体物光化反应减缓, 臭氧生成减少, 加之下班高峰期导致NO增加, 臭氧不断被消耗, 致使臭氧浓度在清晨达到最低值。臭氧最高值并未出现在12:00, 主要是由于NOx和VOCs等臭氧前体物经光化学反应转化为臭氧的滞后性所引起。各城市臭氧浓度峰值、 谷值及日变幅有明显差异, 北京[图5(a)]臭氧浓度日最高值为107.4 µg·m-3, 日最低值为25.4 µg·m-3, 日变幅达81.9 µg·m-3, 是6个城市中最大的。其次是广州[图5(c)], 峰值为101.2 µg·m-3, 谷值为19.9 µg·m-3, 日变幅达81.3 µg·m-3。成都[图5(b)]、 南京[图5(d)]臭氧浓度日变幅相对较低, 分别为80.1 µg·m-3和78.5 µg·m-3。银川[图5(f)]、 沈阳[图5(e)]臭氧浓度日最高值分别为89.2 µg·m-3和99.2 µg·m-3, 日最低值分别为32.2 µg·m-3和31 µg·m-3, 日变幅分别为57.0 µg·m-3和68.2 µg·m-3, 是6个城市中最低的两个。
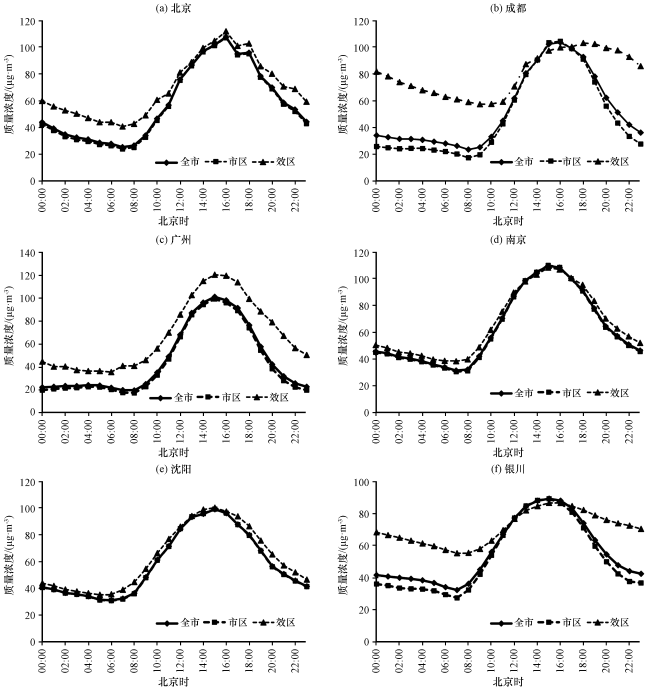
不同城市郊区和市区臭氧浓度日变化特征相似。值得注意的是, 广州郊区臭氧浓度白天和夜间都明显高于市区, 其他城市则与此不同, 11:00 -17:00郊区与市区臭氧浓度差别较小, 且北京、 沈阳郊区峰值浓度较市区高, 而成都、 南京、 银川则为略低于市区, 但其余时段郊区臭氧浓度普遍明显高于市区, 特别是成都和银川。已有研究指出, 臭氧的日循环主要分为4 个阶段(Fujita et al, 2003): 臭氧及其前体物的前夜累积阶段、 清晨NOx大量排放的臭氧抑制阶段、 臭氧光化学生成阶段、 臭氧消耗阶段。11:00 -17:00郊区与市区臭氧浓度差值较小, 推断其原因可能是该时段为臭氧光化学生成阶段, 城区由于机动车排放大量NOx, 对臭氧形成滴定作用, 而郊区虽然自然源排放VOCS较高, 但NOx浓度较低, 限制了臭氧的生成, 最终导致城区和郊区臭氧峰值差异较小; 夜间则主要是城区NOx浓度较高, 臭氧受大气光化学反应的消耗较强, 使得城区臭氧浓度较郊区低。广州夜间郊区臭氧浓度较城区高可能是由于城区高浓度的NOx随风扩散至郊区, 在郊区与VOCS反应造成臭氧浓度较高。尽管如此, 郊区与城区臭氧浓度差异的昼夜变化的原因还有待进一步研究。
3.5 不同城市臭氧与气象条件关系
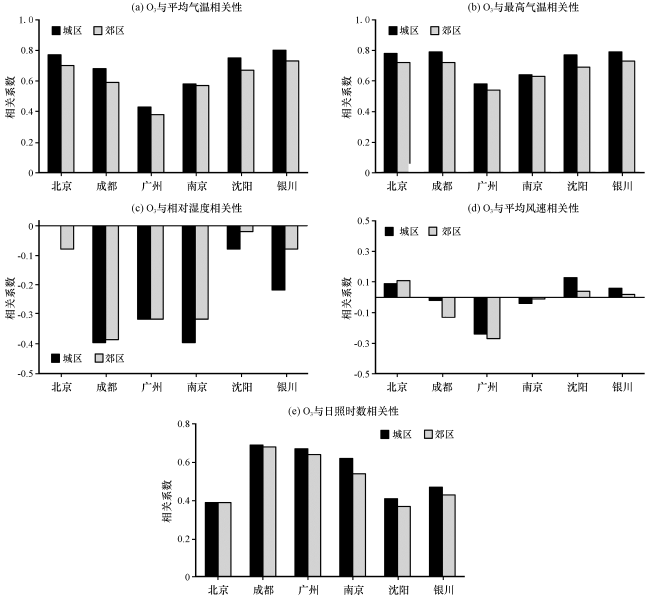
探讨不同城市臭氧与气象条件关系(图7), 可以看出, 北京臭氧与最高气温相关性最好, 相关系数为0.78, 其次是与平均气温, 相关系数为0.76, 再次是与日照时数, 相关系数为0.39, 与风速相关性较低, 相关系数为0.09, 与相对湿度呈弱的负相关。成都臭氧与平均气温间的相关系数最大, 为0.76, 其次是与日照时数间的相关系数, 为0.7, 与最高气温的相关性也较好, 相关系数为0.68, 与相对湿度呈负相关, 相关系数为-0.41, 与风速呈弱的负相关。广州臭氧与日照时数关系最密切, 相关系数为0.68, 其次是与最高气温, 相关系数为0.58, 再次是平均气温, 相关系数为0.43, 与相对湿度和风速均为负相关, 相关系数分别为-0.32和-0.24。南京臭氧浓度受气温和日照影响最大, 与最高气温、 日照时数、 平均气温的相关系数分别为0.64, 0.62和0.58, 其次是相对湿度, 相关系数为-0.4, 受风速影响较小, 相关系数为-0.03。沈阳臭氧浓度变化对气温变化最敏感, 与最高气温和平均气温的相关系数分别为0.78和0.75, 其次是日照时数, 相关系数为0.41, 再次是风速, 相关系数为0.12, 对相对湿度变化最不敏感。银川臭氧浓度受气温影响最明显, 与最高气温和平均气温的相关系数分别为0.74和0.73, 其次是日照时数, 相关系数为0.54, 与相对湿度的相关系数为-0.26, 与风速相关系数为0.11。
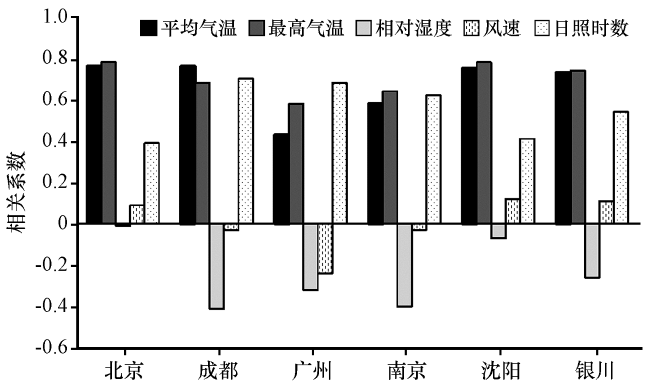
总体来看, 各城市臭氧质量浓度与气温和日照呈较强正相关, 且受最高气温影响最大, 其次是平均气温, 再次是日照时数, 与相对湿度呈较弱负相关, 与风速相关性最弱, 且正负随城市变化而有所差异。比较而言, 具有长日照气候特征的北京、 银川和沈阳的臭氧浓度对气温的变化较其他城市更敏感, 且与风速呈弱的正相关, 而气温、 湿度较高的广州、 南京和成都的臭氧浓度与日照时数和相对湿度的相关性较其他3个城市高, 且与风速呈弱的负相关。
进一步对不同季节各城市臭氧与气温、 相对湿度、 日照时数和风速相关性进行分析, 发现不同城市各季节臭氧与气温均呈正相关[图8(a), (b)], 且除广州臭氧与气温相关性最高的季节为夏季, 其次为秋季外, 其他城市臭氧与气温相关性最强的季节普遍为春季, 其次是秋季, 再次是夏季。6个城市冬季臭氧与气温的相关性均是四季中最低的。
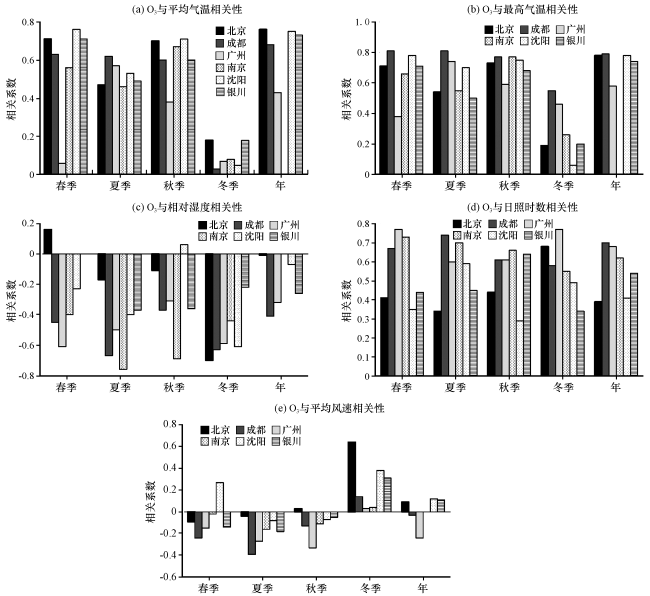
四季各城市臭氧与相对湿度普遍呈负相关关系[图8(c)], 整体来看, 冬季臭氧与相对湿度相关性最好, 其次是夏季, 再次是秋季, 春季最差。比较而言, 广州春季臭氧与相对湿度相关性较其他季节好, 北京和沈阳冬季臭氧与相对湿度相关系数是四季中最高的, 成都、 南京和银川则是夏季臭氧对相对湿度较其他季节敏感。臭氧与相对湿度相关性最低的季节, 北京、 成都、 广州和沈阳为秋季, 南京和银川为春季。值得注意的是, 北京春季臭氧与相对湿度呈正相关, 这可能是因为北京春季风力较大, 且植被覆盖率低, 容易引起沙尘, PM10浓度相应较高(谢志英等, 2015), 而相对湿度高有助于增强对颗粒物的湿清除作用, 致使PM10浓度降低, 从而增加了到达近地面的辐射(邵振艳等, 2009), 使光化学反应增强, 有利于臭氧的生成。
不同城市四季臭氧与日照时数均呈显著正相关[图8(d)], 总体来讲, 夏季臭氧与日照时数相关性最好, 其次是春季和冬季, 秋季最差。不同城市而言, 北京冬季臭氧与日照时数相关性明显较其他季节高, 成都和南京春、 夏、 秋三季臭氧与日照时数相关性较好, 广州春、 冬季两者相关性较夏、 秋季好, 沈阳夏季臭氧与日照时数相关系数是四季中最大的, 银川则为秋季。
分析各典型城市不同季节不同风向下臭氧浓度差异, 可以看出北京春、 夏、 秋三季风向为S、 SSE、 SSW时, 臭氧浓度最高, 这与来自河北、 天津等地的输送以及北京西面太行山和北面燕山的地形阻挡作用有关(Duan et al, 2008)。北京冬季风向为NNW时臭氧浓度最高[图9(a)]。
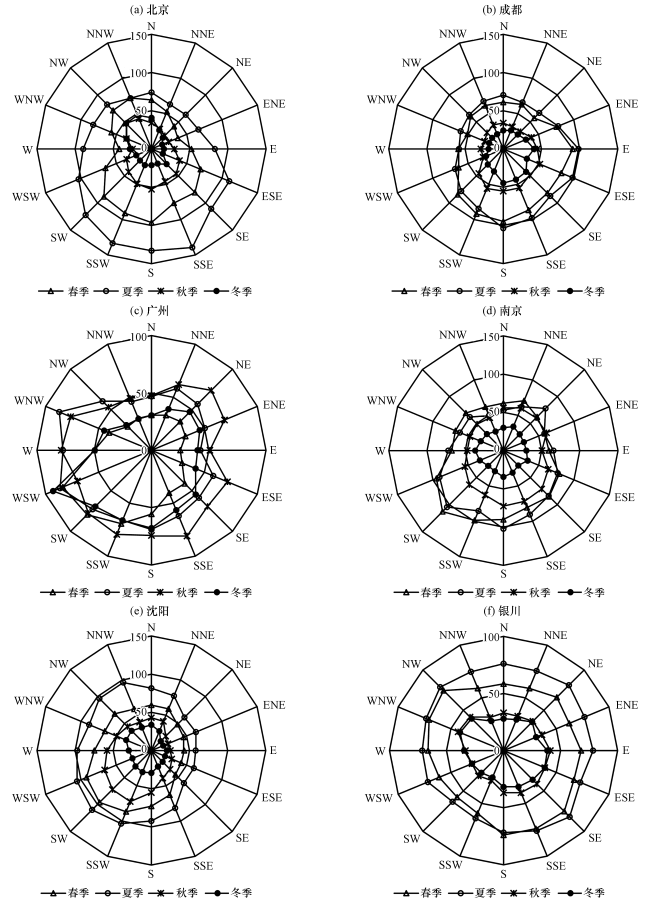
春季和夏季吹西南风时南京臭氧浓度较高, 秋季吹东南风时南京臭氧浓度较高, 春、 夏、 秋三季吹偏北风时南京臭氧浓度普遍较低。冬季臭氧浓度随风向变化差异较小, 比较而言, 吹西风时, 臭氧浓度相对较高[图9(d)]。
吹偏西风时, 沈阳四季臭氧浓度均显著高于其他方位[图9(e)], 这可能是由于沈阳市最重要的一类臭氧前体物VOCS主要分布在城市的西南部(刘雅婷等, 2011), 同时, 与沈阳东部为低山丘陵, 中西部是辽阔平原的地形特征也有一定关系。
银川春、 秋、 冬三季西北风向上臭氧浓度较其他风向上高[图9(f)]。夏季吹东南风时银川臭氧浓度最高, 可能是由于银川市东南地区是以煤炭、 电力、 煤化工三大产业为支撑的宁东重化工基地, 西侧为贺兰山, 远距离输送和地形的阻挡作用共同造成夏季东南风向下臭氧浓度较高(严晓瑜等, 2015)。
对不同城市郊区、 市区臭氧浓度与气象条件的关系进行分析, 发现各城市城区臭氧浓度与平均气温和最高气温的相关性均较郊区的好[图10(a), (b)], 表明城区臭氧浓度随气温升高增加的更快。臭氧浓度与相对湿度相关性, 除北京城区较郊区差, 广州城区与郊区相当外, 其他城市均为城区好于郊区[图10(c)]。臭氧浓度与平均风速相关性, 北京、 成都和广州为城区较郊区差, 南京、 沈阳和银川则为城区好于郊区[图10(d)]。臭氧浓度与日照时数相关系数, 北京和成都城区与郊区相等, 其他城市城区大于郊区[图10(e)]。总体来讲, 城区臭氧浓度与气象条件的关系较郊区的密切, 这可能是由于其处于不同的臭氧前体物控制区(王占山等, 2018), 具体原因还有待进一步研究。
4 讨论与结论
4.1 讨论
臭氧浓度月变化特征广州呈近似三峰型, 成都和南京为双峰型, 北京、 沈阳、 银川呈单峰型, 这可能是由于不同城市影响臭氧变化的主控气象因子不同而造成的。对于北京、 沈阳、 银川而言, 温度与臭氧相关性较好, 是影响臭氧变化的最主要气象要素, 春夏季辐射增强气温升高, 臭氧浓度随之增加, 秋冬季辐射减弱气温下降, 臭氧浓度随之减小, 因而呈单峰型变化特征; 南京、 成都臭氧与气温和日照时数的相关系数均较高, 春季随气温升高, 日照变长, 臭氧浓度于5月达到一年中的最大值; 随后虽然气温较高, 但降水增多, 日照条件变差, 致使臭氧浓度略有下降; 进入秋季后, 降水减少, 日照条件变好, 臭氧浓度再次增加出现第二峰值; 对广州而言, 3 -5月阴雨寡照, 气温低(黄俊等, 2018), 不利于臭氧形成, 致使3月臭氧浓度最低; 6 -8月太阳辐射增强, 日照时数增加, 气温较高, 利用臭氧生成, 臭氧浓度逐渐增加, 于8月达到最大值; 由于位于亚热带低纬度地区, 9月和10月广州太阳辐射仍较强, 同时受边界层条件影响(吴蒙等, 2015), 臭氧浓度于10 月达到次高峰; 11月和12月辐射减弱, 日照减少, 臭氧浓度逐渐降低; 1月和2月太阳辐射逐渐增强, 气温回升, 加之干季湿度较小, 臭氧浓度略有增加。
全年来看, 北京、 沈阳和银川臭氧浓度与风速呈正相关, 不同季节来看, 冬季各城市风速与臭氧都呈正相关, 而春、 夏、 秋三季则普遍呈负相关。这表明, 北京、 银川、 沈阳年风速与臭氧呈正相关主要是由于冬季臭氧浓度随风速增大而增加造成的。这可能是因为春、夏、秋季臭氧浓度主要是受局地光化学反应控制, 对气温、 湿度和辐射的影响较敏感, 而风速对其生成的影响不大, 到了冬季, 光化学反应减弱, 远距离输送和上层臭氧向下传输的贡献相对增加, 从而使得臭氧浓度与风速呈正相关(王男, 2015; 刘姝岩等, 2018)。另一方面可能是由于冬季雾霾严重, 而强冷空气的到来可以有效清除雾霾, 从而增加到达地面的辐射, 有利于增强光化学反应, 致使臭氧浓度较低风速时大。
4.2 结论
(1) 2014 -2016年3年间臭氧年平均浓度由高到低的顺序为: 南京>沈阳>北京>银川>成都>广州, 3年间广州臭氧浓度呈下降趋势, 沈阳变化不大, 其他城市总体呈上升趋势, 其中, 银川增加最显著, 北京增幅较小。
(2) 各典型城市臭氧浓度月变化特征存在差异, 广州为近似三峰型, 成都和南京为双峰型, 北京、 沈阳、 银川为单峰型; 日变化均为单峰型, 最大值普遍出现在15:00 -16:00, 最小值普遍出现在07:00 -08:00。
(3) 影响各典型城市臭氧浓度变化最重要的气象要素为气温和日照时数, 其次是相对湿度, 再次是风速。对于日照时间较长的北京、 银川和沈阳, 臭氧对气温的变化更敏感, 且臭氧与风速呈弱的正相关; 对于气温、 湿度较高的广州、 南京和成都, 臭氧与日照时数和相对湿度间的相关性较其他3个城市好, 且臭氧与风速呈弱的负相关。
(4) 不同季节来看, 各城市臭氧与气温相关性冬季较弱, 其他季节均呈显著正相关; 与相对湿度相关性最好的季节为冬季, 其次是夏季, 再次是秋季, 春季最差; 与风速春、 夏、 秋三季为负相关, 冬季为正相关; 与日照时数相关性最强的季节为夏季, 其次是春季和冬季, 秋季最弱。
(5) 不同城市郊区臭氧浓度均高于市区, 两者差异由大到小依次为成都>广州>北京>银川>沈阳>南京。各城市郊区与市区臭氧浓度日变化曲线相似, 但两者浓度差随时间变化有所不同, 广州郊区臭氧浓度全天都显著高于市区, 其他城市11:00 -17:00郊区与市区差别较小, 成都、 南京、 银川郊区峰值浓度甚至略低于市区, 其余时段郊区明显高于市区。各城市城区臭氧与气象要素相关性均较郊区好, 对气象条件变化较郊区更敏感。