
1 引言
2 资料选取与方法介绍
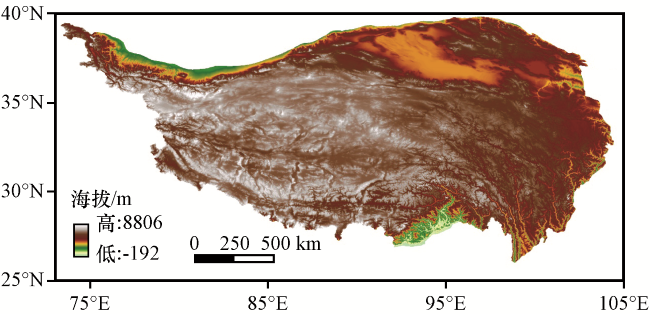
2.1 研究区域与资料选取
2.2 QIBT模型
2.3 试验设计
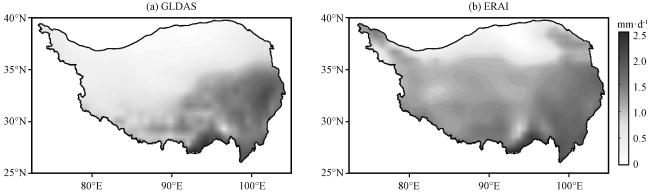
表2 青藏高原平均2001年GLDAS、 ERA-Interim蒸发量以及ERA-Interim相对于GLDAS的相对误差Table 2 Monthly evaporation in 2001 for GLDAS and ERA-Interim over the QTP, and the bias in percentage for ERA-Interim compared with GLDAS |
| 月份 | 1 | 2 | 3 | 4 | 5 | 6 | 7 | 8 | 9 | 10 | 11 | 12 | 年平均 |
|---|---|---|---|---|---|---|---|---|---|---|---|---|---|
| GLDAS/(mm·d-1) | 0.20 | 0.27 | 0.43 | 0.59 | 0.98 | 1.33 | 1.79 | 1.70 | 1.33 | 0.77 | 0.43 | 0.20 | 0.84 |
| ERAI/(mm·d-1) | 0.23 | 0.34 | 0.57 | 1.19 | 1.67 | 2.01 | 2.41 | 2.18 | 1.72 | 1.01 | 0.38 | 0.23 | 1.16 |
| 相对误差 | 16% | 25% | 32% | 103% | 71% | 51% | 35% | 28% | 29% | 31% | -12% | 13% | 39% |
表3 青藏高原2001年、 极端干年和极端湿年的月平均降水量以及极端湿/干年相对于2001年的百分比变化Table 3 Monthly precipitation in 2001, extreme wet and extreme dry year over the QTP, and the relative change when the monthly precipitation in normal precipitation year (2001) is replaced with the monthly precipitation in extreme wet and extreme dry year |
| 月份 | 1 | 2 | 3 | 4 | 5 | 6 | 7 | 8 | 9 | 10 | 11 | 12 | 年平均 |
|---|---|---|---|---|---|---|---|---|---|---|---|---|---|
| 2001年/(mm·d-1) | 0.37 | 0.68 | 1.09 | 2.50 | 3.34 | 4.41 | 4.29 | 4.46 | 3.06 | 1.54 | 0.47 | 0.32 | 2.21 |
| 极端湿年/(mm·d-1) | 0.81 | 1.25 | 1.78 | 2.60 | 3.77 | 5.51 | 5.96 | 6.15 | 3.73 | 2.05 | 0.80 | 0.49 | 2.91 |
| 百分比变化/% | 120 | 84 | 63 | 4 | 13 | 25 | 39 | 38 | 22 | 33 | 71 | 53 | 47 |
| 极端干年/(mm·d-1) | 0.17 | 0.41 | 0.87 | 1.60 | 2.64 | 3.40 | 3.69 | 2.99 | 2.51 | 1.06 | 0.20 | 0.11 | 1.64 |
| 百分比变化/% | -55 | -40 | -20 | -36 | -21 | -23 | -14 | -33 | -18 | -31 | -58 | -67 | -35 |
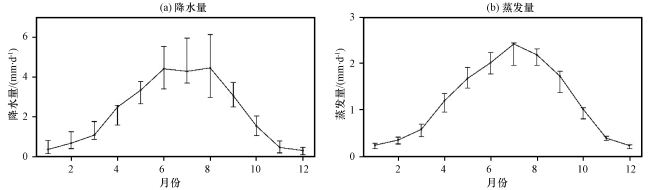
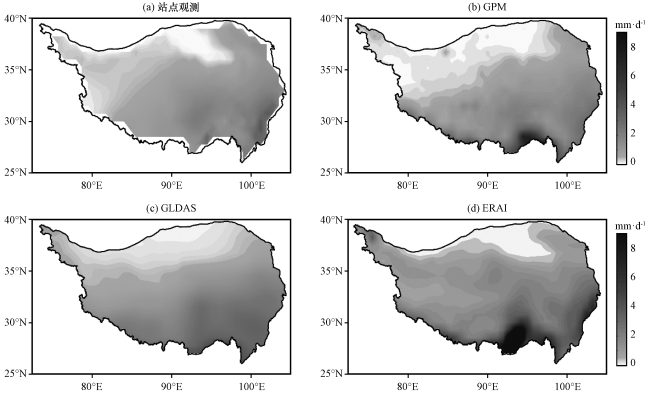
表1 青藏高原2001年GLDAS、 ERA-Interim平均降水量以及ERA-Interim相对于GLDAS的相对误差Table 1 Monthly precipitation in 2001 for GLDAS and ERA-Interim over the Qinghai-Tibetan Plateau (QTP), and the bias in percentage for ERA-Interim compared with GLDAS (QTP) |
| 月份 | 1 | 2 | 3 | 4 | 5 | 6 | 7 | 8 | 9 | 10 | 11 | 12 | 年平均 |
|---|---|---|---|---|---|---|---|---|---|---|---|---|---|
| GLDAS/(mm·d-1) | 0.15 | 0.29 | 0.44 | 0.93 | 1.84 | 3.13 | 3.19 | 3.06 | 2.34 | 0.81 | 0.19 | 0.11 | 1.37 |
| ERAI/(mm·d-1) | 0.37 | 0.68 | 1.09 | 2.50 | 3.34 | 4.41 | 4.29 | 4.46 | 3.06 | 1.54 | 0.47 | 0.32 | 2.21 |
| 相对误差 | 147% | 135% | 148% | 170% | 81% | 41% | 35% | 46% | 31% | 91% | 145% | 192% | 61% |
表4 青藏高原2001年、 极端干年和极端湿年的月平均蒸发量以及极端湿/干年相对于2001年的百分比变化Table 4 Monthly evaporation in 2001, extreme wet and extreme dry year over the QTP, and the relative change when the monthly evaporation in 2001 is replaced with the monthly evaporation in extreme wet and extreme dry year |
| 月份 | 1 | 2 | 3 | 4 | 5 | 6 | 7 | 8 | 9 | 10 | 11 | 12 | 年平均 |
|---|---|---|---|---|---|---|---|---|---|---|---|---|---|
| 2001年/(mm·d-1) | 0.23 | 0.34 | 0.57 | 1.19 | 1.67 | 2.01 | 2.41 | 2.18 | 1.72 | 1.01 | 0.38 | 0.23 | 1.16 |
| 极端湿年/(mm·d-1) | 0.27 | 0.40 | 0.68 | 1.36 | 1.90 | 2.23 | 2.43 | 2.31 | 1.82 | 1.04 | 0.42 | 0.25 | 1.26 |
| 百分比变化/% | 17 | 19 | 20 | 14 | 14 | 11 | 1 | 6 | 6 | 3 | 10 | 7 | 11 |
| 极端干年/(mm·d-1) | 0.16 | 0.26 | 0.41 | 0.95 | 1.47 | 1.77 | 1.95 | 1.96 | 1.38 | 0.80 | 0.33 | 0.17 | 0.97 |
| 百分比变化/% | -30 | -25 | -28 | -20 | -12 | -12 | -19 | -10 | -20 | -21 | -14 | -28 | -20 |