

1 引言
大气湍流引起各物理量的垂直输送, 不仅对天气现象的发生发展和演变过程具有重要影响, 而且与大气环境和空气污染问题息息相关。相关边界层参量是表征地气之间物质和能量交换过程的重要参数, 是研究地气系统物质循环和大气污染预测等问题迫切需要的关键输入参数, 是地表和大气相互作用研究的核心, 是全球变化研究的重要组成部分(叶笃正等, 2003)。研究边界层特征对分析污染物扩散条件, 认识地气间物质、 能量的输送交换机制和提高数值模式的模拟能力具有重要意义。
黄土高原半干旱区位于半湿润和干旱气候的过渡带, 对气候变化敏感。研究黄土高原半干旱区的地气交换特征, 对研究生态系统对气候变化的响应和区域气候模式在该地区的陆面参数化方案、 揭示气候变化背景下的区域干早化特征, 研究人类活动对区域乃至全球的影响都有重要的科学意义。然而黄土高原半干旱区下垫面不均匀性明显, 边界层特征复杂, 制约了人们对此地区地表过程和大气相互作用的理解。为此, 通过深入研究该地区的边界层特征, 有利于正确理解其在地气之间的物质和能量输送。
近年来, 在边界层结构和特征方面开展了大量研究, 并取得突出进展。“第二次青藏高原实验(TIPEX)”为青藏高原复杂地形上地气交换研究提供了重要数据(马耀明等, 2006); 在大涡模拟和印痕模型(Cai et al, 2006, 2007)、 不同时空尺度的大气边界层与陆面物理过程模式构建(刘树华等, 2013)等方面也取得了重要成果。关于黄土高原地区边界层研究, 2000 -2004年在甘肃和青海干旱高寒区进行了“西北干旱区陆气相互作用野外观测试验(NWC-ALIEX)”, 获得了地表能量平衡、 湍流通量参数化和地表水分循环等方面新的认识(张强等, 2008); 陈星等(2016)利用陇东平凉陆面过程与灾害天气观测站(平凉站)的陆面过程观测资料分析了土壤含水量和能量通量的季节变化, 通过研究降水、 土壤含水量对能量分配的影响, 得出地表能量分配在很大程度上受降水影响的结论。黄倩等(2014)应用英国气象局的大涡模式, 模拟了对流边界层的发展以及示踪物从混合层向残留层传输的时空变化。Yue et al(2015)利用兰州大学半干旱气候与环境观测站(Semi-Arid Climate and Environment Observatory of Lanzhou University, SACOL)资料分析了近地层湍流温、 湿统计特征。程海艳等(2018)利用平凉站加强观测期的探空资料验证了大气红外探测器的反演产品在黄土高原地区的适用性并分析了边界层高度的单站特征。
以往对边界层湍流的研究主要是通过获取观测资料, 由湍流理论求得观测站的单点特征量, 然而目前全球通量观测网中只有800多个测站(Lawrence Berkeley National Laboratory, 2018), 分布在黄土高原地区的通量观测站十分稀少。受限于目前许多地区通量观测资料难以获取、 观测时间较短、 时空分辨率较低的现状, 现有研究结果的区域代表性较欠缺, 无法了解边界层的空间分布结构, 因而对黄土高原大气边界层空间特征的研究仍需进一步深入。
使用数值模拟手段可以部分弥补这方面的缺陷, 对黄土高原地区较大范围大气边界层特征进行定量分析。已有工作验证了利用中尺度气象模式The Weather Research and Forecasting Model(WRF)能较好地模拟边界层结构(Zhang et al, 2009; Hu et al, 2010; Shin et al, 2011), 在黄土高原地区的数值模拟(Ma et al, 2011; 孙学金等, 2017; 周旭等, 2017)也表明WRF模式在复杂地形上有较好的模拟能力, 模拟结果可以较为真实地反映大气状态。
综上所述, 目前对大气边界层的研究主要基于观测资料和中尺度数值模拟, 虽然取得了明显进展, 但仍存在很多问题, 如黄土高原地区的湍流资料空间分辨率低, 难以描述湍流的精细空间结构; 关于大气边界层风速、 气温、 边界层高度等基本结构的研究大多局限于单个站点, 对大气边界层空间分布特征需要进一步开展研究。针对这些问题, 本文将中尺度气象模式WRF与大涡模式WRF Large-Eddy Simulation(WRF-LES)嵌套使用, 在黄土高原地区3 km×3 km范围内进行高分辨率的大气边界层湍流场模拟, 并在模拟区选定的参数化方案下, 采用夏季实际粗糙度0.062 m替换模式默认粗糙度0.1 m, 以提高WRF-LES的模拟能力。
2 数据来源与方法介绍
2.1 模式方案
大涡模式具有极高的格点分辨率和对边界层湍流的三维模拟能力, 这些特点使它非常适用于各类中小尺度物理过程的研究(Zhu, 2008), 在对流边界层研究方面取得了很好的效果。大涡模拟的基本思想是将大涡与小涡分开处理, 使用统一的模型计算小涡, 而精确求解某个尺度以上的所有湍流运动(Wang et al, 2009; Liu et al, 2011; Talbot et al, 2012)。Deardorff(1972)首次将大涡模拟应用于边界层研究, 其优势在于具有高分辨率, 能更好地模拟边界层湍流和能量输送的空间结构特征。20世纪90年代初, 大涡模拟开始用于非均匀性的影响研究(Gopalakrishnan et al, 2000; 蔡旭晖等, 2000; Cécé et al, 2016; Rai et al, 2017), 取得了很好的结果。WRF模式是NCAR、 NCEP和NOAA等多个部门共同开发的新一代高分辨率中尺度气象模式和资料同化系统, 它适用于水平分辨率为1~10 km的天气预报和模拟问题, 可为大涡模式提供所需的气象要素廓线, 文中使用的是WRFV3.5.1版本。
本文主要研究对流边界层特征, 根据Pasquill的稳定度分级方法, 定义地面风速在2~3 m·s-1范围内, 且日照程度为中或强的情形为不稳定边界层。参考榆中县气象站(站号52983)的MICAPS观测资料选出总云量小于等于一成的日期, 再结合SACOL边界层梯度塔观测资料, 从这些典型晴天中筛选出符合上述风速范围对应的时刻, 得知2007年8月13日10:00(北京时, 下同), 地面风速是2.6 m·s-1, 为不稳定边界层。
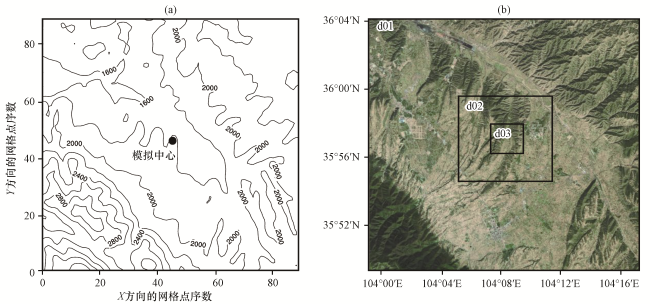
使用WRF模式进行三重双向嵌套模拟, 模拟时段为2007年8月12日01:00至14日01:00, 共48 h, 三层嵌套网格的时间步长分别取9 s, 3 s, 1 s。WRF-LES从2007年8月13日10:00开始共模拟12 h, 以保证足够的模式张弛计算, 积分步长取0.1 s。全部模拟域的中心均位于SACOL(35.946°N, 104.137°E), WRF模式三层网格均为13×13格点, 覆盖区域依次为27 km×27 km、 9 km×9 km和3 km×3 km, 最内层网格的水平分辨率为250 m。WRF-LES的模拟范围是WRF的最内层模拟域, 即图1(b)中d03区域, 水平方向加密为151×151格点, 水平网格分辨率提高至20 m。WRF模式采用地形追随η坐标系, 垂直方向分为38层, WRF-LES垂直方向分为50层。WRF模式初始场使用NCEP再分析资料(6 h, 1°×1°), 并配套采用NCEP提供的全球30 s高分辨率地形资料。将33 h模式张弛计算后的WRF模式最内层模拟结果输入WRF-LES作为初始场, 继续进行高精度的湍流场模拟。WRF-LES模拟的d03区域地形变化不明显, 且本文主要考虑黄土高原夏季热力状况影响下的边界层特征, 未在大涡模拟中单独加入地形。模式模拟区域所处的地形高度和嵌套网格分布见图1。
粗糙度很大程度决定着机械湍流交换动量的效率和强度, 也直接影响大气边界层的结构变化。陈世强等(2013)研究发现, 粗糙度对陆面过程的影响远大于导热率、 地表反照率和热容等参数。在模式中输入当地实际粗糙度参数, 有利于提高模式的模拟效果。张文煜等(2009)利用SACOL 2007年4月至2008年4月的观测资料计算得出该地区夏季粗糙度为0.062 m, 研究区域及时间范围与本文模拟试验一致, 可以真实反映模拟时段内的小尺度陆面特征。为了给WRF-LES提供最贴近真实大气状况的初始场, 用此粗糙度参数替换模式默认值0.1 m后进行模拟(将此试验方案简称为“WRF-Z0LES”)。在前人研究的基础上选择经过验证、 在本地区模拟效果较好的WRF物理参数化方案(表1)。
表1 模式物理参数化方案Table 1 Physical parameterization schemes |
| 模式 | 物理参数化方案 |
|---|---|
| WRF | WSM 3类简单冰微物理过程方案 Monin-Obukhov近地面层方案 RRTM长波辐射方案 Dudhia短波辐射方案 YSU边界层方案 Noah陆面过程方案 |
| WRF-LES | Monin-Obukhov近地面层方案 三维1.5阶TKE(湍流动能)闭合方案 Deardorff的TKE方案 |
2.2 WRF模拟结果验证
利用国际上广泛使用的美国怀俄明大学网站提供的全球探空站实测数据(榆中站, 站号52983)验证WRF模式模拟结果的可靠性, 对比了WRF模式模拟和榆中探空站实测的2007年8月13日08:00温度、 水汽混合比和风速廓线。将WRF模式模拟结果线性插值到榆中探空资料的各层高度上, 对各层处于相同高度的WRF模式模拟结果和全球探空资料做相关性分析和定量统计分析, 得到WRF模式模拟的温度、 水汽混合比和风速与实测资料的定量化差异(表2)。模拟和观测的温度、 水汽混合比和风速廓线的相关系数分别为0.998, 0.994和0.979, 三组相关系数均通过了0.05显著性水平的双尾t检验。WRF模拟结果和实测廓线非常一致, 且极大提高了各要素廓线在低层的垂直分辨率, 更加满足大涡模拟的输入需求。
表2 WRF模式模拟结果与探空廓线的比较分析Table 2 Comparative analysis of WRF simulation results and sounding profiles |
| 物理量 | 数据量 | 平均值 | 平均偏差 | 相对偏差/% | 标准差 | |
|---|---|---|---|---|---|---|
| 温度/K | WRF | 35 | 243.394 | 24.894 | 10.228 | 30.485 |
| 榆中探空 | 18 | 243.833 | 23.407 | 9.600 | 28.643 | |
| 水汽混合比/(g·kg-1) | WRF | 35 | 1.873 | 2.528 | 134.971 | 2.921 |
| 榆中探空 | 14 | 2.033 | 2.840 | 139.695 | 3.329 | |
| 风速/(m·s-1) | WRF | 35 | 14.647 | 9.960 | 68.001 | 10.798 |
| 榆中探空 | 15 | 14.563 | 10.166 | 69.804 | 11.517 |
3 边界层结构及特征分析
3.1 WRF模拟的边界层高度
边界层高度作为大气数值模式和大气环境评价的重要物理参数, 是分析湍流混合、 垂直扰动、 对流传输以及大气污染物扩散的重要指标。利用WRF模式进行三层嵌套, 选择WRF最内层3 km×3 km(与WRF-LES相同研究区域)的模拟结果分析了2007年8月13日10:00边界层高度的空间分布以及模拟区域平均边界层高度的日变化曲线。10:00, 研究区域的边界层高度为1052~1122 m, 由西南向东北方向递减[图3(a)]。当日边界层高度最大值出现在14:00, 为2700 m; 03:00 -06:00边界层高度最小, 小于100 m[图3(b)]。上述分析与杜一博等(2018)利用2006年夏季敦煌野外观测的探空资料分析的晴天对流边界层高度日变化结果一致, 验证了西北半干旱区晴天对流边界层比中国中部、 东部发展旺盛这一结论。当日18:00边界层高度迅速降至200 m左右, 这与一般情况下的夏季边界层高度相差较多, 因此使用SACOL的微波辐射计(TP/WVP-3000, Radiometrics)数据进行对比验证。由2007年8月13日18:00 SACOL微波辐射计观测的温度廓线[图3(c)]可见, 在200 m高度存在温度梯度的极大值, 说明当日18:00边界层高度确实仅为200 m左右。
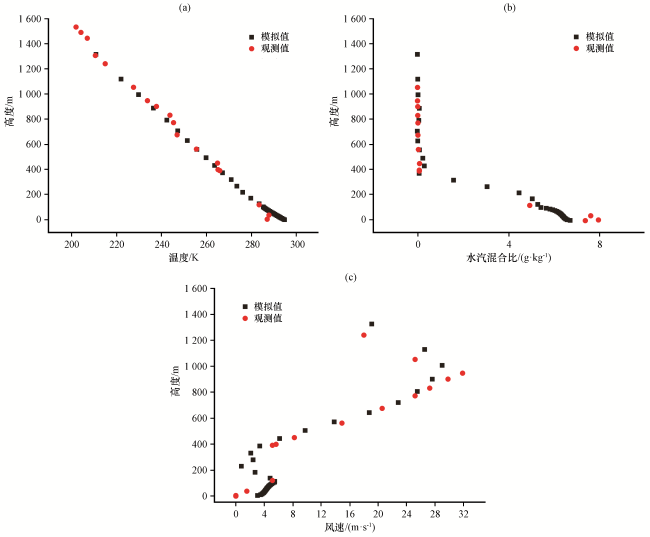
图2 WRF模式模拟和榆中探空站观测的2007年8月13日08:00温度、 水汽混合比和风速廓线Fig.2 Temperature, water vapor mixing ratio and wind speed profiles at 08:00 on 13 August 2007 simulated by WRF and observed by Yuzhong sounding station, respectively |
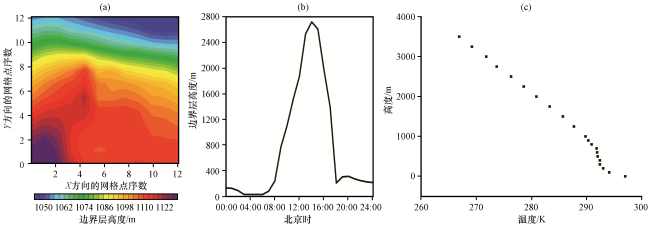
图3 WRF模拟的2007年8月13日10:00边界层高度空间分布(a)和平均边界层高度的日变化曲线(b)以及SACOL微波辐射计观测的当日18:00温度廓线(c)Fig.3 The spatial distribution of boundary layer height at 10:00 on 13 August 2007 (a) and the daily variation curve of average boundary layer height simulated by WRF (b) and the temperature profile at 18:00 on the same day observed by SACOL microwave radiometer (c) |
夜间边界层高度很低且较日间变化幅度很小, 维持在300 m以下, 符合夜间近地层大气层结稳定的基本特征。日间, 边界层高度在08:00开始迅速增加, 并随太阳高度角的增大而增大。这是由于日出后, 太阳向地面发射的短波辐射导致地面快速增温, 热力作用使近地面大气层结变得不稳定, 对流活动开始发展, 夜间形成的大气逆温层由下向上被破坏, 边界层高度抬升。
3.2 边界层湍流强度和位温廓线
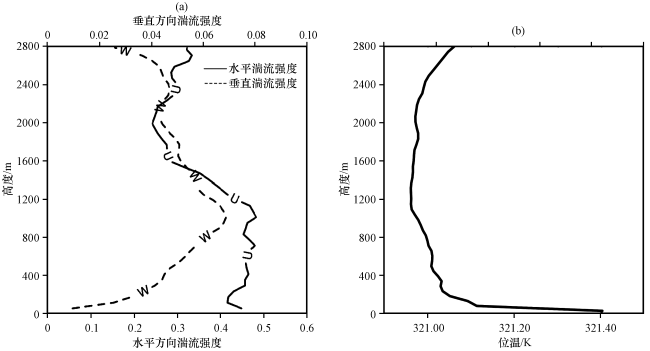
湍流强度可以定量描述湍流脉动发展的强弱, 表示湍流脉动量的相对大小, 是研究大气湍流运动特征的重要参量。通过计算无量纲化的脉动速度标准差分析了黄土高原地区的湍流强度特征。图4是使用实际粗糙度0.062 m代替模式默认值0.1 m后大涡模式(WRF-Z0LES)模拟的SACOL 2007年8月13日10:00区域平均的湍流强度廓线和区域平均的位温廓线。当地垂直方向的湍流强度从地表至1000 m随高度增加而变大, 在1000 m附近达到最大值0.07, 1000 m以上随高度增加而减小。结合边界层高度的模拟结果, 1000 m正是SACOL 10:00混合层顶所在高度, 图4(b)中的区域平均位温廓线也在1000 m高度处存在明显的梯度不连续。说明在混合层顶的垂直湍流强度最大, 湍流垂直混合最剧烈。水平方向湍流强度在近地层内随高度增加略有减小, 再向上湍流强度先接近常数(0.46)然后减小, 并在2000 m处再次增大。从区域平均的位温廓线可知, 2000 m高度以上存在一较厚的逆温层。受上层逆温层的影响, 对流运动在受到上层逆温顶盖的强迫作用后, 很大一部分垂直运动动能转变为水平运动动能, 因此在2000 m高度附近垂直湍流强度减小而水平湍流强度再次增大。
3.3 不同高度的温度场及风场
为了研究黄土高原地区夏季边界层的精细结构, 对不同高度的温度及风速的水平分布进行分析, 通过对比大涡模拟结果中不同高度的水平风温分布来研究边界层结构的三维变化特征。
WRF-LES模拟的地面温度为301.7~302.3 K, 呈现不规则网状结构, 高温、 低温区域互相交错且无序, 显示了对流边界层的典型大涡结构。WRF-LES模拟的风向在高温区变化更加复杂, 且包含一些涡旋结构, 较好地描述了对流边界层湍流的结构特征[图5(a)]。图中高温区分布有一些较明显的湍涡, 尺度100~200 m, 属于尺度较大的湍涡。
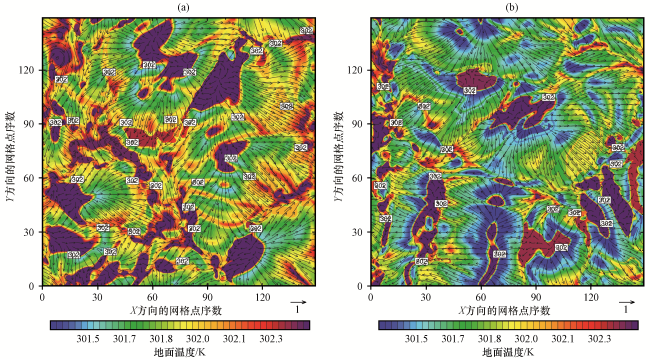
WRF-Z0LES模拟结果[图5(b)]与WRF-LES存在一定差异。由于根据实际情况减小了粗糙度长度, 湍流生成作用减弱, WRF-Z0LES模拟的温度场分布较修改前具有更明显的组织性, 大致是沿东西方向冷暖交替分布。WRF-Z0LES的温度结果较WRF-LES整体低0.4 K, 与模拟域中心处SACOL的观测数据更接近, 说明采用合适的粗糙度对于提高WRF-LES模式模拟效果有重要作用。
在1000 m高度处, 两试验模拟的温度均在294.0~294.6 K, WRF-Z0LES模拟结果在模拟域北部较WRF-LES高0.1 K左右, 但整体差别不大。这是由于高空风场受地面粗糙元影响很小导致的。高空风场较地面有显著变化, 风场由紊乱转变为以小尺度闭合涡旋为主导的结构。在混合层顶所在的1000 m高度处, 湍涡结构尤其明显, 且湍涡数量较低层增多, 尺度在几十米至几百米范围内[图6(a), (b)]。
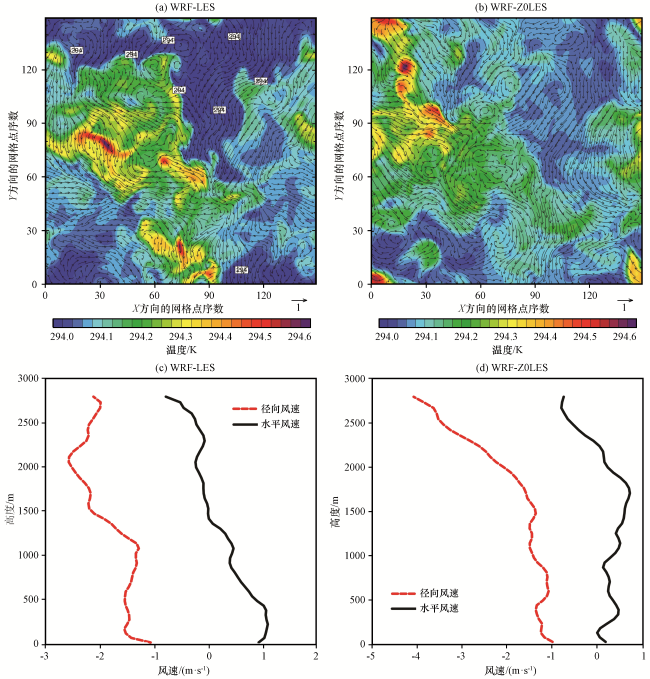


总体来看, 温度从地面至1000 m高度大致降低7.7 K, 地面温度场的高值区与高层温度场的低值区大致对应。风场从以主导风向为主的结构转变为以小尺度闭合涡旋为主的结构。混合层顶所在的1000 m高度处湍涡尺度有所减小, 大致在几十米至几百米范围内, 且涡旋数量增多, 这可能是混合层顶部垂直湍流强度最大, 强夹卷作用导致的。此外, 从风廓线分布情况[图6(c), (d)]也得出在离地1000 m附近高度处水平风速、 径向风速均呈增加趋势的结果。
4 结论与讨论
将中尺度气象模式WRF与大涡模式WRF-LES嵌套, 定量分析了黄土高原这一观测资料匮乏地区较大范围的大气边界层结构及特征, 部分弥补了该地区通量观测资料较少、 时空分辨率较低的缺陷。通过分析不同高度的3 km范围水平风温分布, 得到了黄土高原夏季温湿廓线情形下, 由热力驱动的边界层结构的三维变化特征和湍流的精细分布特征。研究了边界层高度随时间连续变化的过程, 以及湍流强度在不同高度的分布情况, 得到一些适用于本地区的边界层特征量。用SACOL夏季实际粗糙度0.062 m替换模式默认值0.1 m, 改善了大涡模式的模拟效果。主要结果如下:
(1) 当地夏季10:00, 研究区域的边界层高度为1052~1122 m, 边界层高度最大值出现在14:00, 为2700 m; 03:00 -06:00边界层高度小于100 m。
(2) WRF-LES模拟的地面温度为301.7~302.3 K, 混合层顶所在的1000 m高度处温度较地面降低7.7 K, 为294.0~294.6 K。粗糙度改变引起的变量水平分布差异随高度增加而减小。1000 m高度处垂直湍流强度最大(为0.07), 强夹卷作用导致湍涡尺度减小且涡旋数量增多, 水平风场是以小尺度闭合涡旋为主的结构。受逆温层顶盖强迫, 在2000 m高度垂直湍流强度减小而水平湍流强度再次增大。
(3) 以实际粗糙度0.062 m替换模式默认粗糙度0.1 m后, 大涡模式模拟的地面温度整体较之前低0.4 K, 与模拟域中心SACOL的观测数据更接近, 说明采用合理的粗糙度对提高WRF-LES模拟效果有重要作用。
目前考虑的物理因素尚不够完整, 尤其针对黄土高原地区复杂下垫面而言, 地形和辐射场的考虑仍需完善, 由动力驱动的边界层特征有待进一步分析。