1 引 言
2 资料来源和方法介绍
3 极端个例及其降雨时空分布特征
4 风环流异常特征及其影响
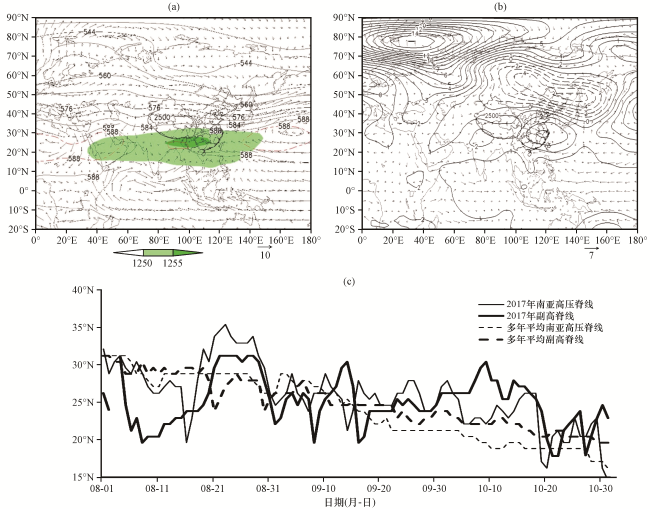
图3 2017年华西秋雨期间平均500 hPa(黑细实线)和200 hPa(阴影)位势高度(单位: dagpm)和850 hPa风场(矢量, 单位: m·s-1)(a), 500 hPa位势高度距平(等值线, 单位: dagpm)和850 hPa风场距平(矢量, 单位: m·s-1)(b)以及8 -10月西北太平洋副热带高压西段及南亚高压东段脊线的纬度逐日演变(c)(a)中红色虚线为多年平均500 hPa 588 dagpm等值线, 青藏高原东南部未标值红色实线为多年平均200 hPa 1250 dagpm等值线, 标值为2500的粗实线为2500 m地形高度线 Fig.3 Mean 500 hPa (black thin line) and 200 hPa (the shaded) geopotential heights (unit: dagpm) and 850 hPa wind field (vector, unit: m·s-1)(a), anomaly 500 hPa geopotential heights (contour, unit: dagpm) and anomaly 850 hPa wind field (vector, unit: m·s-1) (b), and the time series of latitude of WPSH western ridge and SAH eastern ridge from August to October (c) in 2017.In Fig.3 (a), red dotted lines represent multiyear average line of 588 dagpm at 500 hPa, the red thick solid line southeastward to Qinghai-Tibetan Plateau represents multiyear average line of 1250 dagpm at 200 hPa, solid line of 2500 represents 2500 m topographic height |
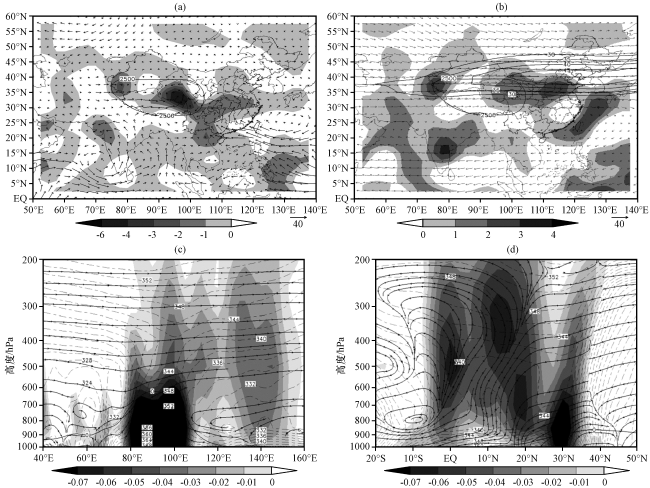
图4 2017年华西秋雨期平均850 hPa水汽通量距平(矢量, 单位: g·s-1·cm-1·hPa-1)、 负水汽通量散度距平(阴影, 单位: ×10-7 g·s-1·cm-2·hPa-1)(a), 200 hPa风场(矢量, 单位: m·s-1)、 西风风速(实线; 单位: m·s-1)和正散度距平(阴影, 单位: ×106 s-1)(b), 沿27.5°N -35°N平均负垂直速度ω(阴影, 单位: Pa·s-1)、 (虚线, 单位: K)及平均纬向环流(流线, u-ω×30)的高度-经度剖面(c, 0线为地形线)以及沿102.5°E -112.5°E平均负垂直速度(阴影, 单位: Pa·s-1)、 (虚线, 单位: K)及径向环流(流线, v-ω×20)的高度-纬度剖面(d)图(a)、 (b)中标值为2500的粗实线为2500 m地形高度线 Fig.4 Mean anomaly 850 hPa water vapor flux vectors (vector, unit: g·s-1·cm-1·hPa-1) and the negative divergence (the shaded, unit: ×10-7g·s-1·cm-2·hPa-1)(a); 200 hPa wind field (vector, unit: m·s-1), u-wind speed (solid line, unit: m·s-1) and positive anomaly divergence (the shaded, unit: ×106 s-1) (b); Vertical cross section of negative vertical velocity ω (the shaded, unit: Pa·s-1), (dotted line, unit: K) and zonal circulation (u-ω×30) streams (streamline) along 27.5°N -35°N (c, The solid line of 0 represents terrain); Vertical cross section of negative vertical velocity ω (the shaded, unit: Pa·s-1), (dotted line, unit: K) and meridional circulation (v-ω×20)streams along 102.5°E -112.5°E (d) in 2017.In Fig.4 (a) and (b), solid line of 2500 represents 2500 m topographic height |
5 季风环流异常成因
5.1 亚洲大气热力状况及其对季风环流的影响
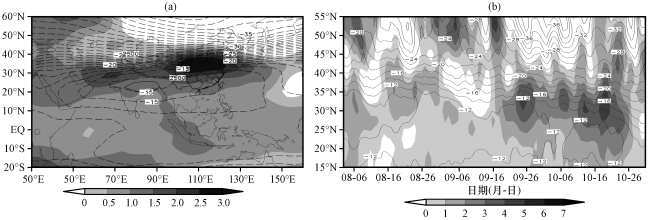
图5 2017年华西秋雨期间500~300 hPa平均温度(虚线)及其距平(阴影)(a, 标注为-15 ℃的实线为多年平均温度)以及温度和距平沿青藏高原(70°E -105°E)的纬度—时间剖面(b)(单位: ℃)图(a)中标值为2500的粗实线为2500 m地形高度线 Fig.5 500~300 hPa mean temperature (dotted line) and the anomalies (the shaded) during Huaxi rainy period (a, the solid line of -15 ℃ represents multi-average temperature ) and the profile of temperature and the anomalies along Qinghai-Tibetan Platea (70°E -105°E) (b) in 2017.Unit: ℃.In Fig.5 (a), solid line of 2500 represents 2500 m topographic height |
5.2 热带对流活动异常特征及其影响
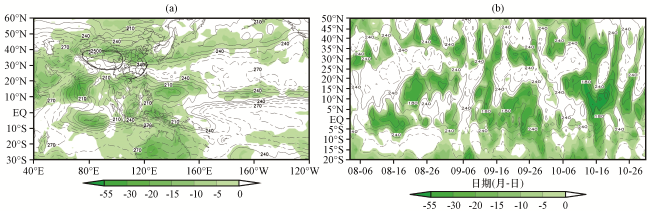
图6 2017年华西秋雨期平均OLR(等值线, 单位: W·m-2)及其距平(彩色区, 单位: W·m-2)分布(a)和8 -10月110°E -140°E平均OLR(等值线, 单位: W·m-2)及其距平(彩色区, 单位: W·m-2)的纬度-时间剖面(b)图(a)中标值为2500的粗实线为2500 m地形高度线 Fig.6 The distribution of mean OLR (contour, unit: W·m-2) and the anomalies (color area, unit: W·m-2) during Huaxi rainy period (a); latitude-time profile of mean OLR (contour, unit: W·m-2) and the anomalies (color area, unit: W·m-2) along 110°E -140°E from August to October (b) in 2017.In Fig.6 (a), solid line of 2500 represents 2500 m topographic height |
5.3 热源异常分布特征及其影响
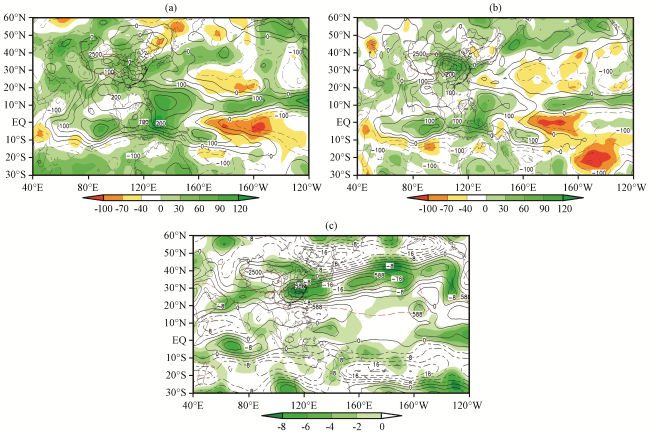
图7 2017年华西秋雨期整层积分的视热源(等值线)及其距平(彩色区)(a, 单位: W·m-2)、 视水汽汇(等值线)及其距平(彩色区)(b, 单位: W·m-2)及500 hPa涡度(实线为负、 虚线为正)及其距平(彩色区)(c, 单位: ×106 s-1)分布图(a)中标值为2500的粗实线为2500 m地形高度线, (c)中红色虚线为500 hPa位势高度 Fig.7 The distribution of whole level integrated heat source (contour) and the anomalies (color area) (a, unit: W·m-2), moisture sink (contour) and the anomalies (color area) (b, unit: W·m-2), vorticity (solid and dotted lines represent negative and positive value, respectively) and the anomalies (color area) at 500 hPa (c, unit: ×106 s-1; ) during theautumn rainy period at Huaxi in 2017.In Fig.7 (a), solid line of 2500 represents 2500 m topographic height.In Fig.7 (c), red dotted lines are 500 hPa potential height |
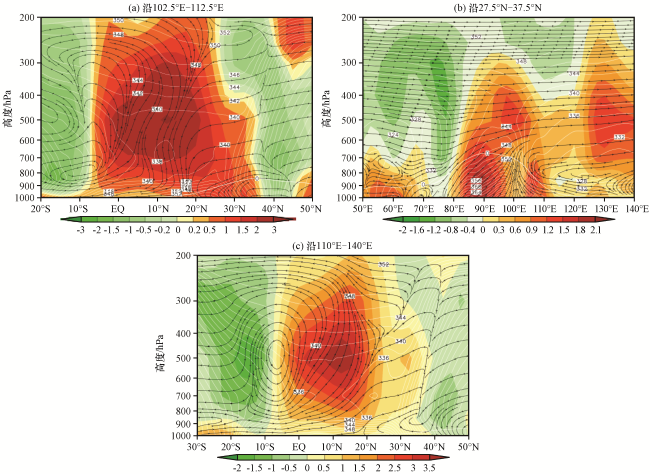
图8 2017年秋雨期间不同区域平均视热源(彩色区, 单位: K- 1·d– 1)及 (白色等值线, 单位: K)的垂直剖面图(b)中0线为地形线, 流线为纬向环流; 图(a)和(c)中的流线为经向环流 Fig.8 Profile of heat source (color area, unit: K-1·d -1) and (white contour, unit: K) along different region during Huaxi rainy period in 2017.In Fig.8 (b), the solid line of 0 represents terrain, streamline represent zonal circulation.In Fig.8 (a) and (c), streamline represent meridional circulation |