
1 引言
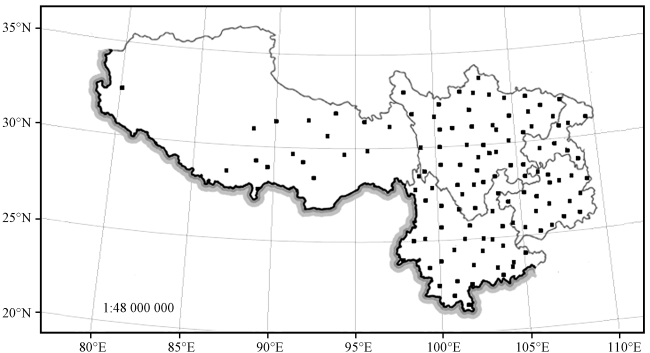
2 资料选取与方法介绍
3 ENSO事件演变特征与西南夏季降水的关系
图2 1981 -2017年西南夏季降水第二模态PC系数与前一年9月至同年8月SST的相关场分布实线表示正相关, 虚线表示负相关, 加粗实线为0线, 阴影区域表示相关系数通过90%的显著性检验 Fig.2 The correlation coefficient fields between the second principle component (PC) of summer precipitation in the Southwest China and SST from pre-September to August during the period from 1981 to 2017.The solid and dotted line is for positive and negative correlation, respectively.The thick solid line is for zero and the shaded area is for correlation coefficient passing the 90% significant test |
图4 El Niño衰减年(a)和La Niño衰减年(b)的西南夏季降水距平百分率合成值, 以及它们的差值T检验结果(c, 灰色区域为通过80%显著性检验)Fig.4 The summer precipitation anomaly of the Southwest China in the El Niño decay year (a), La Niño decay year (b) and their difference values with T test results (c, gray area represents passing 90% significance test) |
表1 El Niño/La Niño衰减年在不同季节结束的年份统计Table 1 Statistical of El Niño/La Niño decay years with different end time |
| 冬季结束 | 春季结束 | 夏季结束 | |
|---|---|---|---|
| El Niño衰减次年 | 1980, 1988, 2003, 2005, 2007 | 1992, 1995, 1998, 2010, 2016 | 1983 |
| La Niño衰减次年 | 1984, 2001, 2017 | 1996, 2006, 2008, 2009, 2011, 2012 | 1985, 1989 |
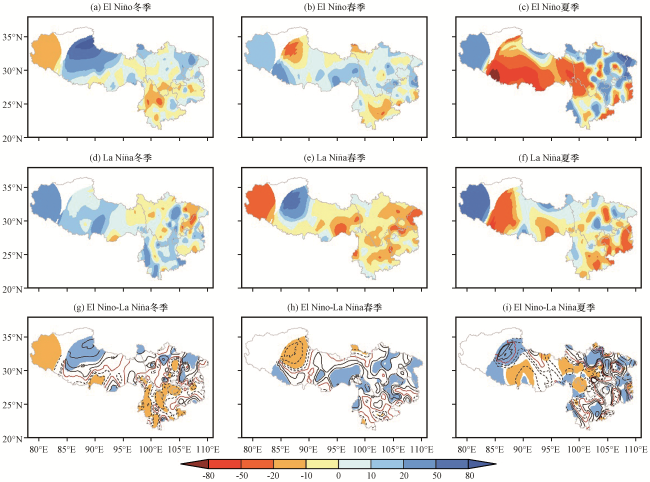
图5 峰值在前冬的El Niño和La Niño衰减年的西南夏季降水距平百分率合成值及其差值T检验(ENSO事件在冬季, 春季和夏季结束)图g, h, i中的蓝(橘)色阴影区为差值通过90%显著性检验的正(负)值区域, 黑色实线为正值, 虚线为负值, 红色实线为零线 Fig.5 The summer precipitation anomaly percentage of the Southwest China in El Niño, La Niño decay year and their difference values with T test results (ENSO peaks in winter and ends in winter, spring, summer).The blue (orange) shaded area in Fig g, h, i represents the positive (negative) difference value passing 90% significance test, the black solid (dotted) line is fore positive (negative) value and the red line is for zero |
4 ENSO事件演变对西南夏季降水的影响机制
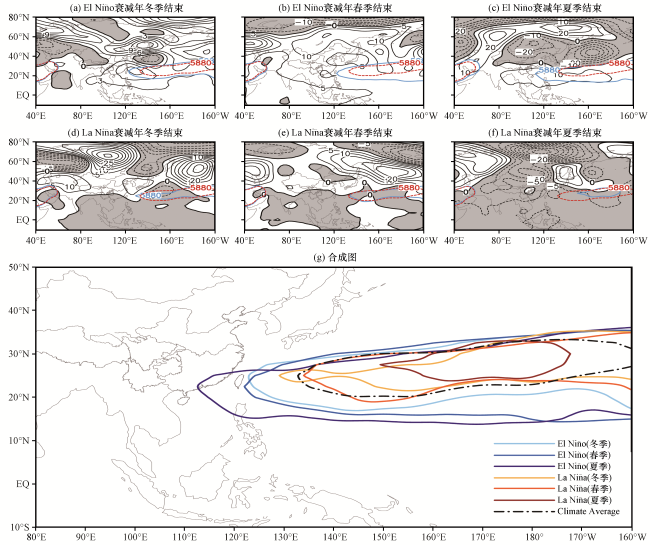
图6 峰值在前冬的El Niño衰减年和La Niño衰减年分别在冬、 春和夏季结束的夏季500 hPa气候平均和副高5880 gpm等值线的合成图(a~f)中阴影为负值, 红线和蓝线分别为常年和挑选年的5880 gpm等值线 Fig.6 Summer geopotential height anomaly field over 500 hPa and the 5880 gpm line for WPSH in El Niño and La Niño decay year, ends in winter, spring, summer.The shaded area is for negative value, red and blue line are 5880 gpm lines in perennial and selected years, respectively |
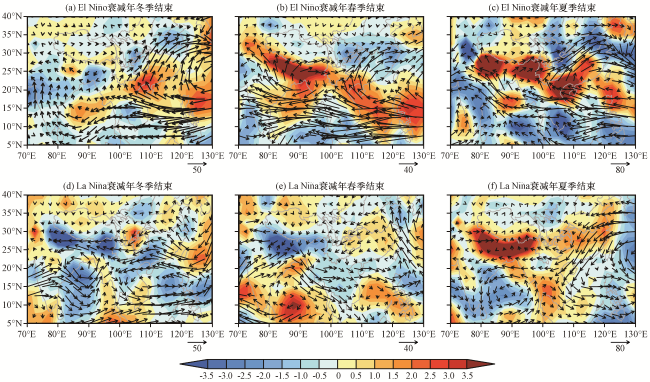
图7 峰值在前冬的El Niño衰减年和La Niño衰减年(次年)分别在冬、 春和夏季结束的夏季整层水汽通量(矢量, 单位: g·m-1·s-1)和水汽通量散度(阴影, 单位: g·s-1)距平合成Fig.7 Summer anomaly field of the whole layer water vapor flux(arrow, unit: g·m-1·s-1) and its divergence (the shade, unit: g·s-1) in El Niño and La Niño decay year, which peaks in winter and ends in winter, spring, summer |
5 ENSO事件演变对西南夏季降水关键环流系统的可能影响
图10 峰值在前冬在春季和夏季结束的El Niño衰减年和La Niño衰减年的前一年9月到当年8月的500 hPa ω距平在110°E -130°E经向剖面合成Fig.10 Anomaly fields of ω over 500 hPa in the region 110°E -130°E from pre-September to August in the El Niño and La Niño decay year, which peaks in winter and ends in spring and summer |
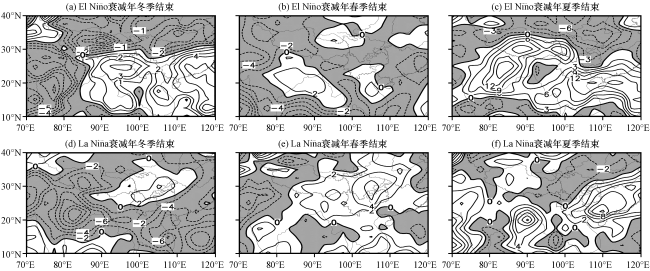
图8 峰值在前冬的El Niño衰减年和La Niño衰减年(次年)分别在冬、 春和夏季结束的OLR距平合成Fig.8 Summer anomaly field of outgoing long-wave radiation in El Niño and La Niño decay year, which peaks in winter and ends in winter, spring, summer |
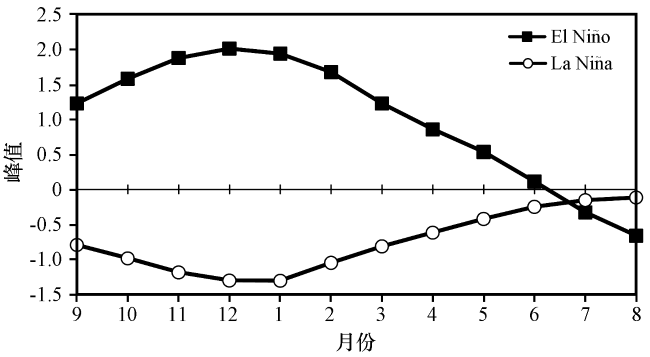
图9 峰值在前冬在春季和夏季结束的El Niño衰减年和La Niño衰减年的前一年9月到当年8月的Niño3.4指数合成图Fig.9 Anomaly of Niño 3.4 from pre-September to August in El Niño and La Niño decay year, which peaks in winter and ends in spring and summer |
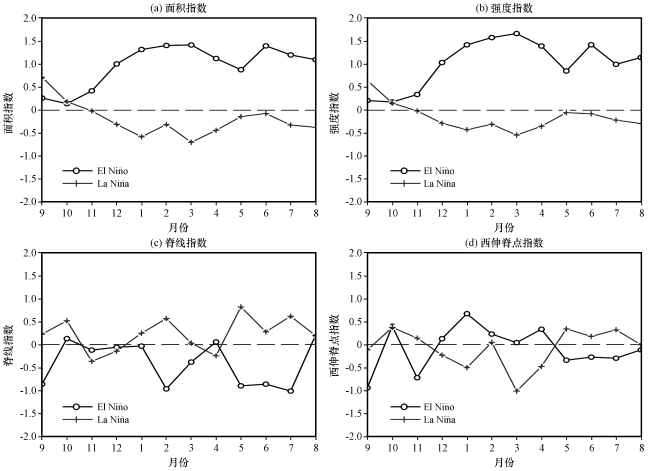
表2 自前年9月Niño3.4逐月值与夏季副热带高压指数的相关系数Table 2 Correlation coefficient between monthly Niño3.4 index and summer Western Pacific Subtropical High indices from pre-September to August |
| 指数 | 9月 | 10月 | 11月 | 12月 | 1月 | 2月 | 3月 | 4月 | 5月 | 6月 | 7月 | 8月 |
|---|---|---|---|---|---|---|---|---|---|---|---|---|
| 面积 | 0.68*** | 0.72*** | 0.76*** | 0.73*** | 0.70*** | 0.69*** | 0.70*** | 0.63*** | 0.43*** | 0.20 | -0.04 | -0.17 |
| 强度 | 0.62*** | 0.66*** | 0.70*** | 0.68*** | 0.64*** | 0.63*** | 0.65*** | 0.58*** | 0.38** | 0.16 | -0.06 | -0.19 |
| 脊线 | -0.21 | -0.21 | -0.22 | -0.23 | -0.23 | -0.23 | -0.28* | -0.31* | -0.26 | -0.13 | -0.01 | 0.11 |
| 西伸脊点 | -0.09 | -0.07 | -0.10 | -0.14 | -0.14 | -0.16 | -0.11 | -0.05 | 0.07 | 0.19 | 0.21 | 0.21 |
***、 **和*分别表示通过99%, 95%和90%的显著性T检验 |
表3 自前年9月起Niño3.4逐月累加值与夏季副热带高压指数的相关系数Table 3 Correlation coefficient between monthly accumulated Niño3.4 index and summer Western Pacific Subtropical High indices from pre-September to August |
| 指数 | 9月 | 10月 | 11月 | 12月 | 1月 | 2月 | 3月 | 4月 | 5月 | 6月 | 7月 | 8月 |
|---|---|---|---|---|---|---|---|---|---|---|---|---|
| 面积 | 0.68*** | 0.71*** | 0.73*** | 0.74*** | 0.73*** | 0.73*** | 0.73*** | 0.73*** | 0.73*** | 0.73*** | 0.71*** | 0.68*** |
| 强度 | 0.62*** | 0.64*** | 0.67*** | 0.68*** | 0.67*** | 0.67*** | 0.67*** | 0.67*** | 0.67*** | 0.66*** | 0.65*** | 0.62*** |
| 脊线 | -0.21 | -0.21 | -0.21 | -0.22 | -0.22 | -0.23 | -0.23 | -0.24 | -0.25 | -0.25 | -0.25 | -0.23 |
| 西伸脊点 | -0.09 | -0.08 | -0.09 | -0.10 | -0.11 | -0.12 | -0.12 | -0.11 | -0.10 | -0.09 | -0.07 | -0.04 |
***、 **和*分别表示通过99%, 95%和90%的显著性T检验 |