

1 引言
近年来, 随经济发展对水资源需求增长和环境保护加强, 国内北方各地开展人工增雨(雪)业务。层状云是中国北方人工增雨(雪)的主要作业对象, 研究层状云降水微物理特征和层状云催化后响应对提高人工影响天气作业技术具有重要意义。
中外研究者普遍利用了高时空分辨率的机载粒子测量系统(PMS)和卫星、 雷达遥感技术等对层状云进行微物理参量和宏观综合监测。如Solak et al(2003)采用回归方法评估催化后对系统下游影响区域20多年来的降雨影响, 研究表明催化作业后系统下游影响区评估可达150 km, 增雨量约为14%。Geerts et al(2010)利用搭载在飞机上的多普勒雷达观测了碘化银催化冬季地形云后降雪变化, 发现催化作业后近地面雷达回波强度有所增加, 降雪量明显增加。国内也有许多利用雷达、 卫星、 雨量及机载探测等多种探测手段对人工催化效果进行观测研究的案例。王黎俊等(2013)利用机载测量系统研究了三江源地区秋季典型多层层状云系的微物理特性, 发现不同高度的云层云粒子浓度及过冷水含量均有较大差异, 但粒子谱分布类似。孙玉稳等(2015)统计分析了河北地区秋季层状云小云粒子、 大云粒子、 降水粒子浓度和云粒子有效直径等物理特征, 结果表明, 河北地区适宜增雨作业的云系为中、 低或高、 中、 低搭配的层状云, 过冷层催化有利于云体发展, 促使气流流入形成正反馈。孙玉稳等(2019)结合天气雷达和Ka波段云雷达资料利用机载测量系统分析积层混合云的微物理结构和增雨作业条件, 结果表明, 嵌入对流核的积层混合云中, 5000 m以上冷云中上层过冷水含量达0.2 g·m-3, 比稳定的层状云中过冷水含量提高2~4倍; 丰富的过冷水从雨核发展初期维持到雨核发展盛期, 且该高度层是冰晶重要增长区, 温度在-15~-5 ℃之间, 适合催化作业。蔡兆鑫等(2013)通过对比分析作业前后飞机航迹上探测的云粒子、 冰晶浓度变化, 研究了催化的微物理响应, 发现过冷水含量较高的地区, 催化效果较为明显。朱士超等(2014)在环北京地区进行3架飞机对华北地区积层混合云进行联合作业探测, 多手段综合观测, 结果表明, 作业后云内冰晶的形状、 分布及增长情况受云顶温度、 云中所处位置等因素影响。汪玲等(2015)利用新一代天气雷达三维拼图和最大相关系数的雷达回波跟踪方法(TREC), 实时跟踪作业前后回波, 通过计算区域内各种回波参数的变化, 来分析人工增雨效果。师宇等(2017)对冬季冷性层状云降水过程进行数值模拟和人工增雨催化数值实验, 模拟的自然降水分布和实测结果一致, 不同的催化试验都可以使地面雨量增加。栾澜等(2017)利用WRF模式模拟青藏高原一次对流降水过程, 将模式结果与实测资料进行对比, 进一步了解了不同微物理和边界层参数化方案组合对降水过程模拟的差异。上述研究主要集中在两个方向: 一是催化条件分析; 二是催化效果验证。由于自然降水本身存在巨大变异, 试验中就降水量增加与催化作业难以形成直接证据链, 人工增雨效果不时受到质疑, 通过试验研究人工催化后目标云效果响应对建立降水量增加与催化作业之间证据链具有重要意义。
本文利用2018年1月22日倒槽系统在低空形成的过冷水云的典型案例, 通过催化后云粒子变化和卫星监测结果, 研究人工催化后的效果响应。
2 仪器和资料处理方法
2.1 探测仪器
机载探测设备有机载粒子探测系统、 AIMMS-20机载气象探测系统、 Nevzorov热线式含水量仪(可以实测云内液态含水量和冰水含量)、 LWC-300液态含水量仪、 湿度露点仪和GPS定位等。其中, 粒子探测系统包括DMT公司CDP探头, 测量粒子直径范围为2~50 μm; CIP探头, 测量粒子直径范围25~1550 μm; SPEC公司FCDP探头, 测量粒子直径范围为0.75~48 μm; HVPS-3探头, 测量粒径范围为150~19200 μm; 3V-CPI探头是由2D-S探头和PDS所组成的, 可对粒子进行高分辨率的影像探测, 测量云中的水滴以及冰晶粒子的大小、 形状和含量。另外还有天气资料、 Ka波段云雷达资料等。
2.2 数据处理及质量控制
为更清楚地了解各探头测量的不同通道粒子数浓度催化前后的响应和粒子谱变化, 各种微物理参量均采用每秒探头观测的数据组进行分析。
CDP探头观测数据连续时间需要大于5 s, 否则作为野点剔除。CIP探头和HVPS-3探头测量粒子浓度异常偏大, 与其前后浓度变化无法用物理解释, 该组数据作为野点剔除。利用CIP观测数据分析冰晶或雪花浓度时, 为降低直径小于100 μm粒子影响, 选取直径在100~1000 μm粒子; HVPS-3探头观测数据用于分析降水粒子时, 只选取直径在1000~19200 μm粒子浓度数据。
2.3 分析方法
式中: Ni为i通道粒子的数浓度(单位: m-3); ni为i通道粒子的数密度(单位: m-3·μm-1); Di为i通道粒子的中值直径(单位: μm); Dm为粒子的平均直径(单位: μm)。
CDP探头探测的小云粒子数浓度CDPN, 平均直径为CDPD, 计算液态含水量为CDPLWC; CIP探测的大云粒子数浓度CIPN, 平均直径为CIPD; HVPS探测的降水粒子数浓度HVPSN, 平均直径为HVPSD。
3 天气背景及飞行概况
3.1 天气形势分析
2018年1月21日20:00(北京时, 下同), 500 hPa横槽位于贝加尔湖南侧, 河北省受槽前西风气流控制。地面锋区位于我省北部, 山西南部有一弱的地面倒槽。850 hPa有横向切变, 温度露点差<2 ℃, 湿度接近饱和。随着时间推移, 横槽快速下摆, 同时地面锋区南压, 我省自北向南陆续出现降雪, 21日晚间降雪区主要位于保定以北, 22日上午移到石家庄、 沧州一线。到20:00, 我省受500 hPa低横底部控制(偏西北气流), 除南部个别站点有零星小雪外, 我省大部分地区降雪停止[图1, 此图及下文所涉及的地图是基于国家测绘地理信息局标准地图服务网站下载的审图号为GS(2016)1552号的中国地图制作, 底图无修改]。
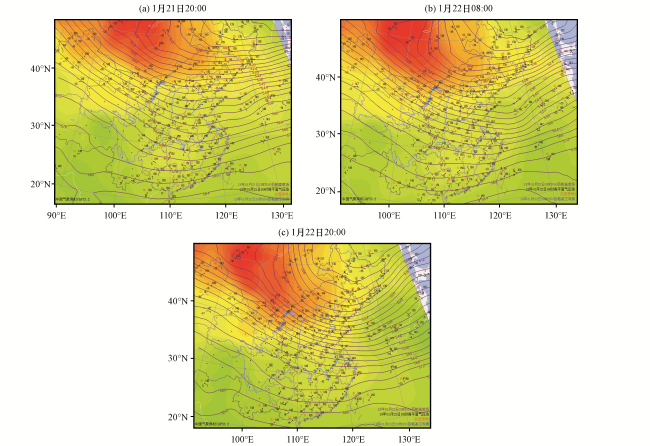
图1 2018年1月21日20:00(a), 22日08:00(b), 22日20:00 (c)高空形势图等值线为500 hPa高度场, 阴影区为500 hPa温度场,黑色数字为海平面气压场 Fig.1 Meteorological condition in high altitude at 20:00 on 21 (a), at 08:00 on 22(b), and at 20:00 on 22 (c) January 2018.The isoline is 500 hPa height field, the shaded is 500 hPa temperature field, the black number is sea level pressure field |
3.2 飞机探测概况
从图2(a)中可以看出, 16:12飞机从正定机场起飞后, 在2000 m平飞到河北中南部的邢台。16:53:38 -16:58:24在邢台市区从2000~600 m做垂直结构观测; 17:16:14 -18:16:26在600, 900, 1200, 1500, 1800和2000 m高度沿半径10 km圆形轨迹平飞, 600 m和1200 m高度层分别平飞2圈, 2000 m平飞半圈, 其他高度层均平飞1圈, 圆形平飞时段共点燃烟条24根。18:16:26 -18:52:11在1800, 1500, 1200, 900和600 m高度层作边长为10 km的正方形水平飞行探测。20:04:53飞机降落到正定机场。飞机宏观观测记录显示, 飞机垂直探测时云层较薄, 云顶在1200 m, 云底在600 m。在邢台市上空第一次分层水平催化作业时CPI探头观测到云内出现大量液态水滴, 无固态粒子; 作业过程中机翼出现结冰。飞机第二次从云顶至云底水平分层探测, 通过CPI探头观测到的粒子图片可见云内出现大量的六角板状、 柱状、 针状冰晶及冰晶聚合体。距作业区直线距离约10 km的邢台皇寺云雷达观测显示(图略), 云顶高度、 云底高度和上层无云等宏观特征与飞机宏观观测结果一致。
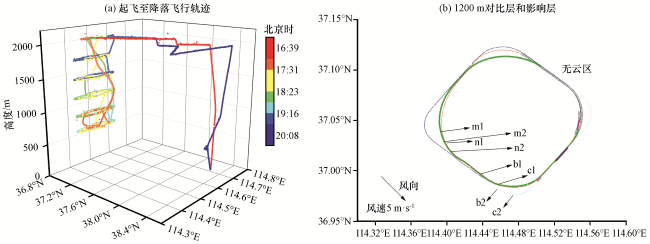
未催化的云块定义为对比云, 催化后的云块定义为影响云。由于云的水平移动、 催化剂的扩散和因核化可能引起的剂量衰减等复杂因素的影响(余兴等, 2002; 王黎俊等, 2013b), 在空中寻找对比云和对应的影响云非常困难, 文中以1200 m高度层仅考虑环境风场对催化剂的水平输送为例说明对比云和影响云, 即在1200 m高度园形平飞时的云块为对比云, 在高空风作用下, 圆形轨迹随风移动, 当第二次圆形航线与移动后的前次圆形轨迹在某点重合、 或正方形轨迹航线与移动后的前两次圆形轨迹在某点重合, 该重合点代表的云块为影响云。20:00邢台探空站L波段探测资料和机载M300实测高空风向风速共同显示, 1200 m高度为西北风, 风速5 m·s-1, 飞机在平飞探测阶段飞行速度约80 m·s-1。通过GPS卫星定位和风向、 风速、 飞机飞行速度综合推算, 飞机第一次圆形航线催化作业的线段m1-n1为未催化作业云, 称对比云层, 9 min后该云移动到m2-n2, 飞机第二圈圆形航线飞行至m2-n2时探测到的云即为第一圈在m1-n1位置催化的云块, 称影响云层。同理, 飞机第一次圆形航线催化作业的线段b1-c1为未催化作业云, 21 min后该云块移动到b2-c2处, 飞机方形航线飞行至b2-c2时探测到的云块即为b1-c1处催化的云块, 该云块称为b1-c1处云块所对应的影响云[图2(b)]。
4 观测结果分析
4.1 层状云垂直结构特征
飞机到达邢台市上空对云做垂直探测, 获取了2200~600 m高度范围的云系垂直结构和云中微物理量的垂直分布情况。从温度随高度变化廓线[图3(a)]看出, 1400~1500 m高度存在一明显逆温层, 逆温层上部1500~1700 m有明显的等温层, 逆温层温度从-13 ℃升至-6.7 ℃, 平均温度梯度Г=-ΔΤ/ΔH=6.3 ℃·(100 m)-1, 等温层温度为-6.7 ℃。逆温层上空没有高云出现, 飞机探测结果与云雷达观测结果一致。
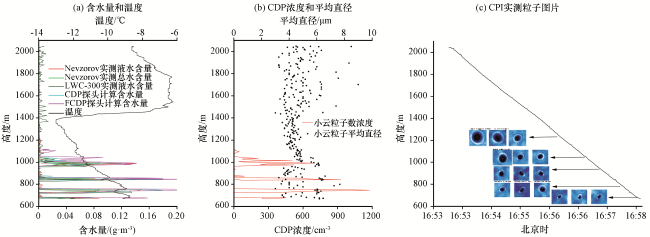
以CDP探测到的小云粒子浓度CDPN≥10 cm-3做为飞机入云标准来判断, 从CDP探测结果[图3(b)]和Nevzorov热线式含水量仪、 LWC-300热线式含水量仪实测过冷水以及CDP、 FCDP计算过冷水含量[图3(a)]综合看出, 层状云垂直结构上呈现多层分布, 小云粒子浓度出现多个峰值, 云内小云粒子浓度平均值为440 cm-3, 最大峰值浓度1200 cm-3, 出现在云的中下层750 m; 云内过冷水含量LWC最大值为0.2 g·m-3, 位于云的中层和下层; 云层之间是小云粒子稀疏, 出现含水量接近0 g·m-3的干层; 云层较薄, 最厚云层出现在1200 m的顶层。600~1200 m冷云内温度为-13~-6 ℃, 整个云层处于冷云中[图3(a)]。云粒子直径一般在4~6 μm, 最大直径为9 μm[图3(b)]。CPI探头在2045~600 m下降垂直探测时, 仅在1045~770 m观测到水滴, 1045 m以上CPI图像没有任何粒子, 层状云全部由过冷水滴构成[图3(c)]。降水记录显示, 当日12:00后邢台市区曾降小雪。冬季出现水云可能有两个原因: 一是先前有降雪, 云内易引发冻结的大的气溶胶被冲洗掉, 气溶胶核化的凝结核性质和大小较为同一; 二是由于特殊原因, 本例中1500 m以上出现逆温, 云层被限制在某一层内, 形成浅薄云层, 缺乏来自上层自然冰晶。云滴在云内均质增长, 形成水云。
4.2 催化前后云粒子变化
为分析催化后云粒子变化, 对比两次飞机在600~2000 m水平分层探测时CDP、 CIP和HVPS、 过冷水含量随时间的演变(图4)。从CDP探测的粒子浓度看, 仅在1200 m出现大范围浓度高值区, 云粒子浓度102 cm-3量级; 其他各层粒子浓度较为稀疏, 作业后在900 m高度层CDP浓度小于10 cm-3。从CIP粒子浓度看, 作业前仅在1200 m出现小范围浓度超过10 L-1的云区, 作业后在1200, 900和600 m三个高度层分别出现大范围浓度超过10 L-1云区; HVPS探头实测降水粒子浓度呈现相同特征。从粒子谱看, 催化后1200, 900和600 m都出现粒子谱明显拓宽区域现象(图5), 同时在粒子谱明显拓宽的区域, 过冷水含量明显降低。分析认为, 人工催化作业后, 播撒的冰核通过贝吉龙效应长大, 过冷水被消耗, 形成冰晶, 冰晶通过淞附、 黏连、 碰连等过程形成冰晶聚合体, 使粒子谱拓宽。从CPI图像(图6)可见, 催化后云内多层有冰晶和冰晶聚合体, 冰晶上有大量淞附。
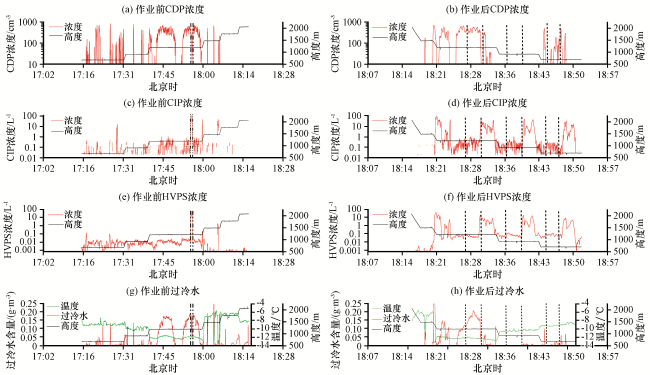
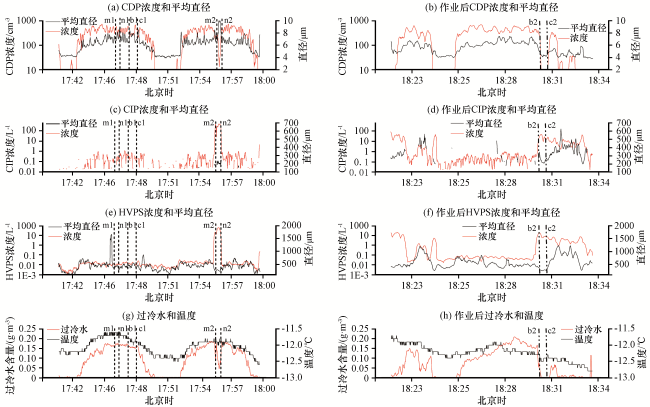
图4 2018年1月22日邢台市区上空两次分层水平探测和催化时段各微物理量的演变Fig.4 Evolutions of each microphysical parameter during the seeding period of two layered level detections over the urban area of Xingtai on 22 January 2018 |
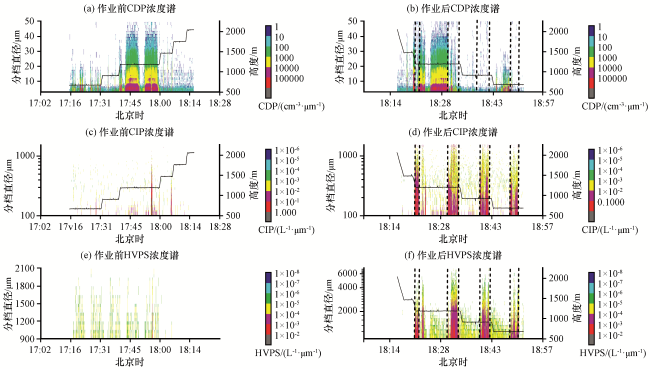
图5 2018年1月22日邢台市区上空两次分层水平探测和催化时段云粒子谱分布的演变Fig.5 Evolutions of microphysical parameters during the seeding period of two layered level detections over the urban area of Xingtai on 22 January 2018 |
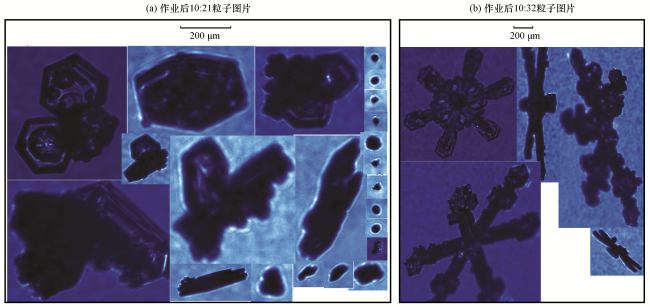
为进一步分析催化后云的响应, 将1200 m水平飞行时探测到的云分为对比云和影响云, 由上文分析m1-n1云块与m2-n2云块是催化前后的同一云块, b1-c1云块与b2-c2云块是催化前后的同一云块, 依照时间定位标示在图7上。图7显示CDP浓度在m1-n1与m2-n2分别为200 cm-3和15 cm-3, 影响云云粒子浓度急剧降低; CIP浓度在m1-n1与m2-n2分别为1 L-1和150 L-1, 冰晶粒子浓度急剧增长; HVPS的粒子浓度在m1-n1与m2-n2分别为0.02 L-1和70 L-1, CPI显示云内冰晶聚合体图片明显增加; 云内过冷水含量在m1-n1与m2-n2分别为0.17 g·m-3和0.05 g·m-3, 过冷水含量急剧下降。对比云b1-c1到影响云b2-c2也出现云滴浓度大幅降低, 过冷水含量减少, 云内冰晶和冰晶聚合体浓度急剧增加, 平均直径增大, 粒子谱明显变宽(图5)。说明在主要由过冷云滴构成的云内人工加入催化剂可加速液态水向冰晶转化, 形成大量冰晶, 冰晶通过碰并、 黏连、 攀附等方式形成冰晶聚合体等降水粒子, 可见催化促进降雪形成。
4.3 催化效应的卫星观测结果


5 结论
(1) 冬季冷云发展演变过程中, 当云凝结核较为同一、 且云被限制在某一层内, 形成浅薄云层时, 云滴可能均质增长, 出现主要由过冷水滴形成的水云云团。该例中云粒子最大浓度1200 cm-3; 过冷水含量LWC最大值为0.2 g·m-3; 云粒子直径在4~6 μm, 最大直径为9 μm。
(2) 人工催化后, 冰核在云内迅速增长形成冰晶及冰晶聚合体, 催化使云粒子浓度200 cm-3迅速降到15 cm-3, 100~1000 μm冰晶和雪晶浓度增长到150 L-1, 1000 μm以上降水粒子浓度增长到70 L-1, 出现直径达6000 μm雪花, 人工催化可促进降雪形成。
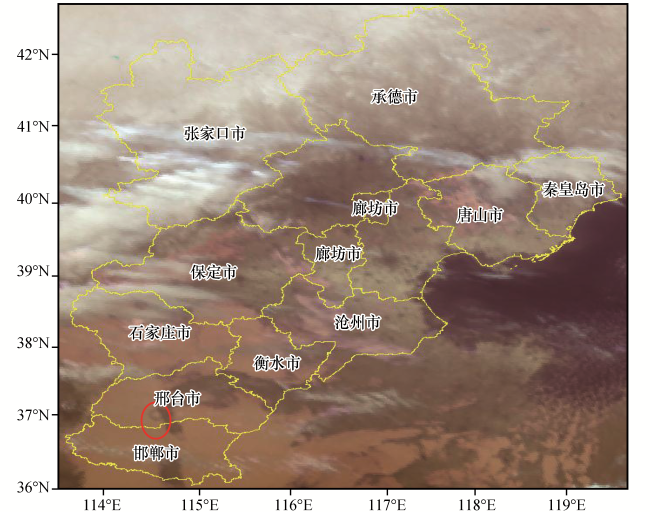
(3) 催化影响区由于过冷水滴迅速变成冰晶和雪花并降落, 云浓度迅速降低形成无云或少云云区。催化作业结束20 min后, 葵花8卫星云图上沿催化轨迹呈现为深色云带, 表明此次催化作业效果显著。