

1 引言
近年来, 因经济发展和城市建设需求, 工业化进程加快, 大量污染物的排放使城市大气污染日益加重(杨雪玲等, 2018), 严重影响了人类生活和健康, 引起了政府各部门对大气污染科学防治的高度重视(尹承美等, 2019)。风是影响大气扩散的重要因子(覃军等, 2001), 边界层中诸如热量、 动量、 污染物等在水平和垂直方向上的输送均受风的支配(Stull, 1988; Schmidli et al, 2012), 风场结构特征对边界层内大气污染物的扩散和输送有直接影响, 是决定空气质量的重要因素(Shi et al, 2019)。分析城市大气边界层风场特征, 可以更好地了解城市大气运动规律(柯莉萍, 2017), 探究风对污染物浓度的影响, 可为城市环保规划和空气质量预警预报提供重要参考。
通常以气象梯度塔、 无线电探空仪、 系留气艇等方式获取边界层风廓线信息, 这些传统探测方式一方面受探测高度限制, 另一方面探测时次不连续。随着探测技术的发展, 一些新型风场探测手段, 如激光测风雷达, 可以弥补传统探测的缺点, 实现对风廓线的高时空分辨率连续观测(黄晨等, 2017)。其中多普勒激光测风雷达通过大气中悬浮粒子(如灰尘、 气溶胶、 云滴、 雾滴等)对雷达发射激光的后向散射产生的多普勒频移来获取高时空分辨率的精细化风场信息(Devara et al, 2015), 捕捉风场变化的细微结构, 且体积小、 重量轻, 移动便携, 无需看守, 可实现自动化连续观测, 被认为是获取地面到平流层低层风场最有前途的主动遥感探测器之一(Baumgarten, 2010; Devara et al, 2015)。激光测风雷达在风场变化、 低空急流、 风电场评估等方面得到了广泛应用(Bodini et al, 2017; Chen et al, 2017; Kumer et al, 2017; Vanderwende et al, 2015)。
污染物排放和不利大气扩散条件是城市大气污染发生的主要原因, 污染物排放源一定时, 大气扩散条件是决定城市空气质量的关键因素(何建军等, 2016; 尹承美等, 2019; 杨雪玲等, 2018)。大气扩散条件受天气形势和局地气象因子(风速、 风向、 温度、 相对湿度、 边界层高度等)的影响(何建军等, 2016; 杨雪玲等, 2018), 而局地气象条件受天气背景影响(Zhang et al, 2012)。Ye et al(2016)发现, 2013年1月华北地区重霾天气多发生在弱低压、 东北高压、 东南高压和东部高压控制下, 这些天气系统下的弱风和高相对湿度为霾粒子的吸湿增长创造了良好条件。许建明等(2016)利用主成分分析法对上海2013 -2015年秋冬季的海平面气压场和10 m风场进行客观天气分型, 分析了不同天气形势下气温、 相对湿度、 降水和风速特征及其对污染物的影响, 发现在高压前部弱气压场和高压后部弱气压场形势下, 上海的水平风速最小、 风向较乱, 大气扩散条件差, 是“易污染”天气型。风作为影响大气扩散的重要气象因子之一, 一直是城市大气污染研究关注的焦点。许多研究表明, 污染物浓度与风速有一定的显著相关性(陈雷华等, 2010; 杨雪玲等, 2018; 杨莹等, 2015)。
兰州市位于青藏高原黄河流域以东的河谷盆地, 是典型的山谷城市, 市区呈东西走向, 长约35 km, 南北宽2~8 km, 谷底平均海拔1520 m, 南北两山较高, 相对高度500~600 m, 总体西南高, 东北低, 这种复杂地形下的风场具有高度非均匀性(刘郁珏等, 2018)。兰州也是我国西部主要的重工业城市(谢学军等, 2010), 大量的污染物排放和特殊地形作用下的不利扩散条件使兰州大气污染严重, 特别是冬季燃煤取暖排放和高频率静风使兰州冬季空气质量不容乐观(王海龙等, 1999)。以往对于风场或大气污染与风场关系的研究, 主要以系留探空或地面观测资料或数值模拟为主(Zhao et al, 2019; 张嘉荣等, 2020; 董龙翔等, 2019; 张强等, 2003), 观测资料覆盖时间短, 时间分辨率低(例如常规探空虽然常年观测, 但一天只有2~4次), 目前还未有整个冬季小时连续风廓线观测的相关工作, 对兰州风场垂直结构的日变化特征尚不清楚。本文以新型激光测风雷达在兰州城区获取的2017年12月至2018年2月风廓线观测资料为基础, 分析兰州冬季风场特征, 并结合再分析资料和污染物浓度观测资料, 研究以复杂地形局地环流为主导的天气形势下风场与大气污染的关系, 有助于深入认识山谷城市风场垂直结构及其与污染物浓度变化的关系, 为改进中尺度模式对复杂地形区的风场模拟性能和空气质量预报预警提供借鉴。
2 资料选取与方法介绍
2.1 资料选取
2.1.1 风廓线资料
风廓线观测资料来自架设在中国科学院西北生态环境资源研究院(36.05°N, 103.86°E)的多普勒激光测风雷达。该雷达由法国Leosphere公司生产, 型号为WindCube100S, 波长为1.54 µm, 探测高度从地面100~3000 m, 分辨率为50 m。该雷达已在世界不同地点与高塔或探空观测资料进行了对比, 结果表明该雷达观测结果与传统方法观测结果有很好的一致性(Devara et al, 2015; Ruchith et al, 2014)。选取2017年12月1日至2018年2月28日DBS扫描模式下获取的径向风速资料。观测期间雷达每小时进行一次DBS扫描, 每次持续4 min, 其中, 2017年12月23 -29日由于断电或数据传输等问题造成缺测。DBS扫描模式以75°固定仰角分别在北(0°)、 东(90°)、 南(180°)、 西(270°)以及垂直方向(90°仰角)5个方位发射激光波束, 每次垂直方向探测持续2 s左右, 其余四个方位均持续4 s左右, 完成一个完整的DBS扫描大概需要20 s, 每4 min时间段每个方向可获得10个径向风速。由于雷达信号信噪比随距离增加降低, 使观测数据有效率随着探测高度增高而减少(Vanderwende et al, 2015; 曹杨等, 2017), 为了保证所用数据在每个探测高度的连续性和质量, 本文只使用数据质量较好的100~800 m高度的风场数据。
2.1.2 再分析资料
为了研究兰州局地环流特征为主导时风场对污染物浓度的影响, 使用欧洲中期天气预报中心(ECMWF)ERA-Interim 再分析资料(https: //www.ecmwf.int/)对冬季影响兰州的天气形势进行分类。所用资料时段为2008 -2017年冬季(12月, 次年1 -2月), 时次为08:00(北京时, 下同), 空间分辨率为0.75°×0.75°, 根据何建军(2014)选取研究区域为25°N -47°N, 85°E -115°E的海平面气压作为天气分型对象。
2.1.3 污染物浓度资料
污染物浓度数据使用由全国城市空气质量实时发布平台(http: //106.37.208.233: 20035/)发布的2017年12月1日至2018年2月28日兰州市铁路设计院监测站点(距激光测风雷达2.64 km)的近地面NO2、 SO2、 CO、 PM10和PM2.5小时浓度数据, 并利用李苹等(2019)的方法, 对数据进行了严格的质量控制。
2.2 风廓线资料处理
激光雷达的性能受气溶胶后向散射、 大气折射率、 湍流、 湿度和降水等因素的影响, 分析前需对数据进行质量控制。本文按以下步骤对激光测风雷达径向风速数据进行处理:
(1) 只保留信噪比CNR≥-22 dB的径向风速[ , 其中, S是平均信号功率; N是平均噪声功率; CNR值越大数据越可靠](Boquet et al, 2016; Päschke et al, 2015; Vanderwende et al, 2015);
(2) 根据拉依达准则, 对每个高度, 剔除4 min时间段内超出区间 的径向风速, 其中µ为平均值, σ=1.4826 MAD, MAD=median[|vri-median(vr)|], 为径向风速(Bodini et al, 2017);
(3) 对每个方位4 min时间段内的径向风速求平均(Päschke et al, 2015), 根据 模式3D风矢量构建方法, 计算 、 v、 w分量;
经上述步骤后, 获得各层各时次均完整的水平风速、 风向廓线共48天(1152条廓线)。
2.3 天气分型方法
目前常用的客观天气分型方法有: 相关法、 主成分分析法(PCA)、 Fuzzy法、 聚类分析法和非线性法, Huth et al(1996, 2008)比较了上述5种方法对天气分型的适用性, 发现斜交旋转主成分分析法(T-PCA)和K平均聚类法(K-means)两者有较好的时空稳定性, 且T-PCA简化了数据结构, K-means对类别的区分效果更好, 因此本文结合T-PCA和K-means方法进行天气分型, 在以往研究中使用此方法对研究区域天气进行分型, 得到了较好的结果(He et al, 2018; 何建军等, 2016)。首先, 根据Huth(1996), 本文将研究区域1230个海平面气压格点作为矩阵的行, 90个观测时次作为列, 对数据进行标准化, 通过T-PCA提取对原数据累计方差贡献率超过一定百分比(本文取85%)的特征值所对应的前K个主成分, 本文得到了3个客观表达海平面气压场的主成分; 其次, 根据爬山法(刘丹等, 2011)确定聚类数, 再利用K-means对选取的3个主成分聚类确定天气类型。
3 结果分析与讨论
3.1 兰州冬季风场特征
3.1.1 不同高度水平风特征
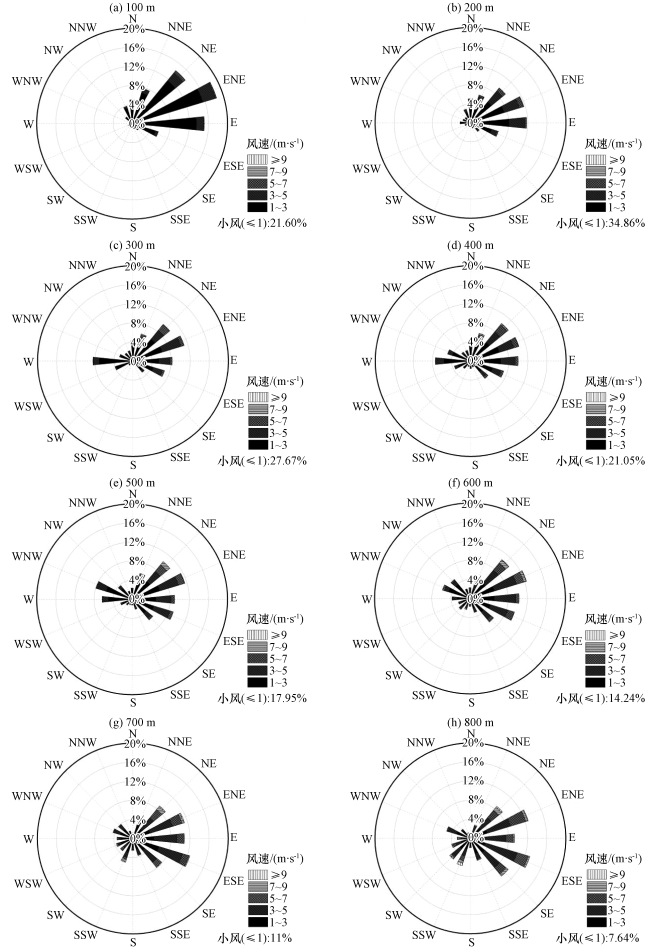
为了了解山谷城市冬季低空风场的垂直结构, 图1给出了激光测风雷达在100~800 m每隔100 m探测高度的水平风速、 风向玫瑰图。从图1中可以看出, 兰州冬季低空风场有明显的垂直变化特征, 总体上以偏东风为主, 随着高度的增加偏西风频率增加, 600 m以上偏南风频率增加, 随着高度的增加, 较大风速发生频率也增加。这种低层偏东风为主、 高层偏西风和偏南风增多的现象, 与兰州独特的地形有关。100~800 m各高度小风(水平风速≤1.0 m·s-1)(余金香等, 1985)发生频率分别为21.60%, 34.86%, 27.67%, 21.05%, 17.95%, 14.24%, 11.00%和7.64%, 其中400 m以下小风发生频率较高, 400 m以上小风发生频率随高度增高迅速减少。100 m和200 m高度风向比较稳定, 以偏东风为主, 100 m高度东北、 东东北和东风占比分别为14.40%, 18.51%和15.13%, 200 m高度东北、 东东北和东风占比分别为9.47%, 11.68%和11.77%, 200 m高度水平风速在3.0 m·s-1以上的频率较100 m略微增加。300, 400和500 m高度仍以偏东风为主, 但西风频率增加, 300 m高度西风占8.41%, 400 m高度西风占7.42%, 500 m高度西风占6.30%, 西西北风占7.97%。刘宇等(2002)也指出兰州低空西风频率随高度增高迅速增大, 静风频率随高度迅速减小。600~800 m高度偏东风占主导, 西风和西西北风频率较500 m迅速减小, 风速在3.0~9.0 m·s-1区间的频率增大。800 m东南和西南风较700 m明显增加分别占10.24%和5.66%。超过9.0 m·s-1的风速多发生在600 m以上东北和南西南方向。
3.1.2 风场日变化特征
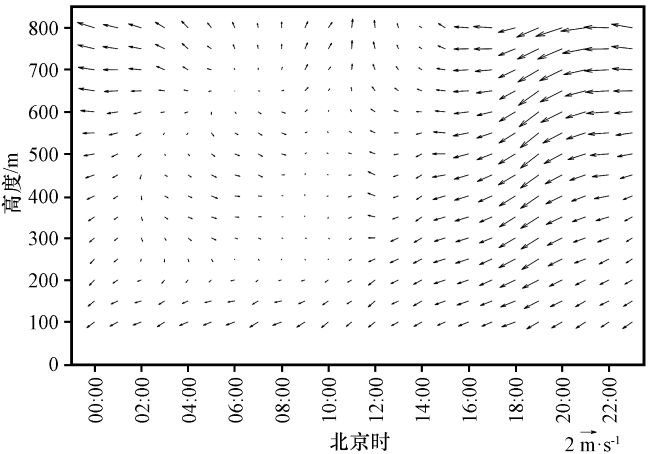
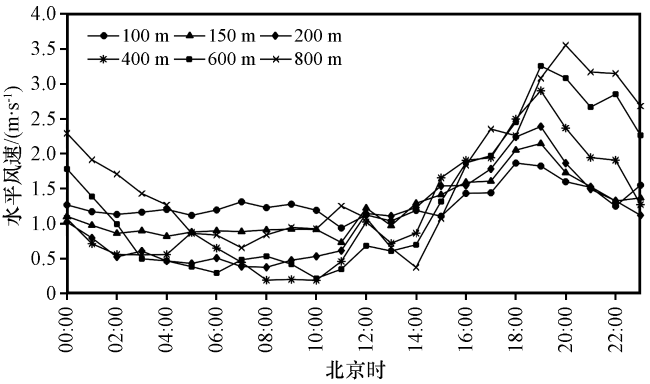
图2给出了2017年12月至2018年2月水平风场矢量高度-时间日变化, 图中的水平风场矢量是通过计算所有有效天数相同时刻和高度u和v的平均值, 再经过矢量合成得到的。从图2中可以看出, 风场存在明显的日变化, 且不同高度的日变化有所差异。总体上, 午后水平风速开始增大, 日落后1~2 h风速开始减小。02:00 -13:00各高度水平风速较小, 13:00 -20:00风速逐渐增大, 随高度增高水平风速增大, 20:00以后风速逐渐减小。结合不同高度水平风速日变化情况(图3)可以看出, 兰州冬季各高度水平风速的日变化呈单峰型。06:00 -10:00 150 m以上各层出现水平风速最小值, 午后随着地表加热, 湍流混合增强, 动量向下传递, 各高度水平风速迅速增大, 18:00 -20:00达到最大值, 且最大值随高度增高而增大, 出现时间随高度增高而推迟, 之后18:00 -20:00至次日06:00水平风速逐渐减小。对于风向, 在200 m高度以下全天以东风和东北风为主, 02:00 -10:00 200~300 m之间存在偏东风与偏西风的切变, 偏西风维持在250~650 m, 由于城市热岛效应西风很难到达山谷底部(季国良等, 1984), 存在风向转变时对应高度的水平风速较小。05:00 -12:00 600~700 m偏西风转为偏南风, 12:00至次日02:00上下层均为偏东风。可见, 使用高时空分辨率的激光测风雷达可以得到以往使用传统探测手段(靳建军, 2000; 刘宇等, 2002; 李晓霞等, 2017; 王海龙等, 1999)难以获取的精细化风场垂直结构和风场日变化信息, 加深了对山谷城市冬季风场特征的认识。
3.2 不同天气形势下的风场特征
为了解天气形势对山谷城市冬季低空风场的影响, 使结果更有统计意义, 结合T-PCA和K-means方法对2008 -2017年近10年冬季海平面气压场进行分类(Ye et al, 2016), 得到3种主要的天气型(图4)。第一类(Type1)为高压南部型, 此天气型在近10年冬季发生总频率为33.15%, 在2017年12月至2018年2月的发生频率为40.00%, 且多发生在1月份, 表现为冷高压位置偏北, 兰州位于冷高压南部外围区, 等压线密集, 气压梯度大, 在这种天气形势控制下, 兰州地区水平风速较大, 常伴随降温, 时有降雪发生。第二类(Type2)为弱高压型, 此天气型在近10年冬季发生总频率为28.71%, 在2017年12月至2018年2月的发生频率为23.33%, 多发生在12月份, 受地形影响, 蒙古高原至兰州以北为变性分裂的弱高压区, 兰州为弱高压控制, 气压梯度较小, 该类天气形势控制下兰州没有明显的天气过程, 背景环流场弱, 局地环流占主导, 以晴天为主, 水平风速较小(表1)。第三类(Type3)为低压型, 此天气型在近10年冬季发生总频率为38.14%, 在2017年12月至2018年2月的发生频率为36.67%, 多发生在1月份和2月份, 该类天气形势控制下兰州位于低压区, 气压梯度小, 偶有降雪发生。
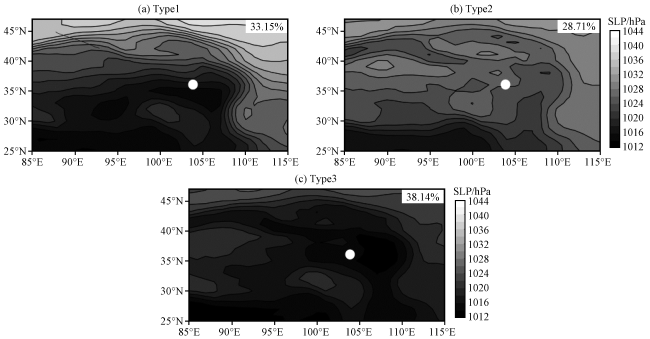
图4 2008 -2017年冬季不同天气形势平均海平面气压和发生频率白点为激光测风雷达位置 Fig.4 The mean sea level pressure and frequency of different weather types in winter from 2008 to 2017.White point is the position of the Wind Cube Scanning Lidar |
表1 2017年12月至2018年2月不同天气形势下兰州100 m平均水平风速和主要污染物平均浓度Table 1 Average wind speed at 100 m and average concentration of main pollutant in different weather types in Lanzhou from December 2017 to February 2018 |
| 天气类型 | 污染物平均浓度 | 风速/(m·s-1) | ||||
|---|---|---|---|---|---|---|
| NO2/(μg∙m-3) | SO2/(μg∙m-3) | CO/(mg∙m-3) | PM10/(μg∙m-3) | PM2.5/(μg∙m-3) | ||
| Type1 | 65.98 | 39.05 | 1.78 | 128.54 | 65.91 | 1.62 |
| Type2 | 98.73 | 61.24 | 3.35 | 224.18 | 92.47 | 1.01 |
| Type3 | 84.53 | 45.39 | 2.36 | 147.13 | 69.20 | 1.21 |
在Type1天气形势控制下, 200 m以下以大于1 m·s-1的东风为主, 其中16:00 -21:00风速大于2 m·s-1, 静风区出现在03:00 -08:00的250~700 m和13:00 -15:00的450~800 m[图5(a)]; 风向日变化比较稳定, 全天以偏东风为主, 只有06:00 -15:00在300 m以上有偏南风[图5(b)]; 全天以上升气流为主, 13:00 -14:00上升气流较强[图5(c)]。在Type2天气形势控制下, 14:00之前800 m以下风速均很小(<1 m·s-1), 14:00之后逐渐增大[图6(a)]; 02:00 -10:00, 250~700 m盛行西风, 比2017年12月至2018年2月平均风场的西风水平风速稍大, 持续时间更长, 厚度更大, 其余时刻盛行偏东风[图6(b)]; 受局地环流影响, 12:00-14:00表现为明显的下沉气流, 之后下沉气流逐渐减弱, 18:00至次日11:00为弱的上升气流[图6(c)]。在Type3天气形势控制下, 00:00 -11:00水平风速较小, 11:00以后水平风速逐渐增大[图7(a)]; 风向日变化与Type2相似, 但西风维持的时间短于Type2, 西风厚度也小于Type2[图7(b)]; 垂直风速日变化特征没有Type2明显, 全天以弱上升气流为主[图7(c)]。
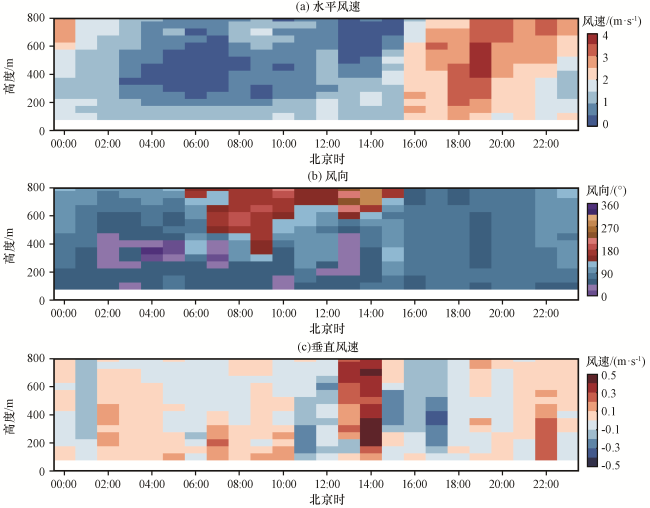
图5 2017年12月至2018年2月Type1风场日变化-高度图Fig.5 Diurnal variation of Type1 wind field with height from December 2017 to February 2018 |
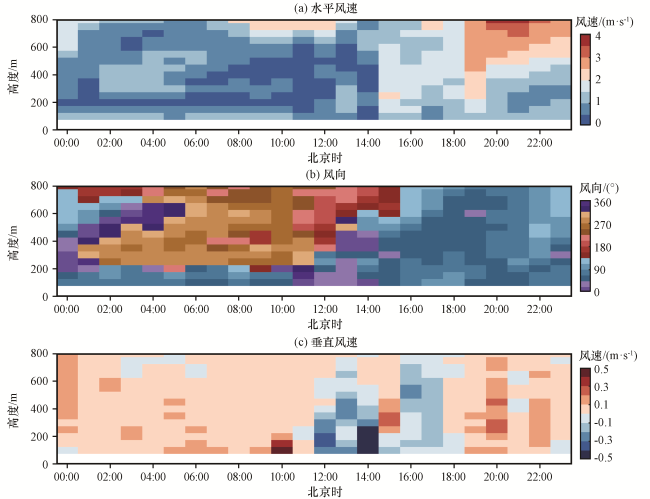
图6 2017年12月至2018年2月Type2风场日变化-高度图Fig.6 Diurnal variation of Type2 wind field with height from December 2017 to February 2018 |
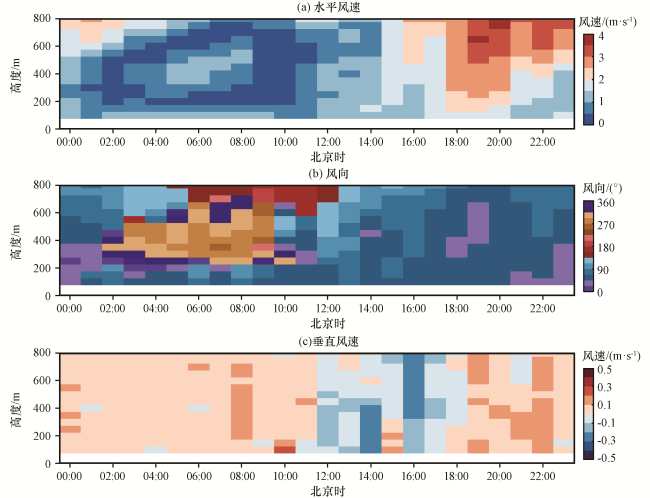
3.3 风场与污染物变化的关系
表1列出了2017年12月至2018年2月3种天气型下100 m平均水平风速和污染物平均浓度。从表1中可以看出, Type1天气型下100 m平均水平风速在3种天气型中最大, 为1.62 m∙s-1, 污染物平均浓度最低; Type2天气型下100 m平均水平风速在3种天气型中最小, 为1.01 m∙s-1, 污染物平均浓度最高; Type3天气型下100 m平均水平风速为1.21 m∙s-1, 污染物平均浓度介于Type1和Type2之间。由此可见, 在不同的天气背景下, 100 m平均水平风速和污染物浓度差异显著, 尤其在局地环流占主导的弱高压天气形势下(Type2), 兰州污染最为严重。因此探讨局地环流占主导时, 风场对污染物浓度的影响, 对认识重污染成因有重要意义。
08:00 -13:00, 800 m以下各高度水平风速较小, 是一天中风速最小的时段[图6(a)], 不利于污染物的扩散, 同时人类活动排放污染物增多, 因此在该时段污染物浓度呈上升趋势。12:00 -16:00, 受地形和太阳辐射影响, 在山峰加热和谷风环流作用下, 兰州城区有明显的下沉气流[图6(c)], 14:00下沉气流最强, 使大量低空污染物聚集在近地面, 加上较小的水平风速, PM2.5和NO2浓度达到峰值, 是一天中污染最严重的时段。14:00以后, 边界层内湍流混合增强, 水平风速逐渐增大[图6(a)], 上下层风向一致均盛行偏东风[图6(b)], 形成“通道效应”有利于污染物的扩散(季国良等, 1984), 下沉气流强度也逐渐减弱, 并转变为上升气流[图6(c)]。水平风速的增大和下沉气流减弱、 上升气流加强使污染物浓度降低到谷值, 是一天中污染最轻的时段。18:00至次日10:00, 谷中主要为弱的上升气流, 污染物浓度维持在一定水平。
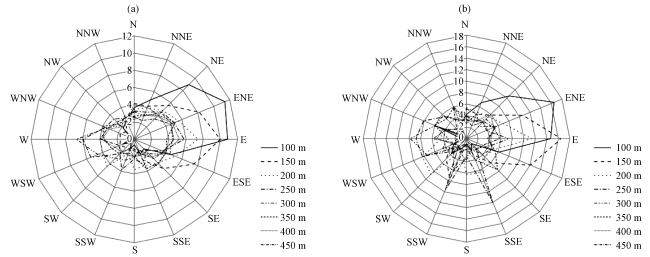
污染系数是某一地区某方位风向频率与该方位平均风速的比值, 其值越大说明该方位下风向污染越严重(徐永清等, 2014)。利用激光测风雷达获取的多层风速和风向资料, 可计算不同高度的污染系数。图9给出了450 m以下各高度污染系数。从图9中可以看出, 200 m及以下污染系数最大的风向为东东北和东, Type2天气型下, 该方向污染系数远大于整个冬季平均; 200 m以上污染系数较大的风向较分散, 随高度增加, 污染系数较小的风向区间增加。增加排放高度至200 m以上可以有效减少兰州城区近地面的大气污染物浓度。
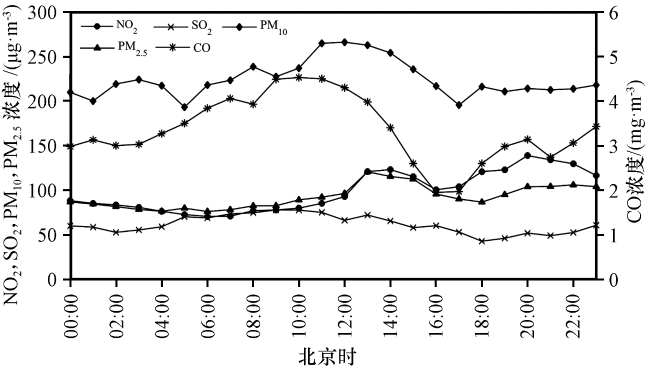
图8 2017年12月至2018年2月兰州Type2天气形势下主要污染物浓度日变化Fig.8 Diurnal variation of main pollutant concentration in Type2 weather type in Lanzhou from December 2017 to February 2018 |


4 结论与讨论
(1) 兰州城区2017年12月至2018年2月低空风场整体特征为平均水平风速较小, 平均风向稳定, 以偏东风为主导。300~500 m西风频率迅速增大, 500 m以上逐渐减小。受地形影响, 低空风场日变化明显, 午后至傍晚水平风速大于其他时刻; 03:00 -08:00在250~650 m维持偏西风, 其余时刻各高度均为偏东风。
(2) 兰州冬季主要受高压南部型、 弱高压型和低压型三种天气形势影响。弱高压型天气形势下, 兰州城区以局地环流为主, 污染严重, 污染物浓度日变化受低空风场环流影响明显。
(3) 各高度污染系数最大值对应的风向存在差异, 200 m以上污染系数迅速减小, 增加污染物的排放高度至200 m以上可有效减少近地面污染物浓度。
本文研究结果为深入认识兰州冬季风场细微结构以及局地环流主导下风场对污染物扩散的影响提供了重要参考, 但激光测风雷达在近地层存在探测盲区, 并且研究时段缺少同步温、 湿廓线观测数据, 未深入分析大气稳定度与风场的相互作用, 今后将结合数值模拟, 对此进行深入探究。