
1 引言
2 资料来源及方法介绍
2.1 资料来来源及试验设计
表1 五种云微物理方案的预报量Table 1 Forecast variables of five cloud microphysical schemes |
| 云微物理方案 | 质量变量/(kg·kg-1) | 数浓度变量/kg-1 |
|---|---|---|
| NSSL 1-momlfo | q c、 q r、 q i、 q s、 q g | 无 |
| Morrison | q c、 q r、 q i、 q s、 q g | N r、 N i、 N s、 N g |
| Thompson | q c、 q r、 q i、 q s、 q g | N i、 N r |
| WDM6 | q c、 q r、 q i、 q s、 q g | N n、 N c、 N r |
| HUJI fast | q c、 q r、 q i、 q s、 q g | N c、 N r、 N s、 N i、 N g、 N n |
q为混合比, N为数浓度, 下标c、 r、 i、 s、 g、 n分别代表云水、 雨水、 云冰、 雪、 霰和云凝结核 |
2.2 云微物理参数化方案和模拟雷达回波算子
3 天气形势
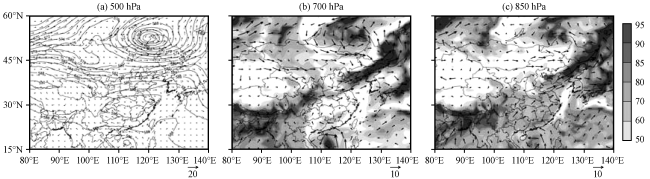
图1 2016年7月26日08:00 风场(a~c, 矢量, 单位: m·s-1)与500 hPa位势高度场(a, 黑色实线, 单位: dagpm)以及700 hPa(b)和850 hPa(c)相对湿度(阴影, 单位: %)Fig.1 The wind filed (a~c, vector, unit: m·s-1) and the geopotential height at 500 hPa (a, black solid lines, unit: dagpm) and the relative humidity (the shaded, unit: %) at 700 hPa (b) and 850 hPa (c) at 08:00 on 26 July 2016 |
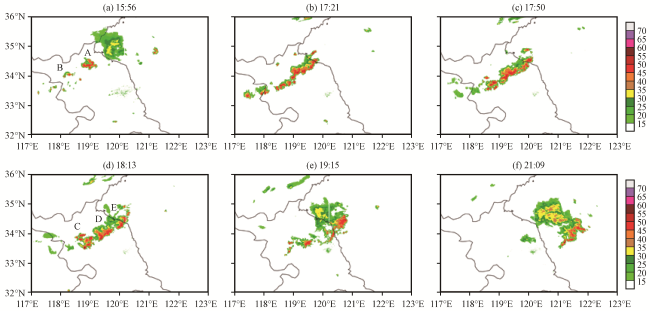
4 实况雷达回波分析
5 结果与分析
5.1 雷达回波
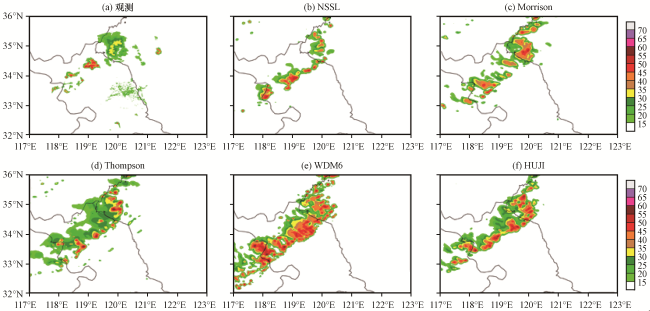
图4 2016年7月26日16:00不同云微物理方案模拟的雷达组合反射率(单位: dBz)Fig.4 The radar composite reflectivity with different cloud microphysics schemes at 16:00 on 26 July 2016.Unit: dBz |
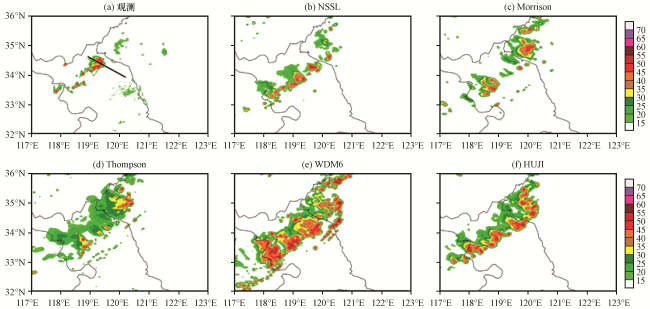
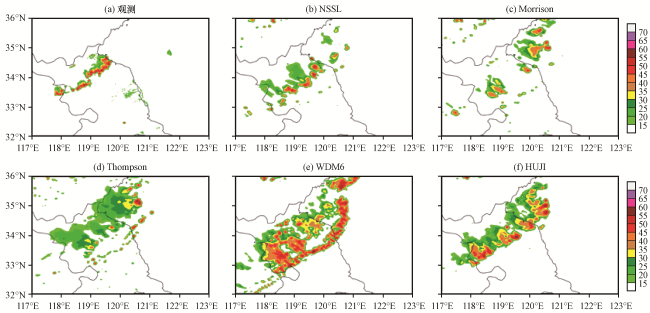
图5 2016年7月26日16:30不同云微物理方案模拟的雷达组合反射率(单位: dBz)(a)中黑色线段AB为后文中提到剖面位置 Fig.5 The radar composite reflectivity with different cloud microphysics schemes at 16:30 on 26 July 2016.Unit: dBz.The black line AB in Fig.5(a) is the section position mentioned later |
5.2 动力和热力特征
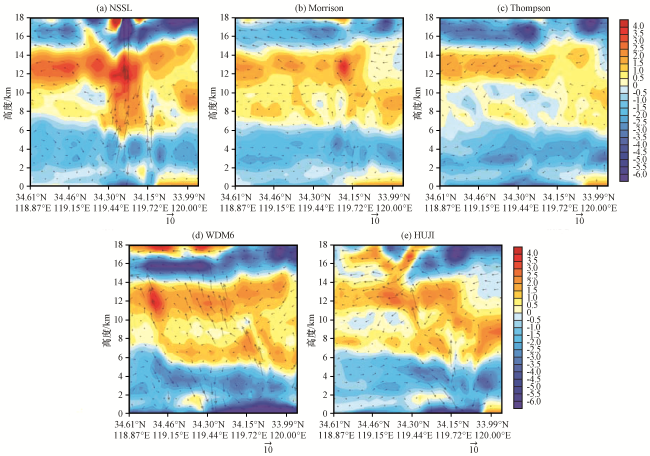
图8 不同云微物理方案模拟的2016年7月26日16:30相对风暴风场[矢量, (u, v, 10w), 单位: m·s-1]和扰动位温(彩色区, 单位: K)沿图5(a)中线段AB的垂直剖面图Fig.8 The vertical cross section of storm-relative wind field [vector, (u, v, 10w), unit: m·s-1] and potential temperature perturbation (color area, unit: K) along the line AB in Fig.5 (a) with different cloud microphysics schemes at 16:30 on 26 July 2016 |
5.3 水成物及潜热释放的垂直分布
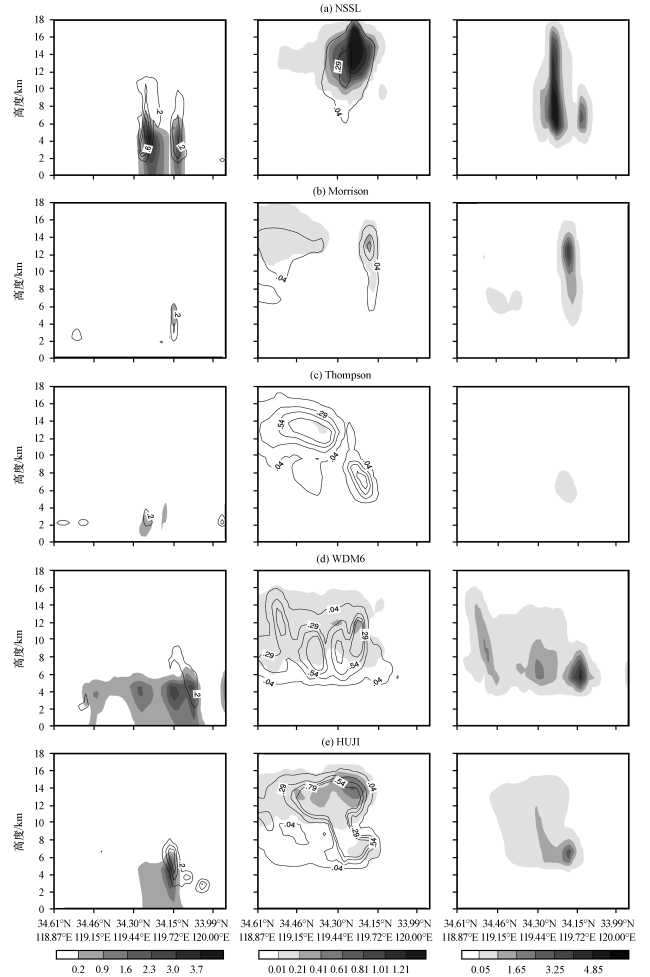
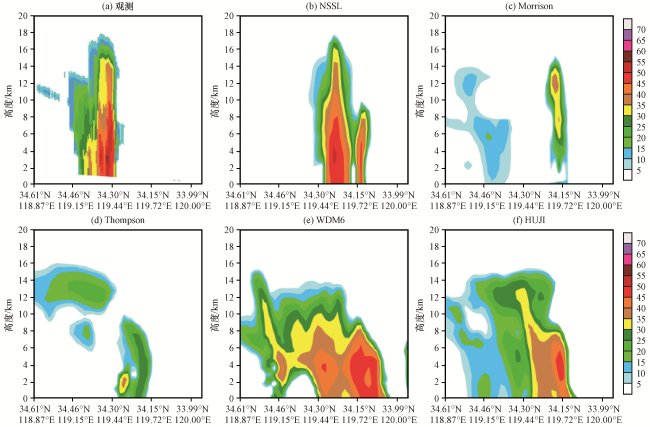
图9 不同云微物理方案模拟的2016年7月26日16:30雨(阴影区)和云水(等值线)(左)、 冰(阴影区)和雪(等值线)(中)以及霰(右)沿图5(a)中线段AB的垂直剖面(单位: g·kg-1)Fig.9 The vertical cross section of rain (shade) and cloud droplets (contour line) (left), ice (shade) and snow (contour line) (middle) and graupel (right) along the line AB in Fig.5 (a) with different cloud microphysics schemes at 16:30 on 26 July 2016.Unit: g·kg-1 |