

1 引 言
2 资料简介
3 暴雨过程概况
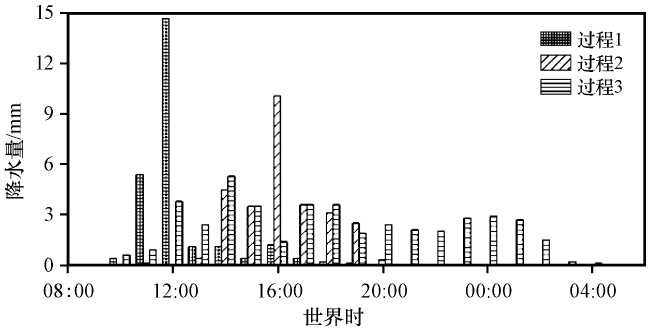
图1 2015年6月9日08:00至10日06:00(过程1)、 6月27日08:00至28日06:00(过程2)和2015年10月2日08:00至3日06:00(过程3)乌鲁木齐地面逐小时降水量Fig.1 Ground hourly precipitation in Urumqi from 08:00 on 9 to 06:00 on 10 June 2015 (Process 1), from 08:00 on 27 to 06:00 on 28 June 2015 (Process 2), and from 08:00 on 2 to 06:00 on 3 October 2016 (Process 3) |
4 环流特征
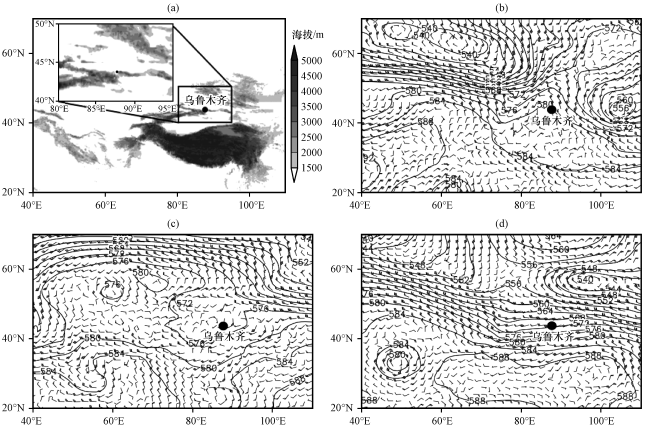
图2 研究区概况(a)与2015年6月9日12:00(b)、 6月27日12:00(c)和2016年10月2日12:00(d)500 hPa位势高度场(等值线, 单位: dagpm)和风场(风羽, 单位: m·s-1)分布Fig.2 Research area overview (a), geopotential height field (contour, unit: dagpm) and wind field (barb, unit: m·s-1) at 500 hPa at 12:00 on 9 June 2015 (b), at 12:00 on 27 June 2015 (c) and at 12:00 on 2 October 2016 (d) |
5 水汽和热动力条件
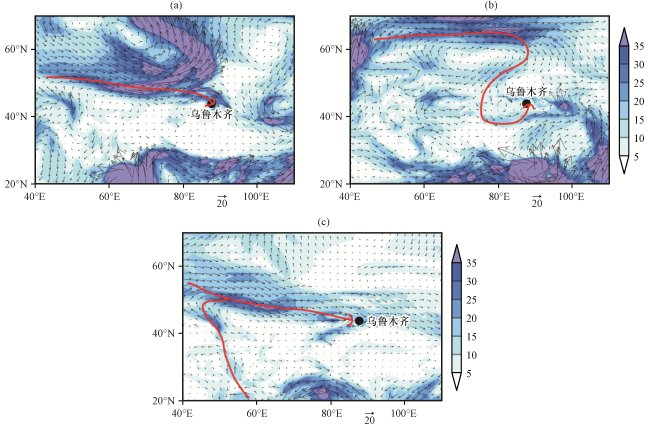
图3 2015年6月9日12:00(a)、 6月27日12:00(b)和2016年10月2日12:00(c)地面至300 hPa水汽通量的垂直积分(彩色区和矢量, 单位: g·hPa-1·cm-1·s-1)红色箭头线代表水汽通量输送路径 Fig.3 Vertical integral of water vapor flux from surface to 300 hPa (color area and vector, unit: g·hPa-1·cm-1·s-1) at 12:00 on 9 June 2015 (a), at 12:00 on 27 June 2015 (b) and at 12:00 on 2 October 2016 (c).The red arrow line represents the transport path of the water vapor flux |
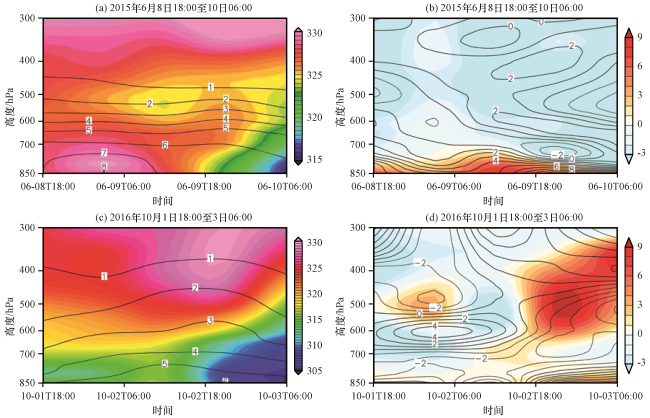
图4 2015年6月8日18:00至10日06:00(a, b)、 2016年10月1日18:00至3日06:00(c, d)沿乌鲁木齐的比湿(等值线, 单位: g·kg-1)和θ se(彩色区, 单位: K)(a, c)及涡度(彩色区, 单位: ×10-5 s-1)和散度(等值线, 单位: ×10-5 s-1)(b, d)的时间-高度剖面Fig.4 The height-time sections of specific humidity (contour, unit: g·kg-1) and θ se (color area, unit: K) (a, c), and the height-time sections of vorticity (color area, unit: ×10-5 s-1) and divergence (contour, unit: ×10-5 s-1) (b, d) along Urumqi from 18:00 on 8 to 06:00 on 10 June 2015 (a, b) and 18:00 on 1 to 06:00 on 3 October 2016 (c, d) |
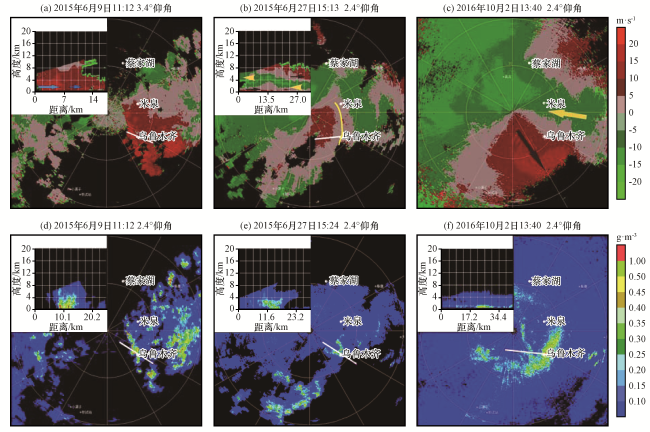
图5 三次暴雨期间乌鲁木齐多普勒天气雷达径向速度及其剖面(a~c, 单位: m·s-1)和垂直累积液态水含量密度D VIL及其剖面(d~f, 单位: g·m-3)白色实线为剖面位置, 剖面图为沿白色实线自西向东所剖而成; 蓝色大(小)箭头表示大(小)风速; 黄色弧线代表辐合线; 黄色(黑色)箭头表示吹向(远离)雷达站的风 Fig.5 Velocity and cross section of velocity (a~c, unit: m·s-1), density of vertically integrated liquid water and corresponding cross section (unit: g·m-3) from Urumqi radar during the three rainstorms.The white solid line is the position of the section, the cross section is taken along the white solid line from west to east; Large (small) blue arrows indicate large and small wind speeds, respectively; The yellow arc represents the convergence line; The yellow (black) arrow indicates the wind blowing towards (away) the radar station |
6 中尺度系统分析
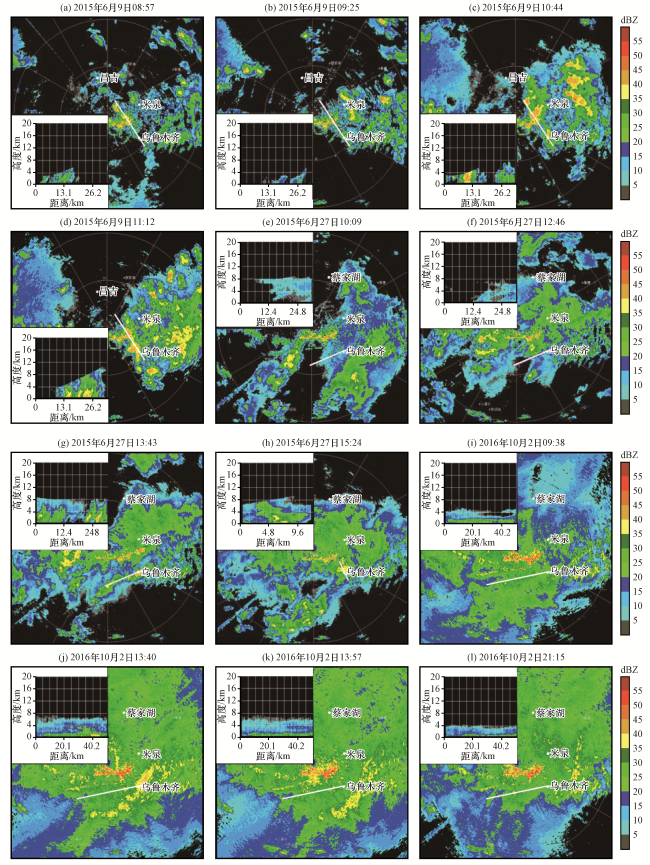
图7 三次暴雨期间乌鲁木齐多普勒天气雷达组合反射率因子CR和反射率因子R剖面(单位: dBZ)白色实线为剖面位置, 剖面图为沿白色实线自西向东所剖而成 Fig.7 Composite reflectivity factor and cross section of reflectivity from Urumqi radar during the three rainstorms.Unit: dBZ.The white solid line is the position of the section, the cross section is taken along the white solid line from west to east |
7 大气垂直结构分析
7.1 大气水平风场垂直结构特征
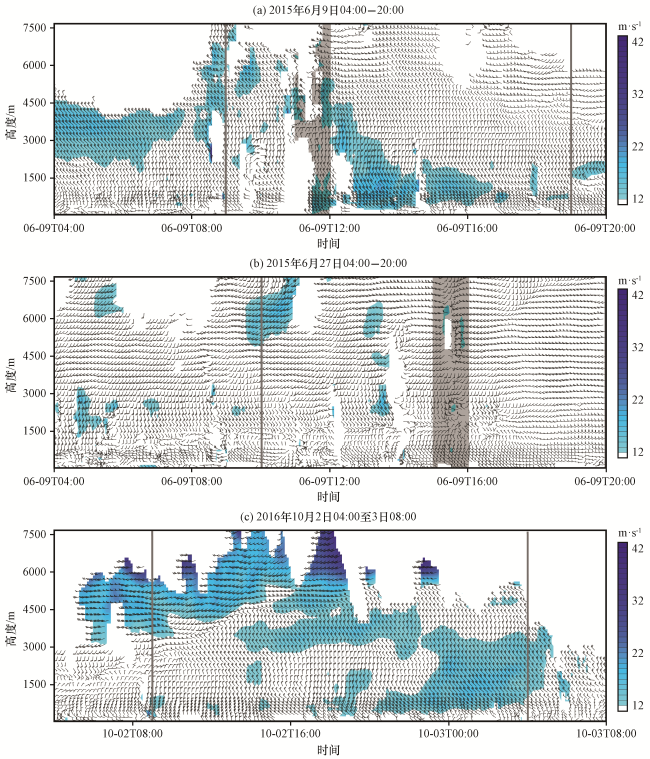
图8 乌鲁木齐两类暴雨期间风廓线雷达水平风场时间-高度演变(单位: m·s-1)灰色实线对应暴雨开始和结束时刻, 灰色阴影区对应短时强降水过程 Fig.8 Time-height charts of horizontal winds field during two types of rainstorms in Urumq.Unit: m·s-1.The gray solid line position corresponds to the time of rainstorm start and end, and the gay shaded area position corresponds to the time of short-term strong precipitation occurrence |
7.2 大气相对湿度垂直结构特征
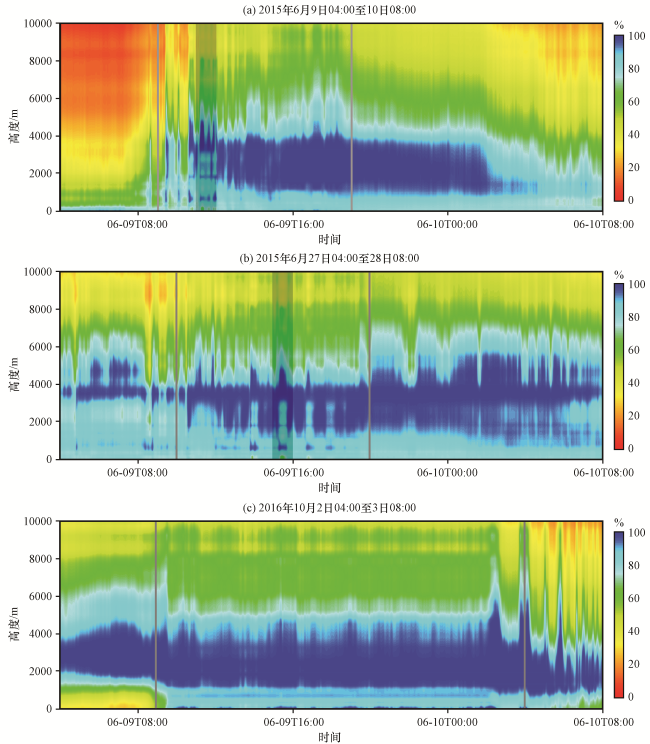


图9 乌鲁木齐三次暴雨期间地基微波辐射计相对湿度时间—高度演变(单位: %)灰色实线对应暴雨开始和结束时刻, 灰色阴影区对应短时强降水过程 Fig.9 Time-height charts of relative humidity during the three rainstorm processes in Urumq.Unit: %.The gray solid line position corresponds to the time of rainstorm start and end, and the gay shaded area position corresponds to the time of short-term strong precipitation occurrence |