

1 引言
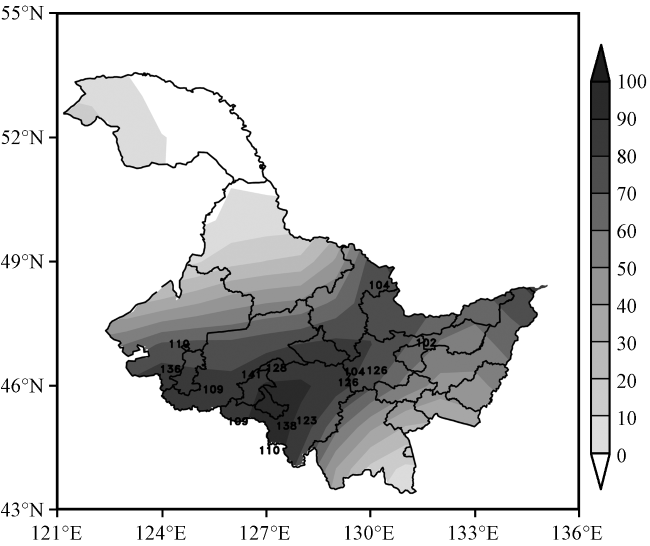
2 降水实况
3 环流演变特征与降水关系
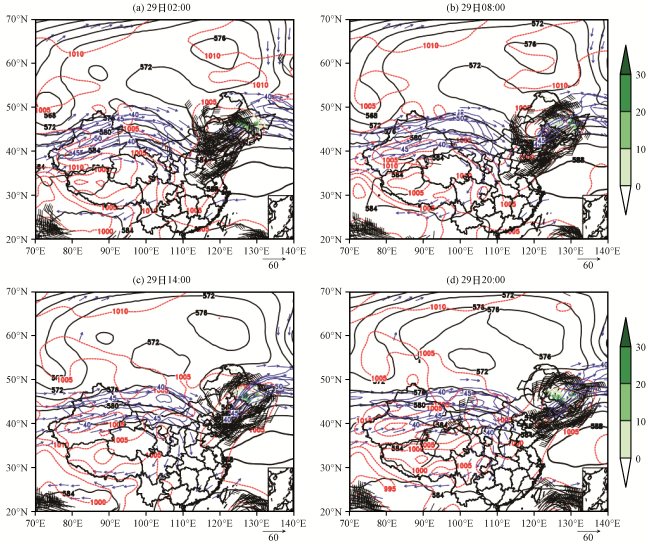
图2 2012年7月29日02:00 -20:00环流形势黑色实线为500 hPa位势高度场(单位: dagpm); 红色虚线为海平面气压场(单位: hPa); 蓝色箭头为风速大于20 m·s-1的200 hPa风场(单位: m·s-1); 蓝色细实线为200 hPa风速大于40 m·s-1的等值线; 阴影代表6 h降水量(单位: mm) Fig.2 The weather pattern from 02:00 to 20:00 on 29 July 2012.Black counter denote geopotential height at 500 hPa (unit: dagpm); Red counter denote sea level pressure (unit: hPa); Blue vectors denote wind speed ≥20 m·s-1 at 200 hPa (unit: m·s-1); Blue counter denote wind speed ≥40 m·s-1 at 200 hPa; The shaded denote 6 hourly precipitation (unit: mm) |
4 垂直环流结构
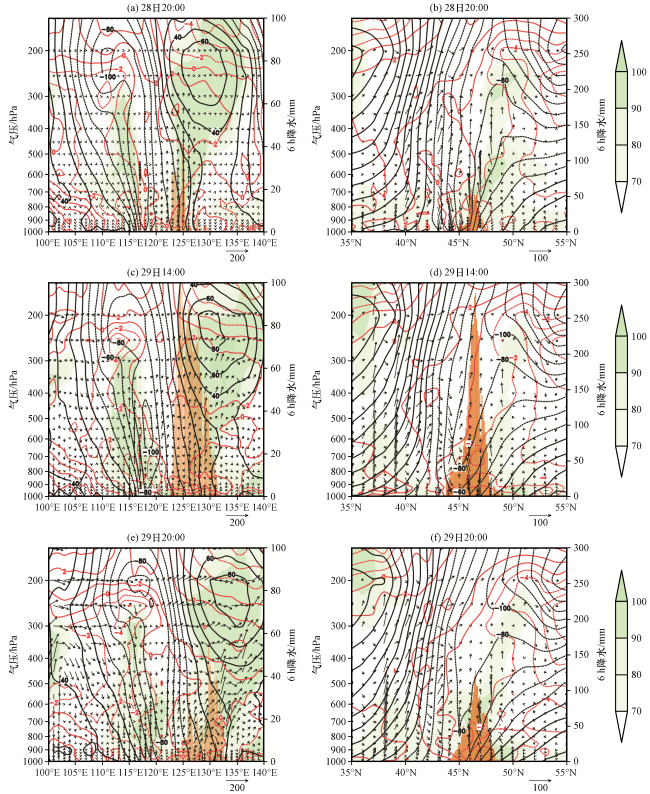
图3 2012年7月28日20:00至29日20:00垂直环流的纬向(左)、 经向(右)-高度剖面黑线为高度距平等值线(单位: dagpm); 红线为温度距平等值线(单位: ℃); 阴影表示相对湿度大于70%的区域; 矢量代表ω×100与u的合成(单位: m·s-1); 橙色柱状线条代表同一经、 纬度上6 h累积降水量分布(单位: mm) Fig.3 The zonal (left) and meridional (right)-vertical section of air circulation from 20:00 on 28 to 20:00 on 29 July 2012.Black counter denote height anomaly field (unit: dagpm); Red counter denote temperature anomaly field (unit: ℃); The shaded denote the area of humility ≥70%; Vectors denote composition of ω×100 and u (unit: m·s-1), and orange bar denote 6 hourly precipitation accumulation (unit: mm ) |
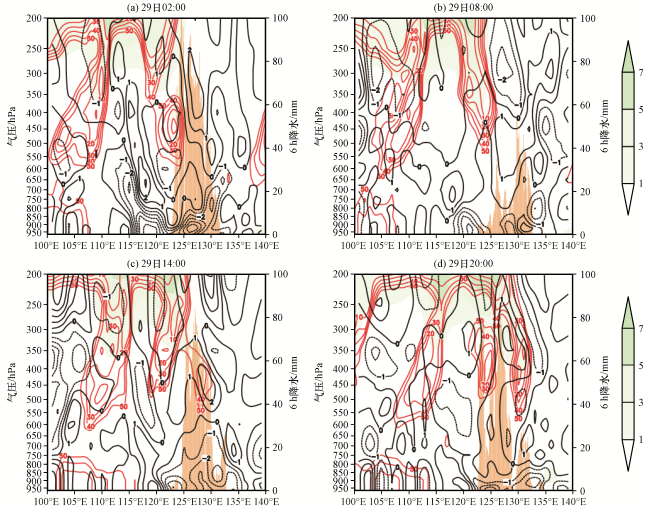
图4 2012年7月29日02:00 -20:00各物理量场的纬向-高度剖面黑色线为散度场(单位: ×10-5 s-1); 阴影为等位涡线(单位:1 PVU=1×10⁻⁶ m2·K·s-1·kg-1); 红色线表示相对湿度小于等于50%的区域; 橙色柱状线条代表同一经、 纬度上6 h累积降水量分布(单位: mm) Fig.4 The zonal -vertical section of variables from 02:00 to 20:00 on 29 July 2012.Black counter denote divergence field (unit: ×10-5 s-1); The shaded denote PV field (unit:1 PVU=1×10⁻⁶ m2·K·s-1·kg-1); Red counter denote the area of humility≤50%; Orange bar denote 6 hourly precipitation accumulation (unit: mm) |
5 水汽输送分析
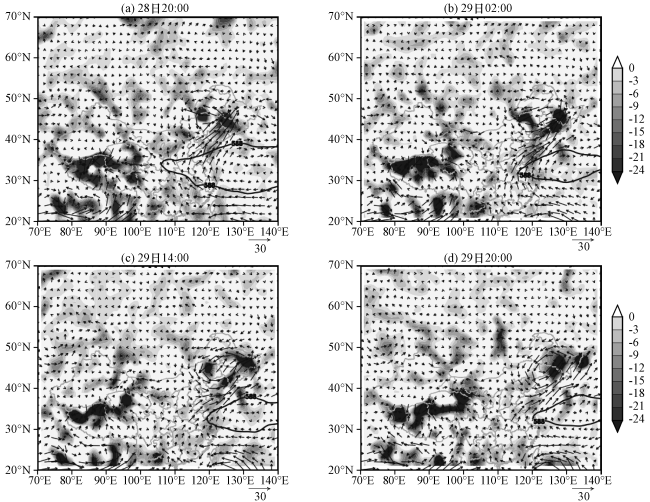
图5 2012年7月28日20:00至29日20:00整层水汽通量[矢量, 单位: g·(cm·s)-1]及水汽通量散度[阴影区, 单位: ×10-6 g·(cm2·s)-1]分布黑色等值线为500 hPa上588 dagpm线 Fig.5 The distribute of moisture flux [vector, unit: g·(cm·s)-1] and its divergence [the shaded, unit: ×10-6 g·(cm2·s)-1] from 20:00 on 28 to 20:00 on 29 July 2012.The black counter is 588 dagpm geopotential height at 500 hPa |
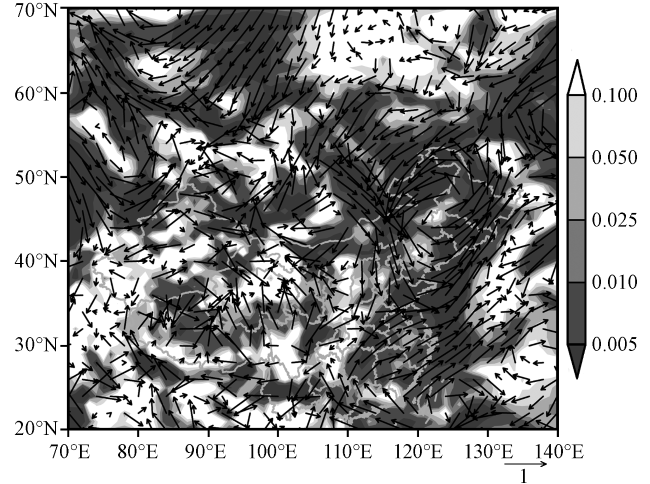
图6 2012年7月28日08:00至31日20:00黑龙江省6 h平均降水与1000~300 hPa整层水汽通量分量(qu, qv)的相关合成矢量场矢量箭头代表相关合成矢量场; 阴影代表相关合成矢量大小通过0.1、 0.05、 0.025、 0.01、 0.005等显著性水平的区域 Fig.6 The correlated vector field between integrated water apor flux (qu, qv) from 1000 hPa to 300 hPa and 6 hourly precipitation from 08:00 on 28 to 20:00 on 31 July 2012.Vectors represent correlated vector field; Shaded areas represent the regions where the correlation coefficient passed the significance level of 0.1, 0.05, 0.025, 0.01, 0.005, etc. |
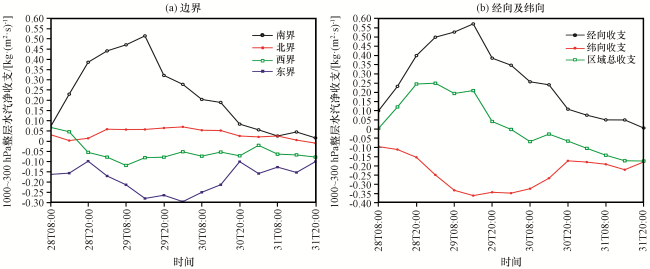
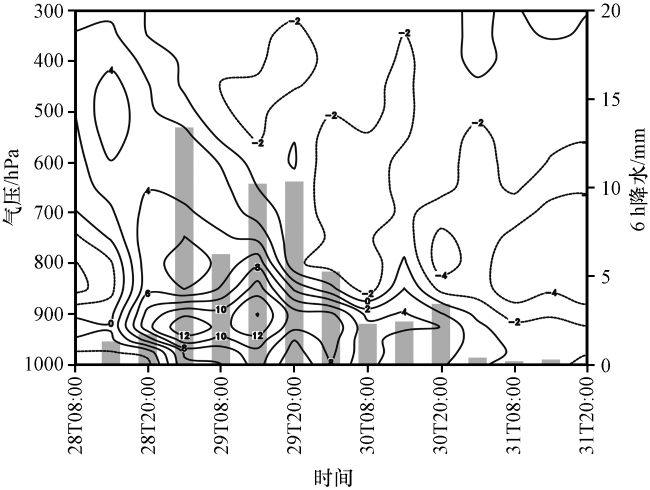
图8 2012年7月28日08:00至31日20:00黑龙江省(121°E -136°E、 43°N -55°N)6 h区域平均降水(柱状)及1000~300 hPa水汽净收支[黑线, 单位: ×10-3 kg·(m2·s)-1]的时间序列实线代表水汽净收入, 虚线代表净支出 Fig.8 The time series of 6 hourly regional average precipitation (gray bar) and the temporal-vertical section of water vapor budget [black line, unit: ×10-3 kg·(m2·s)-1] between 1000 hPa and 300 hPa in Heilongjiang province from 08:00 on 28 to 20:00 on 31 July 2012.The dashed line represents water vapor expend and solid represents income |
6 不稳定能量变化特点
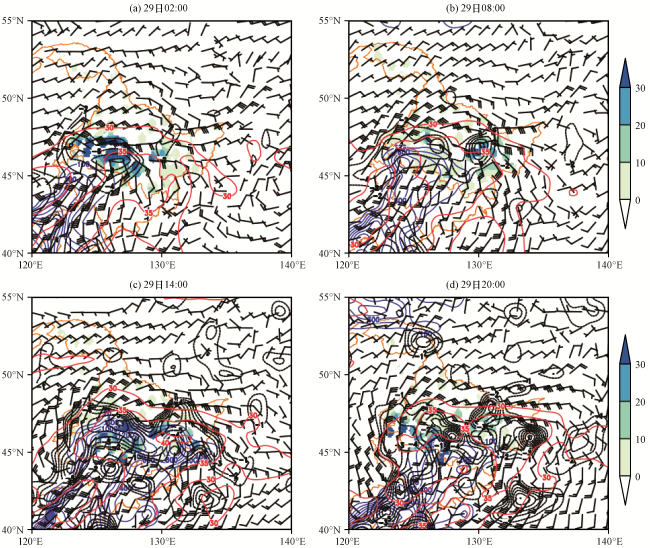


图9 2012年7月29日02:00 -20:00不稳定条件及6 h降水分布的关系黑线为950 hPa散度(单位: ×10-5 s-1); 红线为K指数(单位: ℃); 蓝色实线为CAPE等值线(单位: J·Kg-1); 风向杆为950 hPa风场(单位: m·s-1); 阴影表示6 h降水量(单位: mm) Fig.9 The distribute of unstable condition and 6 hourly precipitation from 02:00 to 20:00 on 29 July 2012.The black counters represent divergence at 950 hPa (unit: ×10-5 s-1); Red counters represent K index (unit: ℃); blue counter represent the CAPE (unit: J·Kg-1); Vector denote wind field at 925 hPa (unit: m·s-1); The shaded represent 6 hourly precipitation (unit: mm) |