
1 引言
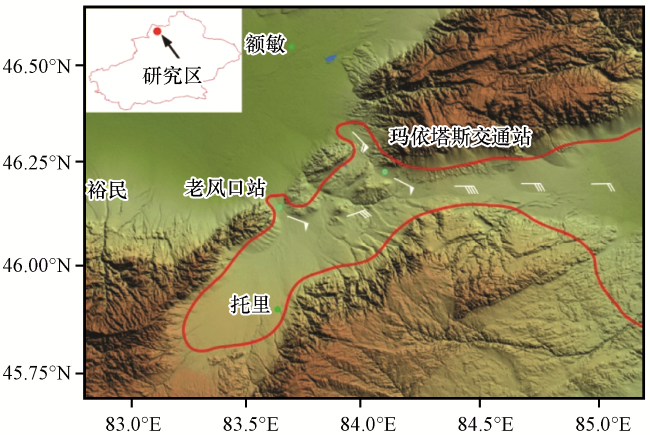
2 研究区概况
3 资料来源与方法介绍
3.1 资料来源
3.2 方法介绍
表1 2015 -2018年冬季玛依塔斯风区东风型风吹雪个例及天气学分型Table 1 Cases of the easterly wind-blown snow in the Mayetas wind zone in the winter of 2015 -2018 and the weather classification |
| 序号 | 风吹雪 日期 | 救助 车辆 /辆 | 救助 人员 /人 | 影响公路 路段 | 前期 降雪 量/mm | 风吹雪 时积雪 深度/cm | 降雪与东风吹雪 间隔/h | 天气学分型 | |
|---|---|---|---|---|---|---|---|---|---|
| 地面形势分型、 地面高压路径 | 高空环流类型 | ||||||||
| 1 | 2015年12月1 -2日 | 37 | 132 | G3015线 | 1.9 | 无数据 | 23 | 回流型、 西方 | 低槽东移类 |
| 2 | 2016年1月11日 | 28 | 81 | G3015线 | 4.8 | 25 | 45 | 回流型、 西方 | 低槽东移类 |
| 3 | 2016年2月12 -13日 | 123 | 502 | S201、 G3015线 | 3.5 | 32 | 48 | 回流型、 西方 | 低槽东移类 |
| 4 | 2016年12月25日 | 62 | 267 | S201线 | 6.4 | 28 | 26 | 回流型、 西方 | 低槽东移类 |
| 5 | 2016年1月16日 | 101 | 417 | S201线 | 0.3 | 23 | 20 | 回流型、 西方 | 横槽转竖类 |
| 6 | 2016年1月22日 | 49 | 155 | S201、 G3015线 | 2.2 | 26 | 48 | 回流型、 北方 | 横槽转竖类 |
| 7 | 2018年12月28日 | 25 | 89 | S201线 | 9.7 | 21 | 120 | 回流型、 西北 | 横槽转竖类 |
| 8 | 2016年2月6日 | 12 | 41 | G3015线 | 0.6 | 30 | 6 | 回流型、 西方 | 中纬度波动类 |
| 9 | 2016年3月16日 | 13 | 43 | G3015线 | 9.7 | 2 | 7 | 回流型、 西北 | 中纬度波动类 |
| 10 | 2016年12月12日 | 32 | 193 | G3015线 | 4.3 | 24 | 25 | 锋前减压型、 西南 | 中纬度波动类 |
| 11 | 2016年12月14日 | 37 | 122 | S201线 | 0.8 | 20 | 14 | 锋前减压型、 西南 | 中纬度波动类 |
| 12 | 2016年12月16日 | 27 | 85 | S201线 | 0.8 | 21 | 60 | 锋前减压型、 西南 | 中纬度波动类 |
| 13 | 2016年12月23日 | 34 | 166 | S201线 | 6.4 | 18 | 20 | 锋前减压型、 西方 | 低槽东移类 |
| 14 | 2018年1月15日 | 10 | 37 | S201线 | 2.2 | 18 | 7 | 锋前减压型、 西北 | 低槽东移类 |
| 15 | 2016年11月13 -14日 | 145 | 542 | S201线 | 29.3 | 22 | 24 | 暖区降雪+回流型、 西北 | 西北强锋区南压 |
前期降雪量和风吹雪时积雪深度为距玛依塔斯风区最近的额敏县国家气象站资料 |
4 天气学分型
4.1 回流型
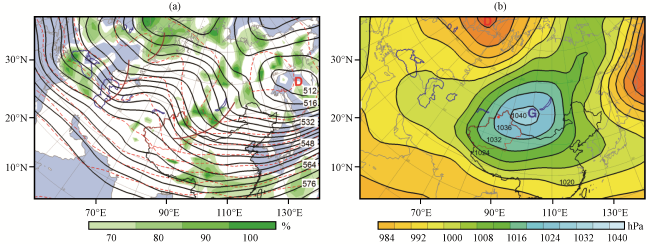
图2 2015 -2018年玛依塔斯9场回流型东风吹雪时500 hPa平均合成位势高度场(a, 黑色等值线, 单位: dagpm)和地面平均合成气压场(b, 等值线和彩色区, 单位: hPa)(a)红虚线为500 hPa温度场(单位: ℃), 绿色阴影为850 hPa相对湿度场(单位: %), 棕色短实线为槽线, “D”表示位势高度“低中心”; (b)“D”和 “G”表示“低压中心”和“高压中心”; 深蓝色实线为海域边界, 红色“·”为玛依塔斯交通气象站位置 Fig.2 The 500 hPa average synthetic geopotential height field (a, black contour, unit: dagpm) and the ground average synthetic pressure field (b, contour and color area, unit: hPa ) when the 9 recirculation easterly winds blow snow in Mayitas from 2015 to 2018.The red dotted line is the 500 hPa temperature field (unit: ℃), the green shade is the 850 hPa relative humidity field (Unit: %), the brown short solid line is the trough line, "D" represents the "low center" of the geopotential height in Fig.2 (a)."D" and "G" indicate "low pressure center" and "high pressure center" in Fig.2(b).The dark blue solid line is the sea area boundary, and the red "·" is the location of the Mayitas Traffic Weather Station |
4.1.1 横槽转竖类
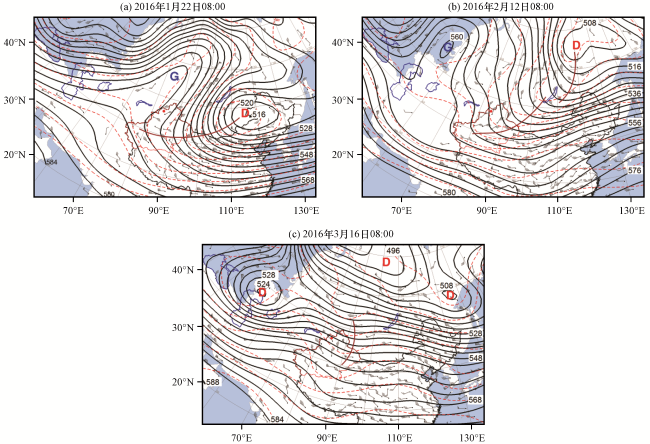
图3 玛依塔斯“回流型”东风吹雪时横槽转竖类(a)、 低槽东移类(b)和中纬度波动类(c)的500 hPa位势高度场(黑色等值线, 单位: dagpm)红虚线为等温线(单位: ℃), 风羽代表风场(单位: m·s-1), 棕色短实线为槽线, “D”和 “G”表示位势高度“低中心”和“高中心”, 深蓝色实线为海域边界, 红“·”为玛依塔斯交通站位置 Fig.3 The geopotential height field (black contour) of the 500 hPa horizontal trough turning to vertical (a), the low trough shifting eastward (b), and the mid-latitude fluctuation (c) when the Mayitas "reflux type" east wind blows snow.Unit: dagpm.The red dotted line is the isotherm (unit: ℃), the wind plume represents the wind field (unit: m·s-1), and the brown short solid line is the groove line, "D" and "G" indicates respectively the geopotential height "low center" and "high center", the dark blue solid line is the sea area boundary, and the red dot is the location of the Maitas traffic station |
4.1.2 低槽东移类
4.1.3 中纬度波动类
4.2 锋前减压型
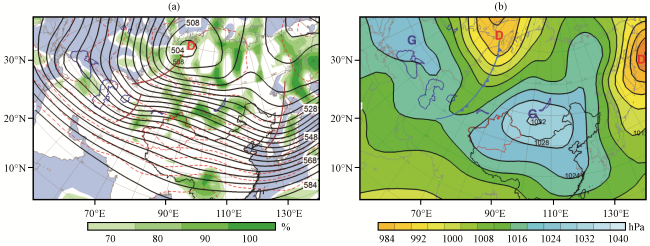
图4 2015 -2018年玛依塔斯5场“锋前减压型”东风吹雪时500 hPa平均合成位势高度场(黑色等值线, 单位: dagpm)、 温度场(红虚线, 单位: ℃)和850 hPa相对湿度场(彩色区, 单位: %)(a)与地面平均合成气压场(b, 等值线和彩色区, 单位: hPa)(a)中棕色短实线为槽线, “D”表示位势高度“低中心”; (b)中蓝色三角实线为冷锋, “D”和 “G”表示“低压中心”和“高压中心”; 深蓝色实线为海域边界, 红色“·”为玛依塔斯交通站位置 Fig.4 The average composite geopotential height field (black contour, unit: dagpm), temperature field (red dotted line, unit: ℃) at 500 hPa, and the relative humidity field at 850 hPa (color area, unit: %) (a), and the ground average composite pressure field (b, contour and color area, unit: hPa) during the five "forward decompression" east winds blowing snow at Mayitas from 2015 to 2018.The brown short solid line is the trough line, and "D" represents the geopotential height "low center" in Fig.4 (a).The solid blue triangle line is the cold front, "D" and "G" mean "low pressure center" and "high pressure center" in Fig.4 (b).The dark blue solid line is the boundary of the sea area, and the red dot is the location of the Maitas traffic station |
4.2.1 低槽东移类
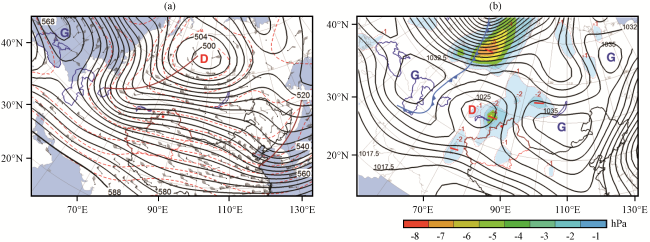
图5 2016年12月23日08:00锋前减压型“低槽东移类”东风吹雪时500 hPa位势高度场(黑色等值线, 单位: dagpm)、 温度场(红虚线, 单位: ℃)和风场(风羽, 单位: m·s-1)(a)以及地面气压场(黑色等值线, 单位: hPa)和3 h负变压场(彩色区, 单位: hPa)(b)(a)中棕色短实线为槽线, “D”表示位势高度“低中心”; (b)中蓝色三角实线为冷锋, 红色“-”为负变压中心, “D”和 “G”表示“低压中心”和“高压中心”; 图中深蓝色实线为海域边界, 红色“·”为玛依塔斯交通站位置 Fig.5 The geopotential height field (black contour, unit: dagpm), temperature field (red dotted line, unit: ℃) and wind field (unit: m·s-1) at 500 hPa (a), and the ground average composite pressure field (black contour, unit: hPa) with the 3-hours negative pressure field (color area, unit: hPa) (b) when the front decompression type "low trough moving eastward" east wind blows snow at 08:00 on 23 December 2016.The brown short solid line is the trough line, and "D" represents the geopotential height "low center" in Fig.5 (a).The solid blue triangle line is the cold front, red "-" is the center of negative pressure, "D" and "G" mean "low pressure center" and "high pressure center" in Fig.5 (b).The dark blue solid line is the boundary of the sea area, and the red dot is the location of the Maitas traffic station |
4.2.2 中纬度波动类
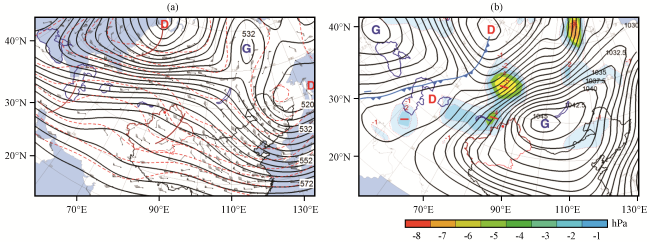
图6 2016年12月14日08:00锋前减压型“中纬度波动类”东风吹雪时500 hPa位势高度场(黑色等值线, 单位: dagpm)、 温度场(红虚线, 单位: ℃)和风场(风羽, 单位: m·s-1)(a)以及地面气压场(黑色等值线, 单位: hPa)和3 h负变压场(彩色区, 单位: hPa)(b)(a)中棕色短实线为槽线, “D”表示位势高度“低中心”; (b)中蓝色三角实线为冷锋, 红色“-”为负变压中心, “D”和 “G”表示“低压中心”和“高压中心”; 图中深蓝色实线为海域边界, 红色“·”为玛依塔斯交通站位置 Fig.6 The geopotential height field (black contour, unit: dagpm), temperature field (red dotted line, unit: ℃) and wind field (unit: m·s-1) at 500 hPa (a), and the ground average composite pressure field (black contour, unit: hPa) with the 3-hours negative pressure field (color area, unit: hPa) (b) when the front decompression type "mid-latitude fluctuation type" east wind blows snow at 08:00 on 14 December 2016.The brown short solid line is the trough line, and "D" represents the geopotential height "low center" in Fig.6 (a).The solid blue triangle line is the cold front, red "-" is the center of negative pressure, "D" and "G" mean "low pressure center" and "high pressure center" in Fig.6 (b).The dark blue solid line is the boundary of the sea area, and the red dot is the location of the Maitas traffic station |
5 天气系统三维配置及模型
5.1 回流型
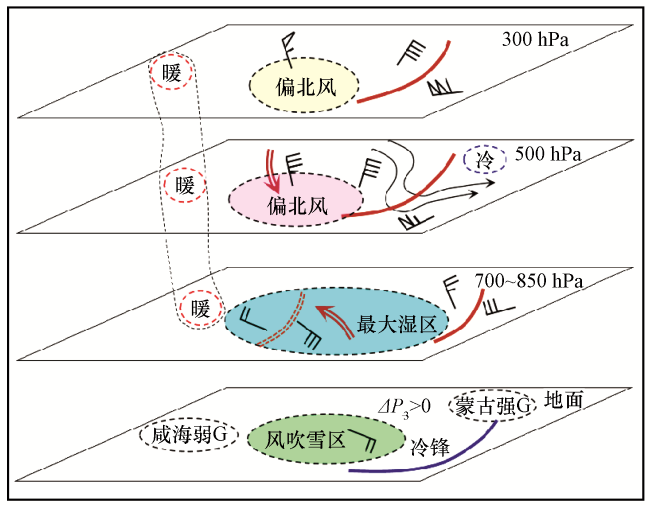
图7 玛依塔斯“回流型”东风吹雪时的高低空天气系统配置及三维空间模型棕色实线为高空槽线, 风羽示意风向及风速, 黑色带箭头实线为500 hPa等位势高度线, 棕色带箭头双实线为风速大值区, 棕色双虚线为低层切变线, “暖”和“冷”代表“暖中心”和“冷中心”, “G”代表地面高压中心, 蓝色实线为地面冷锋 Fig.7 High and low altitude weather system configuration and three-dimensional space model of Mayitas "return type" east wi-nd blowing snow.The brown solid line is the high-altitude trou-gh line, the wind plume indicates the wind direction and wind speed, the black solid line with an arrow is the 500 hPa equipotential height line, the brown doubled solid line with arrow is the area of large wind speed, and the brown double dashed line is the low-level shear line."Warm" and "cold" represent "warm center" and "cold center", "G" represents the ground high-voltage center, and the solid blue line is the ground cold front |
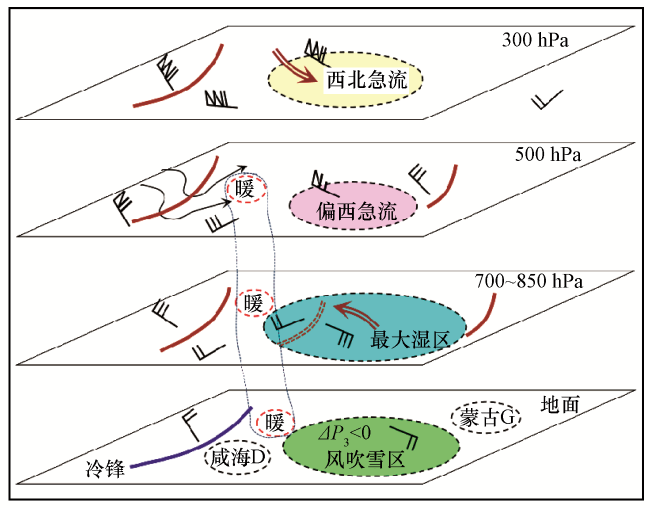
5.2 锋前减压型
图8 玛依塔斯“锋前减压型”东风吹雪时的高低空天气系统配置和三维空间模型棕色实线为高空槽线, 风羽示意风向及风速, 黑色带箭头实线为500 hPa等高线, 棕色带箭头双实线为风速大值区, 棕色双虚线为低层切变线, “暖”和“冷”代表“暖中心”和“冷中心”, “G”和“D”代表地面“高压中心”和“低压中心”, 蓝色实线为地面冷锋 Fig.8 The high and low altitude weather system configuration and three-dimensional space model of Mayitas "forward decompression type" when the east wind blows snow.The brown solid line is the high-altitude trough line, the wind plume indicates the wind direction and wind speed, the black solid line with an arrow is the 500 hPa equipotential height line, the brown doubled solid line with arrow is the area of large wind speed, and the brown double dashed line is the low-level shear line."Warm" and "cold" represent "warm center" and "cold center", "G" represents the ground high-voltage center, and the solid blue line is the ground cold front |