
1 引言
伴随着中国城市化和工业化的不断加快(朱彤等, 2010; Chan et al, 2008; Deng et al, 2016; Zhang et al, 2012; Shen et al, 2019), 人类活动所产生的大量污染物不断排放到大气, 导致雾霾事件频发。污染物成分复杂、 来源多样, 引发众多环境问题。细颗粒气溶胶可直接进入肺部, 危害人体健康(Liu et al, 2018; 李子华等, 2008; Chen et al, 2013); 大气污染物对于能见度影响较大, 引发交通事故(吴兑等, 2007; 浦静姣等, 2017; 许建明等, 2010); 大气污染物通过散射、 反射和吸收等辐射强迫作用, 改变地气能量平衡(Li et al, 2016; Shi et al, 2008; 邓学良, 2008; 张芝娟等, 2019)。大气污染所导致的众多负面影响, 引发了社会和政府部门的高度重视(Che, 1999; 穆泉等, 2013; 王跃思等, 2013)。
大气污染受到污染排放和气象条件的共同影响。污染物作为内因, 重污染天气总是伴随着高浓度污染物(贺克斌等, 2009; 程真等, 2011; 王跃思等, 2014; 郝巨飞等, 2018)。人类活动排放的一次污染物, 在空气中停留积聚, 在特定条件下发生物理和化学反应, 产生二次污染物, 导致重污染天气发生(Qian et al, 2018)。刘庆阳等(2014)发现北京重污染天气下首要污染物为PM2.5, 来自燃煤、 汽车尾气以及二次有机气溶胶。石春娥等(2016)发现合肥霾天气水溶性离子以SO4 2-、 NO3 -和NH4 +为主, 来源于工业、 汽车尾气和农业生产。周敏等(2013)和王敬等(2014)分别发现上海和乌鲁木齐的重污染天气下污染物来源以及二次气溶胶贡献。在全球变暖的气候背景下, 气象条件对于大气污染形成起到了越来越为重要的作用(Li et al, 2013; 马井会等, 2013; 曹伟华等, 2013; 周述学等, 2017)。环流异常可以影响污染区域输送, 导致大范围持续性大气污染事件发生(林建等, 2008; Deng et al, 2018; Xu et al, 2015)。张人禾等(2012)发现2013年冬季中国东部区域雾霾事件是500 hPa存在高压异常抑制了对流的发展所致。Ye et al(2016)获得华北地区有利于雾霾形成的不同天气形势。边界层结构对于大气污染形成至关重要, 强逆温层和低边界层可以压缩污染物垂直分布, 致使近地层大气中的污染物浓度急剧增大, 导致雾、 霾天气的加剧和维持(Li et al, 2005, 2018; 张恒德等, 2016; 徐怀刚等, 2002; 华雯丽等, 2018)。地面气象条件可以通过清除、 扩散和稀释作用, 对于污染物进行影响(Elminir, 2005; Deng et al, 2012; 霍彦峰等, 2017)。局地高湿、 小风、 无雨的天气, 可以造成静稳天气条件, 既不利于污染物的清除, 也无法将污染物扩散, 导致污染物不断积聚, 产生大气污染事件(张恒德等, 2016; 郭利等, 2011)。
近年来我国大气污染表现出范围广、 持续久的特点(Quan et al, 2011; Liu et al, 2017; 李锋等, 2015)。冬季我国东部均会爆发持续性雾霾事件, 为了应对区域性污染过程的危害, 多省市联合发布重污染天气预警信号, 其中2018年秋冬季我国东部共有79个城市发布了重污染天气预警信号, 严重影响到人民的正常生活。目前我国东部地区的污染区域性特征主要表现为京津冀和长三角的污染连片, 京津冀地区和长三角地区的污染物通过输送通道进行远距离传输, 从而相互影响(花丛等, 2017; 刘世玺等, 2010)。而安徽地处两者过渡带, 即受到本地农业活动影响, 又受到区域输送的影响, 工业污染源和农业污染源叠加, 是污染过程的天然试验场。为此, 本研究选取皖北地区阜阳市作为研究站点, 针对2018年11月23日至12月3日的一次大范围、 持续性重污染天气事件, 分别从其气候异常、 边界层特征以及地面气象条件等不同角度, 分析本次大气污染事件的气象成因, 以期揭示区域输送对于该区域大气污染形成的影响。
2 资料来源及站点介绍
2.1 站点选取
安徽位于京津冀与长三角过渡带, 受到地形和季风的影响, 皖北地区处于两大区域污染中心的传输通道(Deng et al, 2012; 周述学等, 2017), 因此本文选取皖北阜阳站作为研究站点, 该站点具有要素齐全的气象观测, 包括地面观测和气球探空。此外, 阜阳站位于河南、 山东、 安徽和江苏的交界处, 污染物来源复杂(邓学良等, 2015), 为研究重污染天气提供了天然的试验场。为了对比研究阜阳的污染输送影响, 选取了皖南安庆站作为参考站, 安庆位于沿江上游, 距离阜阳站点直线距离为288 km, 安庆和阜阳站为安徽省仅有的两个探空站。
2.2 污染物数据
污染物数据来源于中国环境监测总站“全国城市空气质量实时发布平台”(http: //106.37.208. 233: 20035/)。观测要素包括6种主要污染物: 大气颗粒物浓度(细颗粒物(PM2.5)和可吸入颗粒物(PM10))和气态污染物浓度[二氧化氮(NO2)、 二氧化硫(SO2)、 一氧化碳(CO)和臭氧(O3)]。依据“环境空气质量指数(AQI)技术规定(试行)”(HJ633-2012)(环境保护部, 2016)规定的方法, 计算日均污染物浓度、 空气质量指数(AQI)和污染等级划分。
2.3 气象数据
气象观测数据来源于安徽省气象信息中心, 观测要素包括降水、 风速、 风向、 气温、 相对湿度、 总云量、 日照时数、 能见度等要素。为了探讨边界层结构, 使用了阜阳和安庆的秒级气球探空数据, 两站使用的都是L波段雷达探空, 每日固定观测2次[07:00(北京时, 下同)和19:00], 根据“常规高空气象观测业务规范”(中国气象局, 2010)将探空数据稀疏化处理, 差值到垂直方向上50 m等间隔。天气形势分析使用了欧洲中心每日4次的ERA-Interim再分析资料, 水平分辨率为1.5°×1.5°, 垂直分为37层。
2.4 重污染事件介绍
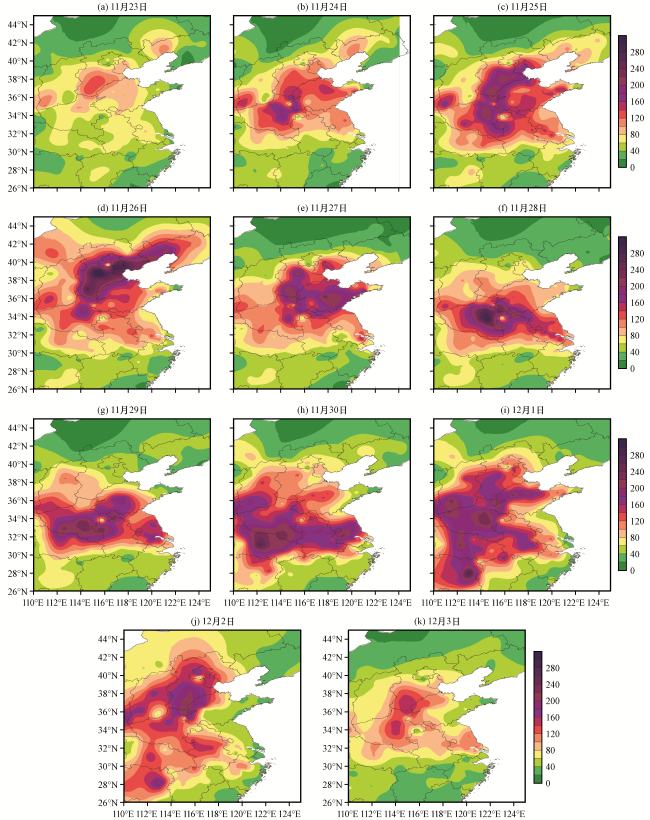
2018年11月23日至12月3日发生了一次区域性重污染过程, 本次过程持续11天, 影响了华北、 华东和华中等省市。本次重污染天气过程与2013年1月我国东部地区重污染事件相当, 具有非常好的代表性, 为此选取本次过程进行分析。从污染发展过程来看(图1, 该图及文中所涉及的地图数据均取自国家测绘局提供给中国气象局的海岸线、 中国国界以及行政区划数据, 底图无修改), 可分为4个阶段: (1)发展阶段(11月23 -24日), 23日我国东部PM2.5浓度较低(<75 μg·m-3), 空气质量等级以良为主, 24日污染逐渐发展, 东部PM2.5浓度达到100 μg·m-3以上, 空气质量等级达到轻度到中度污染。(2)维持阶段(11月25 -27日), 污染中心位于华北地区, PM2.5浓度超过150 μg·m-3, 达到重度到严重等级。(3)中心南移阶段(11月28日至12月1日), 华北污染逐渐南压至华东和华中, 山东、 河南、 安徽、 江苏等省PM2.5浓度超过150 μg·m-3, 达到重度到严重等级。(4)污染消散阶段(12月2 -3日), 中国东部PM2.5浓度降低到120 μg·m-3以下, 污染过程结束。
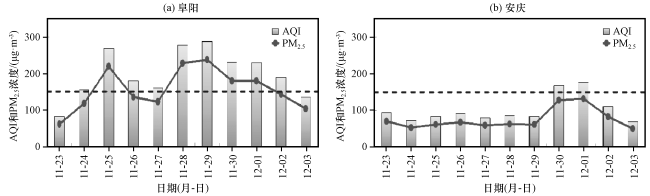
在整个污染过程中, 位于皖北的阜阳和皖南的安庆两站污染物变化表现出不同的趋势(图2), 11月23 -24日阜阳PM2.5浓度由61.0 μg·m-3升至154.8 μg·m-3; 11月25日阜阳PM2.5浓度达到第一个峰值(269.5 μg·m-3); 11月26 -27日PM2.5浓度有所降低, 但日均值仍然超过120 μg·m-3; 11月28日污染中心南移至华中和华东区域, 阜阳PM2.5浓度再次激增至238.1 μg·m-3, 并在11月28日至12月1日的4天中一直维持着高浓度的状态; 12月2 -3日PM2.5浓度逐渐降低至142.9 μg·m-3和103.5 μg·m-3, 污染物基本被清除。安庆站11月26 -27日PM2.5并未增加, 期间日均浓度均小于100 μg·m-3, 直到11月30日至12月1日安庆PM2.5浓度才出现峰值, 并在随后逐渐减小。本次过程对于中国东部不同区域的影响存在显著地空间差异。
3 结果与分析
3.1 气候异常特征
图3为2000 -2018年历史同期(11月23日至12月3日)阜阳站地面气象要素变化特征, 选取6种地面气象要素[能见度、 风速、 降雨量、 相对湿度、 气温、 总云量、 日照时数(Xu et al, 2015)]进行分析。阜阳站污染物从2015年开始观测, 因此利用历史能见度数据替代污染物浓度(张浩等, 2017)。首先从阜阳站历史同期能见度来看, 最大能见度出现在2005年(14.8 km), 随后呈现下降趋势。近5年阜阳能见度均较低, 分别是5.1 km(2014年)、 4.8 km(2015年)、 6.8 km(2016年)和7.9 km(2017年), 2018年为能见度最低的年份(3.4 km)。可以看出, 2018年为历史同期污染最为严重的年份(图3中蓝色虚线框)。地面气象条件通过清除、 扩散和稀释等作用来影响污染物(张恒德等, 2016)。为此, 比较了地面气象要素的气候差异。
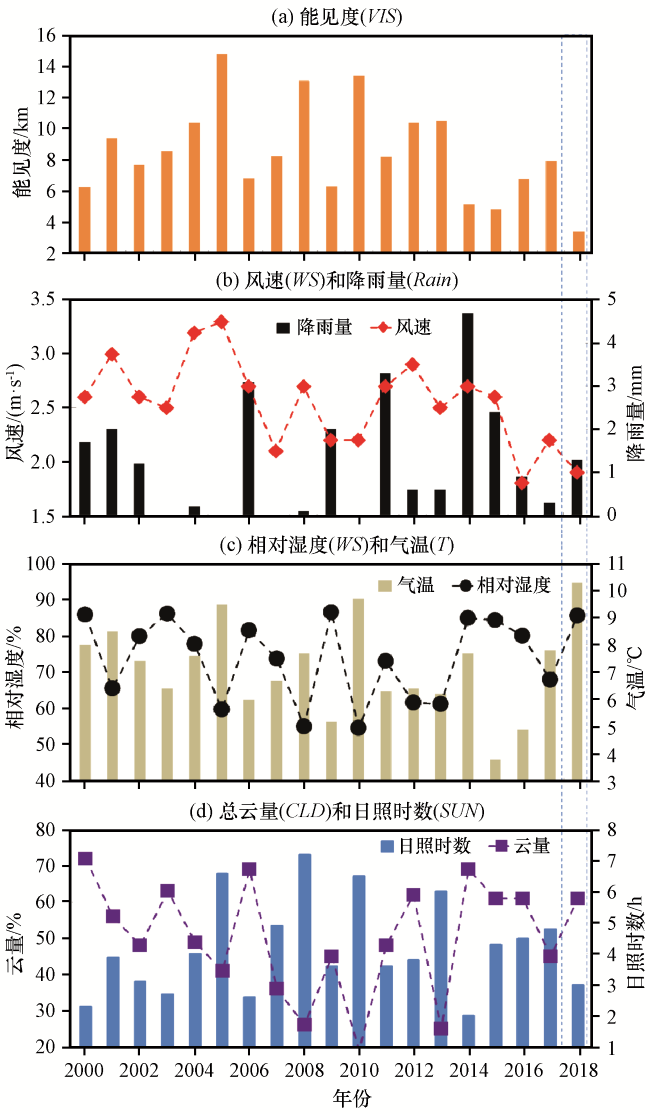
图3 2000 -2018年历史同期(11月23日至12月3日)阜阳站地面气象要素变化特征Fig.3 Temporal variations of mean visibility (VIS), near-surface wind speed (WS), precipitation (Rain), relative humidity (RH), temperature (T), cloud amount (CLD), sunshine duration (SUN) for Fuyang station over the same period from 23 November to 3 December from 2000 to 2018 |
湿清除作为大气气溶胶的主要清除机制, 是大气自净最重要过程之一(秦瑜等, 2003), 降雨对于污染季节清除效率可以达到约50%(许建明等, 2017b)。本研究时段处于秋冬季节, 降雨量为一年中最少时段, 阜阳日均降雨量仅有1.5 mm·d-1, 多为冷空气过程降雨, 而2018年该时段阜阳日均降雨量仅为1.3 mm·d-1, 低于多年平均值, 弱降雨对于污染物无法起不到清除作用, 反而会导致相对湿度增加, 使得气溶胶粒子发生吸湿增长, 造成颗粒物浓度升高(孙俊英等, 2016)。2018年阜阳的相对湿度为85.5%, 高于2005年的59.7%, 大于该地区潮解点, 容易导致污染的发生。
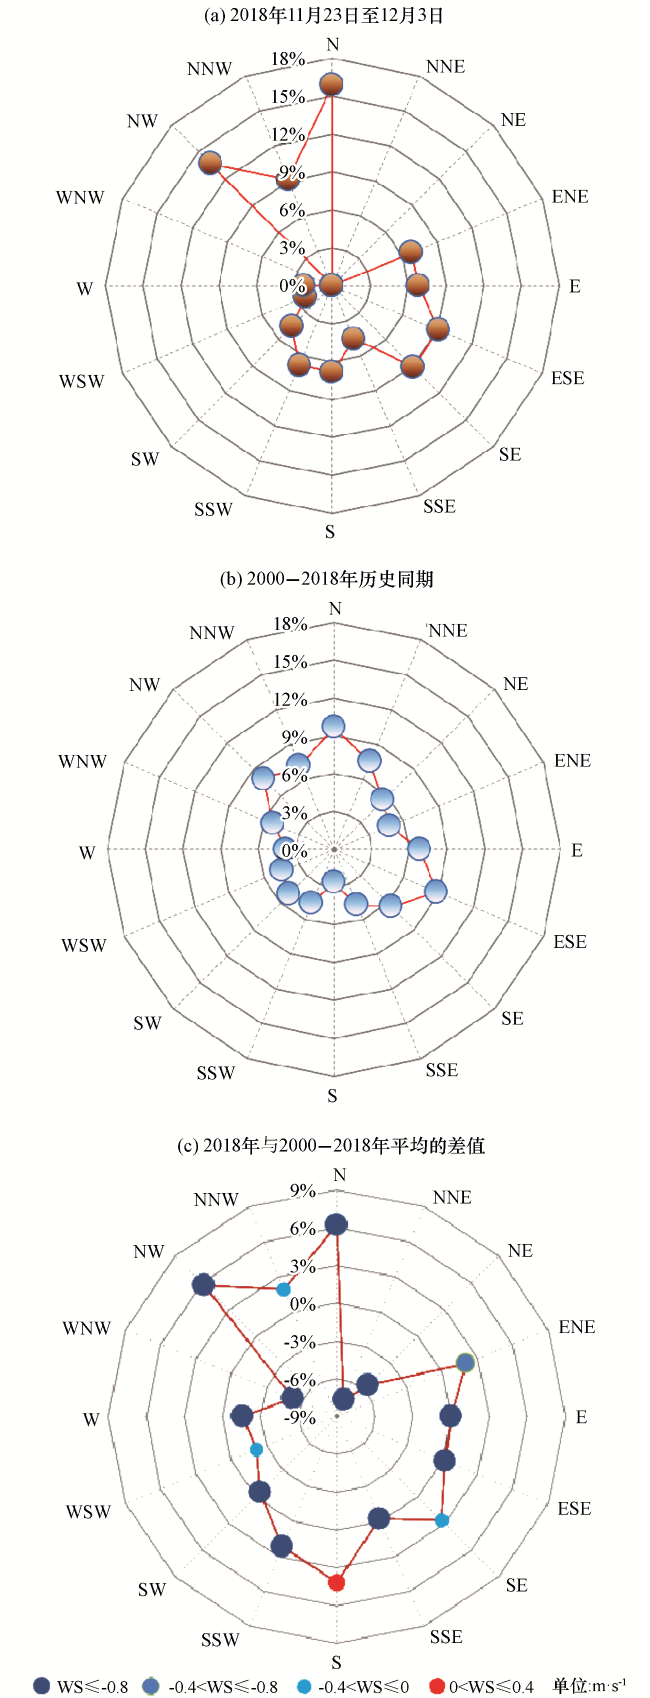
风对于污染物具有搬运和稀释的作用, Tie et al(2015)提出了平衡风速(balance wind), 认为风速大于平衡风速时, PM2.5的清除能力大于积聚能力。许建明等(2017a)得出上海的平衡风速为1.8 m·s-1。本研究显示(图3)2018年阜阳平均风速为1.9 m·s-1, 为仅次于2016年的第2小年份, 位于平衡风速区间, 对于污染物没有稀释的作用, 反而有利于局地污染物的积聚。2005年作为能见度最大的年份, 其风速也为最大年份(3.3 m·s-1), 较强风速有利于污染物扩散。风向决定污染物传输方向, 影响污染物水平通量。从图4可以看出, 阜阳多年风向以偏北风为主[图4(b)], 频率达到48%, 而偏南风频率较低(36.8%)。2018年阜阳偏北风频率[图4(a)]与多年平均相当, 分别是46%(2018年)和48%(2000 -2018年), 而2018年阜阳偏南风增加明显, 由多年平均的36.8%增加至2018年的43.2%, 尤其是在东北风和西南风频率增加最为明显。从2018年与多年平均的风向风速差异来看[图4(c)], 风速在每个方向基本都是减小的, 偏北风的风速下降最为明显, 分别下降了1.53 m·s-1(NW)、 0.97 m·s-1(N)、 0.45 m·s-1(ENE)和0.26 m·s-1(NNW)。因此偏北风频率减小、 偏南风频率增加以及偏北风速的明显减少, 说明了2018年冷空气强度较弱, 导致了温度的升高和风速的减小, 使得污染物无法被清除, 对于重污染天气的发生十分有利。气温可以反映出局地冷空气强弱(Xu et al, 2015), 气温低, 说明冷空气强, 对于污染物清除有利; 气温高, 说明冷空气较弱, 对于污染物清除能力弱。2015年起阜阳平均气温逐年增加, 2018年的平均气温为2000年来最高年份, 达到10.3 ℃, 较2015年升高了6.5 ℃[见图3(c)]。2018年气温异常高和风速异常低对应于冷空气南下频率较少或冷空气强度较弱, 而冷空气活动异常偏弱, 直接造成污染物无法有效清除, 导致2018年污染加重(张人禾等, 2014)。
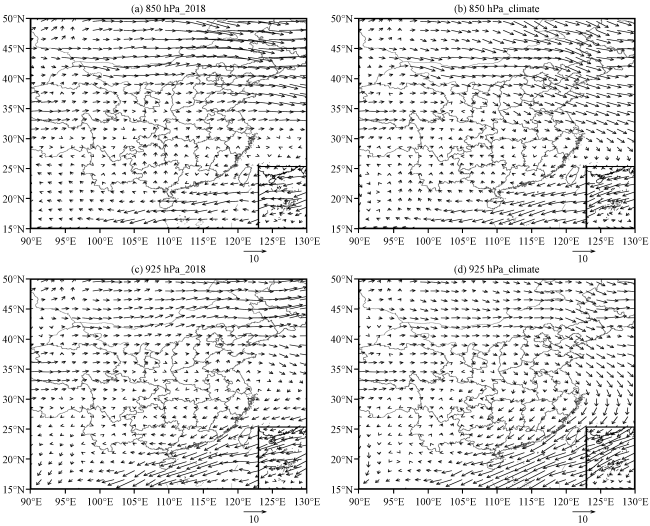
为了揭示本次污染过程的大气环流背景, 图5给出了2018年11月23日至12月3日平均高度场及其距平分布。在对流层中层的500 hPa高度[图5(a)], 亚欧上空中高纬度呈现纬向型, 纬向型环流不利于引导冷空气大举南下, 天气形势不易破坏, 导致污染天气过程易于维持。从500 hPa距平来看, 华北、 黄淮等地位势高度偏高5~6 dagpm, 说明这次过程期间冷空气较历史同期偏北, 而暖气团较强盛, 同样风场也显示出西北气流较同期偏弱(图略)。而在700 hPa高度上[图5(b)], 不仅黄淮等亚洲东部高度偏高, 孟加拉湾北侧和四川盆地等地同样偏高, 使得700 hPa中纬度环流较平, 没有形成西低东高的水汽输送形势, 导致虽然暖气团较同期强盛但未产生降水以清除污染天气。从对流层低层的850 hPa和925 hPa看(图6), 黄淮到江淮一带风向与历史同期存在明显差异, 本次过程中850 hPa、 925 hPa主导西南风、 偏南风, 而历史同期850 hPa和925 hPa主导西北风, 南风阻碍冷空气南下, 导致温度的上升和湿度的增加, 造成污染物在中国东部地区的积累和维持(张人禾等, 2014)。
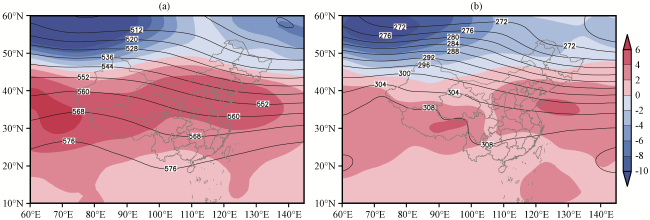
图5 2018年11月23日至12月3日500 hPa(a)和700 hPa(b)平均位势高度场(等值线)和距平场(彩色区)(单位: dagpm)Fig.5 Average geopotential height (contour) and anomaly distribution (color area) respectively at 500 hPa (a) and 700 hPa (b) from 23 November to 3 December 2018.Unit: dagpm |
3.2 地面气象条件
在污染源排放一定的条件下, 污染程度取决于气象条件的好坏(张恒德等, 2016)。污染物集聚在近地面, 地面气象要素对于污染物的影响最为直接, 图7是阜阳和安庆在本次污染过程中地面气象要素(风、 降雨、 相对湿度、 能见度和温度)的逐时变化图。从天气形势看(图略), 污染期间受到3次弱冷空气影响, 分别在11月24、 27和29日, 因此本次污染过程被分为了4个阶段, 其中前3个阶段为污染阶段, 第4个阶段为结束阶段。
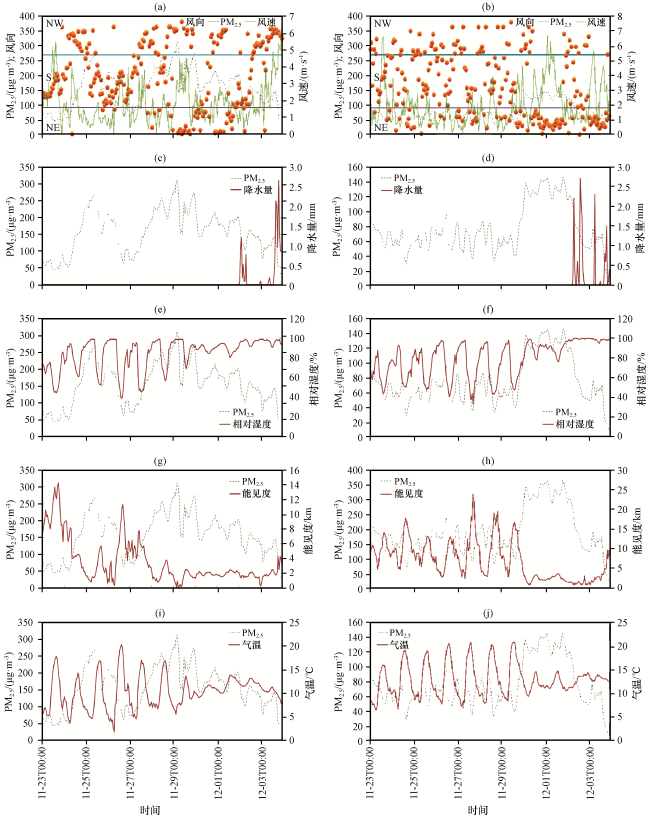
第一阶段(11月24 -26日): 新疆冷气团不断向东南方向扩散, 24日01:00经河南到达安徽, 第1次冷空气到达阜阳时在24日04:00, 阜阳由西南风转为西北风, 风速增大至4 m·s-1, 出现2 ℃降温, 09:00冷空气进入江苏, 本次冷空气较弱, 仅影响到了淮河以北。同期阜阳上游污染严重(见图1), 西北风带来了外源污染, PM2.5没有被大风有效扩散, 反而陡增至150.5 μg·m-3(24日16:00), 同时相对湿度增至90%以上, 在高浓度颗粒物作用下, 最低能见度降低到2 km。24日16:00冷空气结束, 地面位于高压前部的均压场, 风速降低到1.5 m·s-1以下, 华东地区均受低风速区控制, 日最大湿度逐步增大至25日的95%以上, 静稳天气形势建立, PM2.5浓度继续攀升至25日11:00的267 μg·m-3, 能见度降低至1 km以下。本阶段特点就是弱冷空气叠加静稳天气的共同作用, 导致污染发生区域输送和本地累积的双重污染过程, 使得阜阳站在一天内PM2.5浓度从58 μg·m-3增加至267 μg·m-3。26日受到持续南风影响, 污染逐渐好转。而安庆同期气象要素和污染物浓度都没有明显变化, 说明冷空气并没有深入到淮河以南, 弱冷空气强度小, 使得北部的污染物无法有效清除, 造成了华北平原污染输送到华东中部后原地维持, 这种天气形势是该区域重污染天气最为典型的特征。
第二阶段(11月27 -28日): 蒙古西部的冷气团东移向南, 27日08:00冷空气自华北进入安徽, 27日20:00冷空气影响结束。从图7(阜阳站)看, 冷空气强度较弱, 期间气温下降3 ℃, 西北风增至4 m·s-1, 影响范围仍在淮河以北[图7(b)]。与第一次冷空气比较, 无论是持续时间(10~12 h)、 影响范围(淮河以北)、 降温强度(2~3 ℃)和地面最大风速(4 m·s-1左右), 两次冷空气均相似, 且上游华东北部地区的污染程度相当(重度污染等级), 造成的污染输送程度基本一致, 第一次冷空气使PM2.5增加了92.5 μg·m-3(58~150.5 μg·m-3), 而第二次冷空气则使PM2.5增加了93 μg·m-3(75.5~168.5 μg·m-3)。在上游污染程度和冷空气强度相当的情况下, 污染传输对于污染物浓度的贡献是基本一致。此后(27日20:00至28日13:00), 华东地区再次出现无降水、 小风、 高湿的均压场形势, 非常有利于气粒转化作用, 导致二次气溶胶的生成(刘煜等, 2005)。从图7还可以看出, 27日20:00至28日13:00 PM2.5/CO比值不断增加, 而SO2/CO和NO2/CO比值却急剧下降(图略), 与此同时PM2.5浓度从168.5 μg·m-3(27日20:00)增加到了262 μg·m-3(28日13:00), 说明在水汽(高湿)和NH3的触发下, 可以提高二次气溶胶的生成效率, 使得污染事件加重(Deng et al, 2016)。
第三阶段(11月29日至12月1日): 在第二阶段基础上, 污染物没有明显降低, 再次有冷空气扩散南下, 相比前两次冷空气, 这次冷空气强度增强, 影响范围南压, 阜阳和安庆站分别降温3.2 ℃和6.3 ℃, 冷空气扩展到长江以南。29日冷空气自北向南(图7), 阜阳站在28日夜间到29日凌晨风向转为西北风, 上游污染输送叠加第二阶段的污染物浓度, 导致29日04:00阜阳PM2.5浓度达到本次污染过程的最大值(312.5 μg·m-3)。冷空气对安庆的影响滞后12 h, 28日16:00安庆转为偏北风, 风速增至4.7 m·s-1, PM2.5在10 h内由39.6 μg·m-3增至138.7 μg·m-3。同时在高湿条件, 两站的能见度与PM2.5表现出负相关关系, 在该阶段能见度均低于2 km以下。与前两个阶段比较, 不同强度冷空气对不同区域污染影响具有差异: 前两次冷空气由于较弱, 没有南下至长江以南地区, 因此安庆站污染物没有明显变化, 而29日冷空气强度略有加强, 则上游污染物被传输到长江以南地区, 使得阜阳和安庆先后出现污染物峰值, 但29日这次冷空气仍然不够强, 并没有将污染物彻底地清除和扩散掉。冷空气过境后, 11月30日至12月1日华东地区重新建立静稳天气形势, 地面在鞍型场-高压东移-鞍型场的不同天气形势间转换(图略), 整个重污染的区域不断扩大(见图1), 污染程度得以维持。
3.3 边界层特征
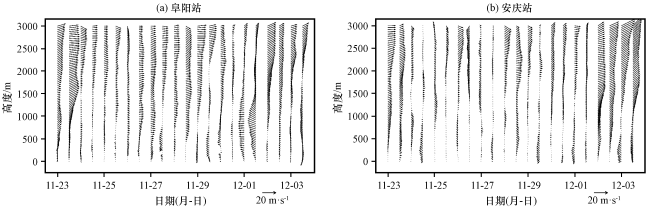
边界层结构影响污染物垂直扩散, 图8和图9分别是污染过程期间阜阳和安庆的温度、 湿度和风的垂直廓线分布。在阜阳边界层与污染过程有着很好的对应关系。从温度层结来看, 在3次污染峰值阶段(24日后期至25日、 27日后期至28日、 29 -30日)整层温度都表现出了逆温或等温结构, 逆温高度均达到600 m以上, 逆温强度最强可以达到4 ℃左右。从湿度和风场垂直廓线来看, 在这三个时段边界层整层风场均较小, 小风控制了1000 m以下高度, 而且相对湿度均偏高。这种垂直分布会限制污染物向上的扩散, 污染集聚在边界层底层, 使得静稳天气形势不容易被打破, 造成污染事件的持续发展。而在污染好转时段(26日下午至27日上午), 可以明显看到温度、 湿度和风场层结的转变, 该时段温度表现出明显的下暖上冷分布, 逆温层消失, 而对流活动则旺盛发展, 同时相对湿度明显降低至40%以下, 整层风场明显增大, 这些边界层结构的变化直接导致了27日污染物浓度的下降。从不同时段边界层结构和污染物浓度的对应关系可以看出, 边界层结构的分布对于污染物浓度影响显著。
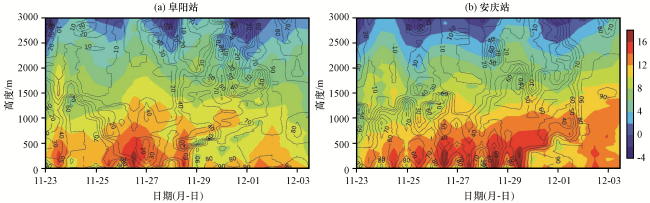
图8 2018年11月23日至12月3日阜阳站(a)和安庆站(b)气温(彩色区, 单位: ℃)和相对湿度(等值线, 单位: %)垂直廓线分布Fig.8 Vertical profile of temperature (color area, unit: ℃) and relative humidity (contour, unit: %) over Fuyang (a) and Anqing (b) station from 23 November to 3 December 2018 |
与阜阳比较, 安庆站边界层则明显不同。在11月23 -29日期间安庆温度层结表现出了明显的日变化特征, 夜间到早晨随着地面气温的下降, 近地面出现逆温, 而在午后逆温会打破, 对流活动则发展起来, 这种温度层结使污染在夜晚堆积, 在白天向上垂直扩散。11月30日这种层结被打破, 11月30日以后安庆都存在逆温层, 这个时段与安庆的污染物升高正好吻合, 并且也伴随着整层湿度升高以及小风。所以可以发现, 如果边界层整层出现逆温、 高湿以及小风, 则会抑制污染物的垂直扩散, 叠加地面的不利水平扩散条件, 则会加重污染。
4 结论
针对2018年11月23日至12月3日期间我国东部一次大范围雾霾事件, 分别从气候异常、 地面条件和边界层结构等方面开展了气象成因的分析, 得到以下主要结论:
(1) 与历史同期比较, 2018年在中国东部500 hPa和700 hPa均存在位势异常偏高亚欧中高纬表现出纬向型环流, 平直西风气流阻碍冷空气南下, 导致地面偏北风偏弱、 气温和湿度偏高, 有利于污染物的局地累积。
(2) 冷空气带来的区域输送叠加局地的静稳积累是本次污染的显著特点, 不同强度的冷空气对于污染程度和区域的影响具有差异。11月24日和27日两次冷空气较弱, 淮河以北受到了输送影响, 随后受均压场控制, 加剧了污染程度; 29日冷空气加强, 输送影响南压至长江以南, 后期受鞍型场控制, 污染范围和程度都达到峰值; 12月2日地面倒槽和低层西南暖湿气流的加强, 强降雨有效清除污染物。
(3) 在污染发展和高峰阶段, 边界层均为逆温或等温层结, 整层都受到高湿和小风的控制, 这种边界层分布非常不利于污染物的垂直扩散, 加剧污染事件的发展。
因此, 在实际预报业务中, 要根据天气形势预判污染类型(外源传输型、 静稳积累型和局地爆发型), 针对不同类型和阶段污染, 利用主控气象因子开展趋势研判, 并结合模式产品获得预报预警产品, 为当地大气污染防治提供支撑。值得指出的是, 本文仅仅是从2018年冬季的单个个例开展气象成因分析, 缺乏历史数据的统计诊断分析, 下一步有必要延长研究时段, 收集更广区域的观测数据, 尤其是探空观测, 系统地开展重污染天气的气象成因研究。