1 引言
2 暴雨天气实况及环流特征
2.1 暴雨实况及极端性
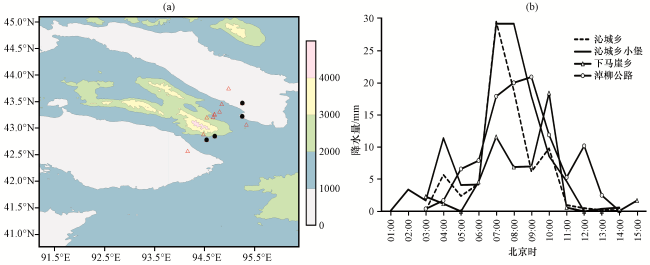
图1 2018年7月31日新疆东部(彩色区为地形, 单位: m)暴雨(红三角)和大暴雨(黑点)测站分布(a)及大暴雨站逐小时降水量(b)Fig.1 Distribution of weather stations for heavy rains (red triangle) and torrential rains (black dot) (a, color area denote terrian, unit: m), typical station represents hourly precipitation (b) in eastern Xinjiang on 31 July 2018 |
2.2 环流背景
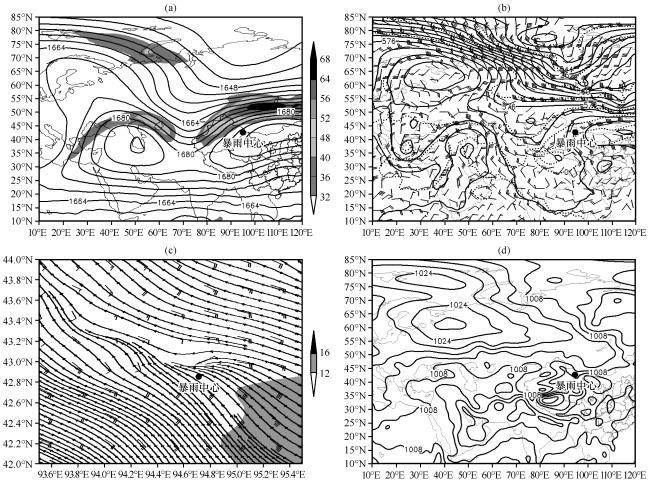
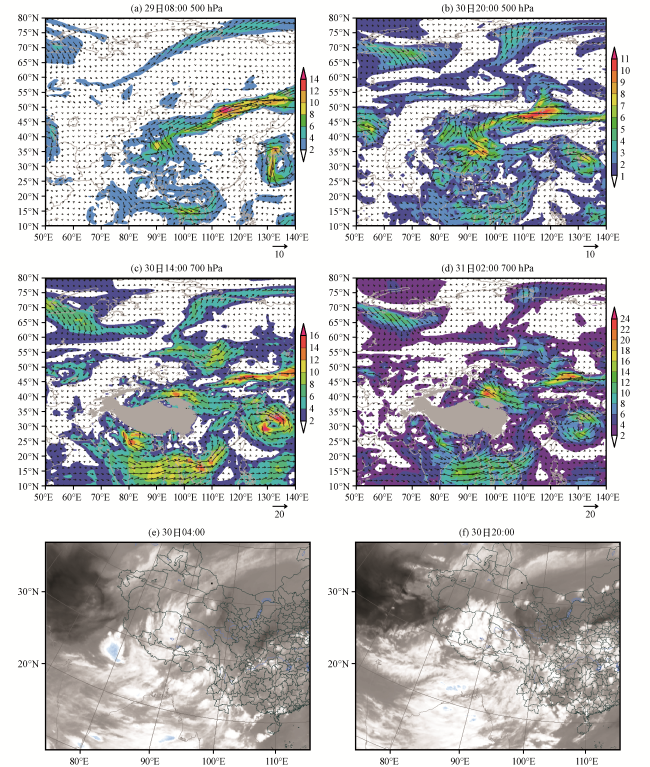
图2 FNL1 再分资料2018年7月30日20:00 100 hPa高度场(等值线, 单位: dagpm)和200 hPa急流(阴影, 单位: m·s-1)(a)、 500 hPa高度场(b, 等值线, 单位: dagpm)、 FNL 025 31日02:00 700 hPa流场(流线)和低空急流(阴影, 单位: m·s-1)(c)及30日20:00地面图(d, 单位: hPa)Fig.2 FNL1 height field at 100 hPa (contour, unit: dagpm) and the jet stream at 200 hPa (the shaded, unit: m·s-1) (a), 500 hPa height field (b, contour, unit: dagpm) at 20:00 on 30 July 2018; FNL 025 flow field (streamline) and low level jet stream (the shaded, unit: m·s-1) at 700 hPa at 02:00 on 31 (c) and figure on the ground at 20:00 on 30 (d, unit: hPa) |
3 中尺度对流云团特征
4 对流环境与物理量诊断分析
4.1 对流发展分析
4.1.1 大气层结
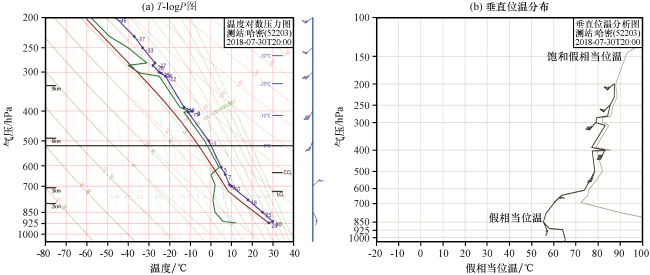
4.1.2 假相当位温结构
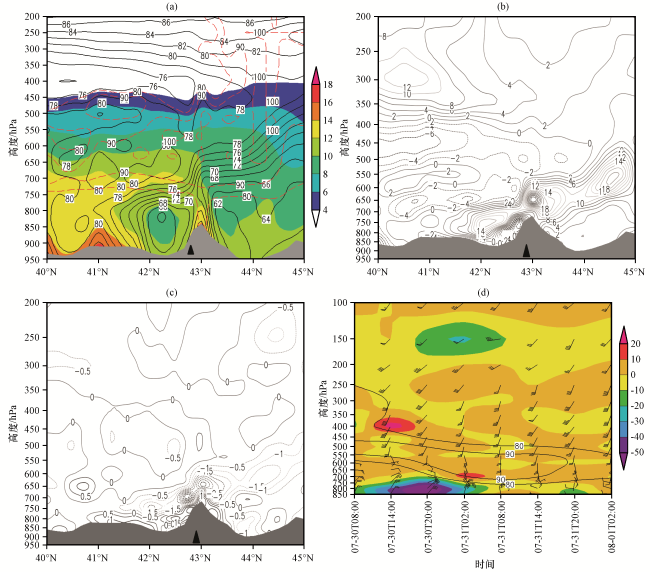
图5 FNL 025 2018年7月31日02:00沿94.7°E假相当位温θ se(等值线, 单位: ℃)和比湿(彩色区, 单位: g·kg-1)及相对湿度(红色虚线, 单位: %)(a), MPV1(b, 等值线, 单位: PVU)和MPV2(c, 等值线, 单位: PVU)垂直剖面及7月30日08:00至8月1日02:00小堡站(94.71°E, 42.85°N)风场(风羽, 单位: m·s-1)、 相对湿度(等值线, 单位: %)和温度平流(彩色区, 单位: ×10-3 K·s-1)的时间-高度剖面(d)灰色阴影为地形, 黑三角为暴雨中心小堡站 Fig.5 FNL025 vertical section of pseudo equivalent potential temperature (contour, unit: ℃), specific humidity (color area, unit: g·kg-1) and relative humidity (red dotted line, unit: %) (a), MPV1 (b, contour, unit: PVU) and MPV2 (c, contour, unit: PVU) along 94.7°E at 02:00 on 31 July 2018 and the time-height profile of wind field (barb, unit: m·s-1), relative humidity (contour, unit: %) and the temperature advection (color area, unit: ×10-3 K·s-1) at Xiaobao station(94.71°E, 42.85°N)from 08:00 on 30 July to 02:00 on 1 August 2018 (d).Grey shadow is the terrain.The black triangle was the Xiaobao station at the center of the heavy rains |
4.1.3 湿位涡分析
4.1.4 温湿结构特征
4.2 水汽条件
4.2.1 水汽源地及输送
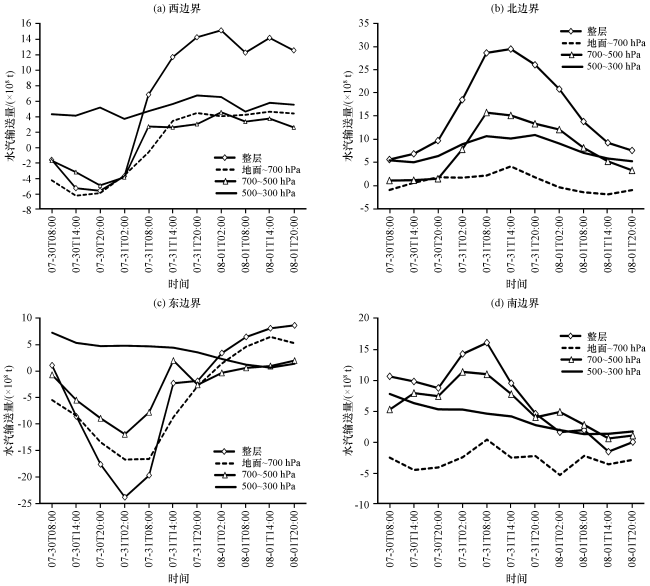
4.2.2 暴雨区水汽收支特征
4.2.3 水汽迅速辐合集中
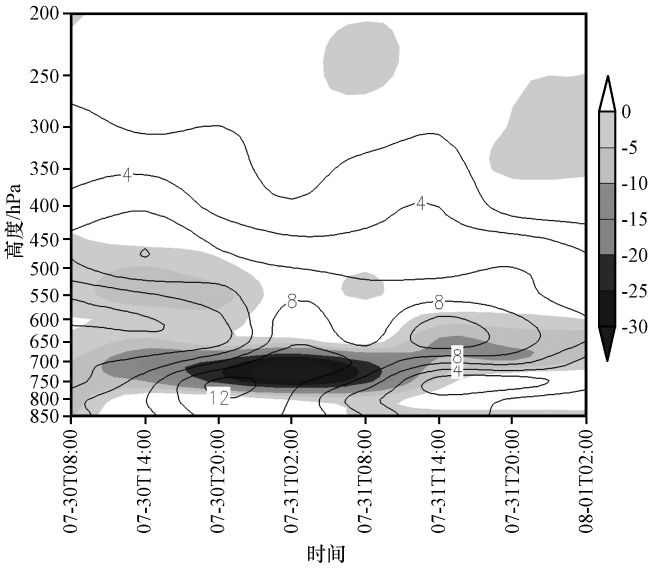
图8 FNL025 2018年7月30日08:00至8月1日02:00小堡站(94.71°E, 42.85°N)水汽通量(等值线, 单位: ×10-3 g·cm-1·hPa-1·s-1)及水汽通量散度(阴影区, 单位: ×10-5 g·cm-2·hPa-1·s-1)的时间-高度剖面Fig.8 The time-height profile of water vapor flux (contour, unit: ×10-3 g·cm-1·hPa-1·s-1) and Water vapor flux divergence (the shaded, unit: ×10-5 g·cm-2·hPa-1·s-1) of FNL025 data at Xiaobao station from 08:00 on 30 July to 02:00 on 1 August 2018 |
4.3 抬升机制
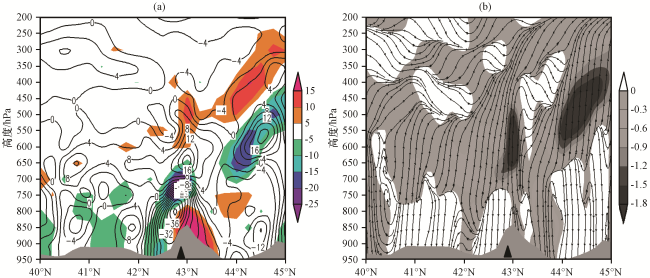
图9 FNL025 2018年7月31日02:00暴雨区沿94.7°E散度(彩色区, 单位: ×10-5 s-1)和涡度(等值线, 单位: ×10-5 s-1)垂直剖面(a)以及垂直速度(阴影, 单位: Pa·s-1)和垂直环流[流线, u风场和垂直速度w×(-100)的合成](b)灰色阴影为地形高度, 黑三角是暴雨中心小堡站 Fig.9 The vertical section of divergence (color area, unit: ×10-5 s-1) and vorticity (contour, unit: ×10-5 s-1) (a), vertical speed (the shaded, unit: Pa·s-1) and vertical circulation (streamline, u wind field and vertical speed w×(-100) synthetic) (b) of FNL025 data along 94.7°E at 02:00 on 31 July 2018.The grey shadow is the height of the terrain, and the black triangle was the Xiaobao station at the center of the heavy rains |