
1 引言
2 资料选取与方法介绍
3 后向传播雷暴的时空分布特征
3.1 时间分布特征
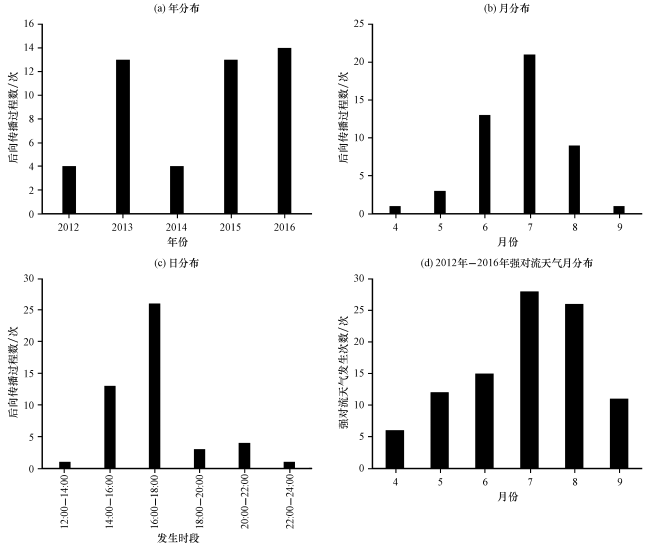
图1 2012 -2016年4 -9月陕西后向传播雷暴过程年分布、 月分布、 日分布与2012 -2016年陕西强对流天气月分布Fig.1 The yearly, monthly and daily distribution of Shaanxi back-propagating thunderstorm processes from April to September during 2012 -2016, and the monthly distribution of Shaanxi convection weather during 2012 -2016 |
3.2 空间分布特征与灾害天气种类
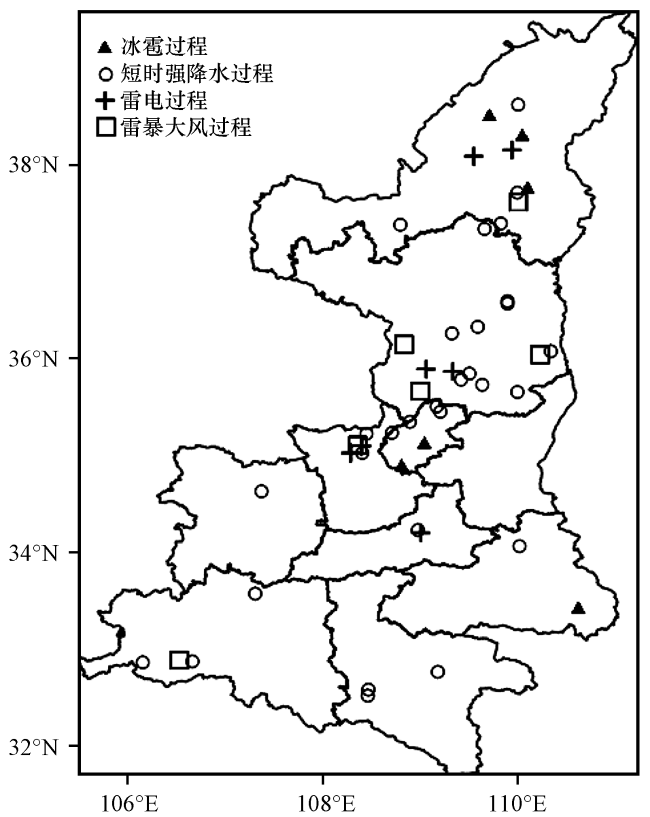
表1 后向传播雷暴过程造成的灾害种类及其天气形势与物理场要素Table 1 The categories of disasters and weather situation of back-propagation thunderstorm processes of back-propagating thunderstorm processes |
| 灾害种类 | 过程数量 | 天气形势 | 水汽输送特征 | 过程前850 hPa比湿/(g·kg-1) | T 850-T 500/℃ | 湿球0 ℃与-20 ℃高度差/km |
|---|---|---|---|---|---|---|
| 仅出现短时强降水 | 39 | 500 hPa槽前 低空切变线 地面辐合或倒槽 | 700 hPa或850 hPa有水汽输送通道 850 hPa水汽辐合 | 5~6 | 25~27 | 3.2~3.5 |
| 强降水为主, 伴有短时大风 | 7 | 500 hPa冷涡后部 低空切变线 地面辐合 | 700 hPa和850 hPa无明显水汽输送850 hPa比湿条件较好, 有水汽辐合 | 13~14 | 29~31 | 3.1~3.2 |
| 冰雹为主, 伴有短时强降水及短时大风 | 2 | 500 hPa冷涡后部 低空切变线 地面辐合、 干线 | 700 hPa无明显水汽输送 850 hPa比湿条件较好, 有水汽辐合 | 13~14 | 30~31 | 2.7~2.9 |
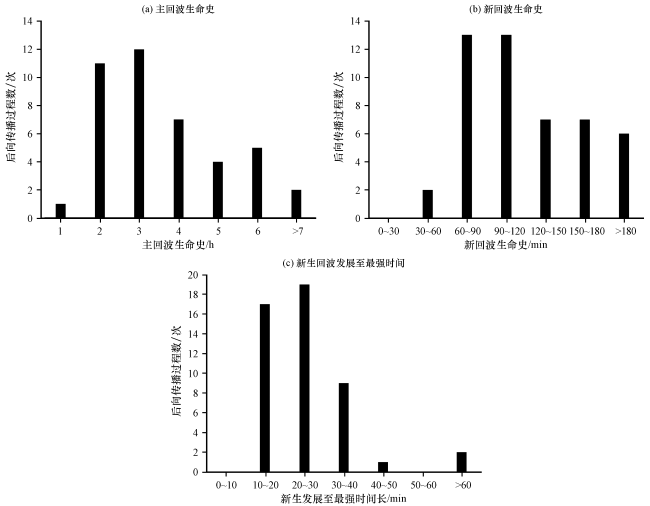
3.3 回波分布特征
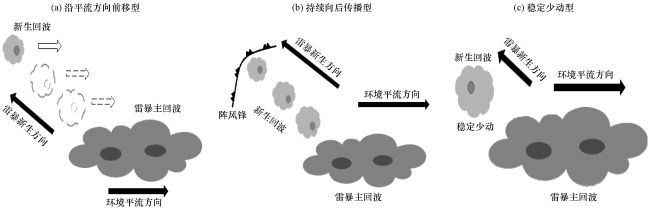
4 后向传播雷暴模型与形成机理
4.1 雷暴模型
4.2 2016年7月28日延安北部——沿平流方向前移型
4.2.1 触发与传播机制
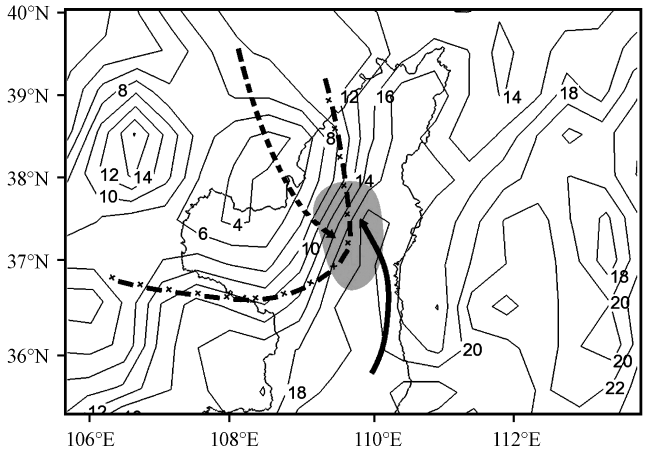
图6 2016年7月28日15:00中尺度分析与地面露点温度实线箭头为偏南湿冷气流; 虚线箭头为西北干暖气流; 点线为地面辐合线; 黑色等值线为地面露点温度(单位: ℃); 阴影区为新回波后向传播区 Fig.6 Mesoscale analysis and ground dew point temperature distribution at 15:00 on 28 July 2016.Solid arrows denotes the southeast wet-cold advection; Dotted arrows denotes the northwest dry-warm advection; Dotted line denotes the surface convergence line; Black contours denotes the ground dew point temperature distribution(unit: ℃); Shadow region denotes new echo back-propagating zone |
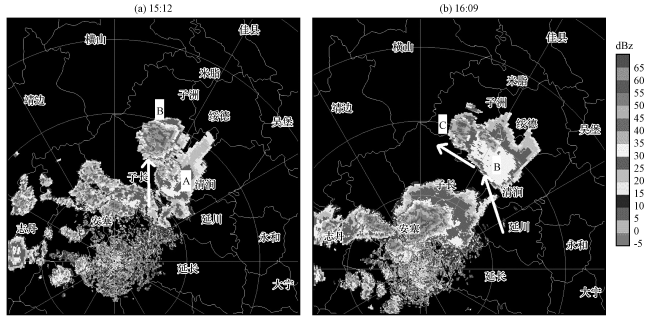
4.2.2 发展移动特征
4.3 2016年7月2日关中东部——持续向后传播型
4.3.1 雷暴触发机制
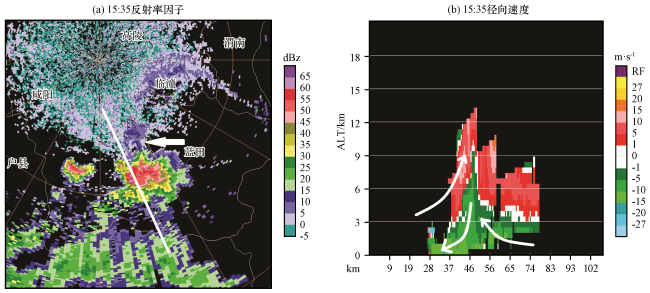
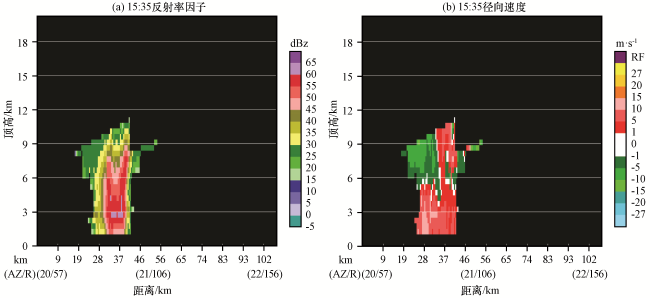
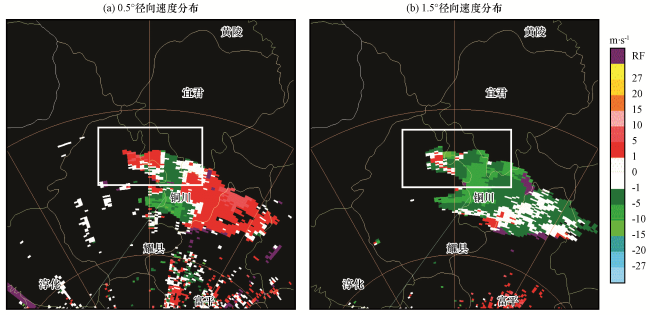
图9 2016年7月2日15:35反射率因子及径向速度垂直剖面分布白线为剖面位置, 白色箭头为风暴内部气流方向 Fig.9 Xi’an radar 1.5° base reflectivity distribution and vertical cross-section of radial velocity at 15:35 on 2 July 2016.White line denotes the vertical cross-section position; White arrow denotes the movement of air flow inside storm |
4.3.2 传播与发展机制
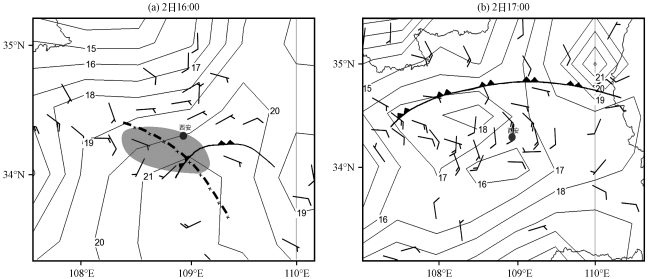
图11 2016年7月2日地面风场风羽与地面露点温度分布(等值线, 单位: ℃)黑色锋线为阵风锋位置, 点线为地面辐合线, 阴影区为回波后向传播区 Fig.11 Ground wind field (barb) and dew point temperature distribution(contours, unit: ℃) at 16:00 and 17:00 on 2 July 2016.Black frontline denotes the gust-front position, dotted line denotes the surface convergence line, shadow region denotes new echo back-propagating zone |
4.4 2013年6月25日关中北部——稳定少动型
4.4.1 雷暴触发传播机制
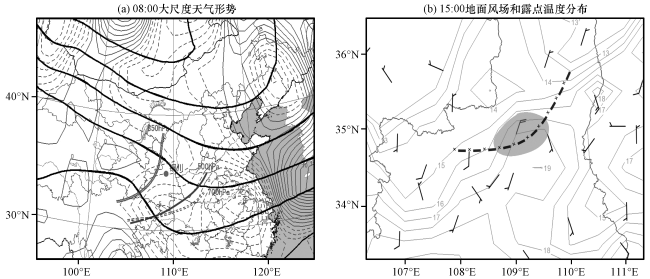
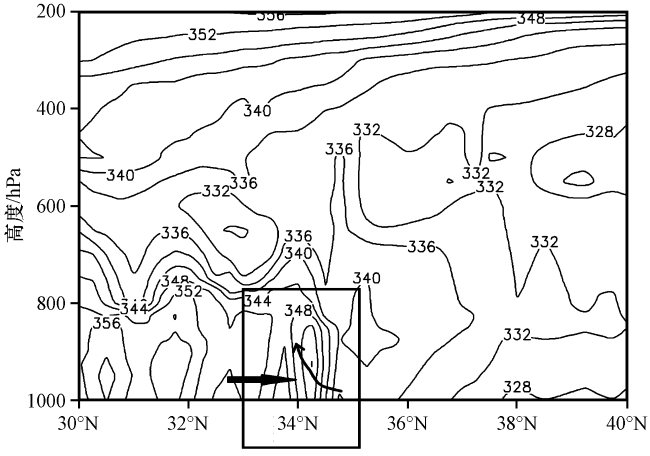
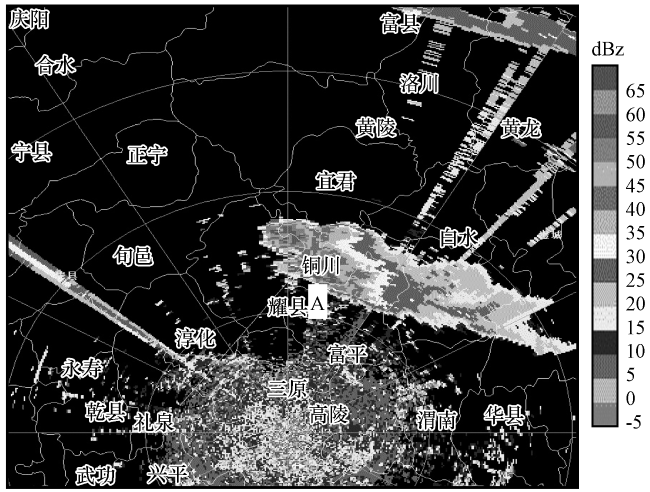
图13 2013年6月25日08:00天气形势分析及15:00地面风场和露点温度分布图(a)中黑色实线为500 hPa等位势高度, 灰色虚线为850 hPa垂直上升速度分布, 点线为地面辐合线;图(b)中灰色等值线为地面露点温度(单位: ℃), 阴影区为回波后向传播区 Fig.13 Weather situation map at 08:00 and ground wind field and dew point temperature distribution at 15:00 on 25 June 2013.In Fig.13(a), black line denotes the 500 hPa potential height filed, gray dotted line denotes the 850 hPa vertical ascend movement filed, dotted line denotes the surface convergence line; In Fig.13(b), gray contours denotes the ground dew point temperature distribution (unit: ℃), shadow region denotes new echo back-propagating zone |
4.4.2 雷暴发展维持机制
5 雷达产品统计分析
表2 新生回波雷达产品特征Table 2 The characteristics of new echo radar products |
| 过程 | 最大强度 /dBz | 低层 Vmax /(m·s-1) | VILmax /(kg·m-2) | Etmax /km | 新生时中层是否有径向速度辐合 | 新生时低层是否有径向速度辐合 |
|---|---|---|---|---|---|---|
| 2012-07-28 | 65 | 7 | 63 | 14 | 有 | 无 |
| 2012-07-30 | 65 | 12 | 68 | 16 | 有 | 无 |
| 2012-08-07 | 65 | 7 | 53 | 14 | 有 | 有 |
| 2012-09-08 | 65 | 7 | 43 | 11 | 无 | 有 |
| 2013-05-22 | 65 | 7 | 63 | 14 | 有 | 无 |
| 2013-06-03 | 65 | 12 | 53 | 13 | 无 | 无 |
| 2013-06-08 | 65 | 7 | 33 | 10 | 无 | 有 |
| 2013-06-23 | 65 | 12 | 53 | 13 | 有 | 无 |
| 2013-06-24 | 65 | 12 | 43 | 11 | 无 | 无 |
| 2013-06-25 | 65 | 7 | 63 | 14 | 有 | 无 |
| 2013-07-29 | 60 | 7 | 38 | 14 | 有 | 无 |
| 2013-07-31 | 65 | 7 | 68 | 16 | 有 | 无 |
| 2013-07-31 | 65 | 7 | 63 | 16 | 有 | 无 |
| 2013-08-03 | 65 | 12 | 68 | 13 | 有 | 无 |
| …… | …… | …… | …… | …… | …… | …… |
| 2016-07-15 | 65 | 7 | 63 | 13 | 有 | 无 |
| 2016-07-26 | 63 | 7 | 38 | 14 | 有 | 有 |
| 2016-07-27 | 65 | 7 | 63 | 14 | 有 | 无 |
| 2016-07-28 | 65 | 12 | 68 | 14 | 有 | 无 |