
1 引言
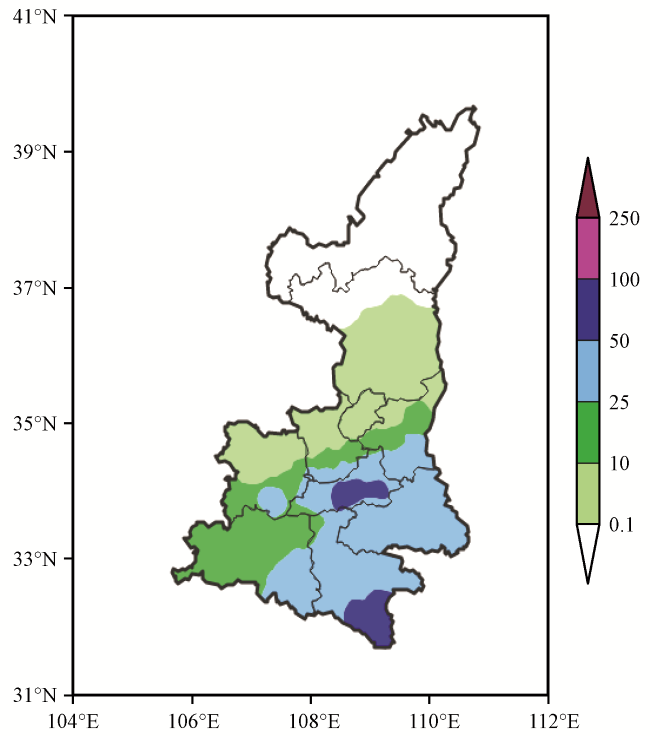
2 降水实况和预报情况
3 环流形势和探空分析
3.1 环流形势
3.1.1 高空环流形势
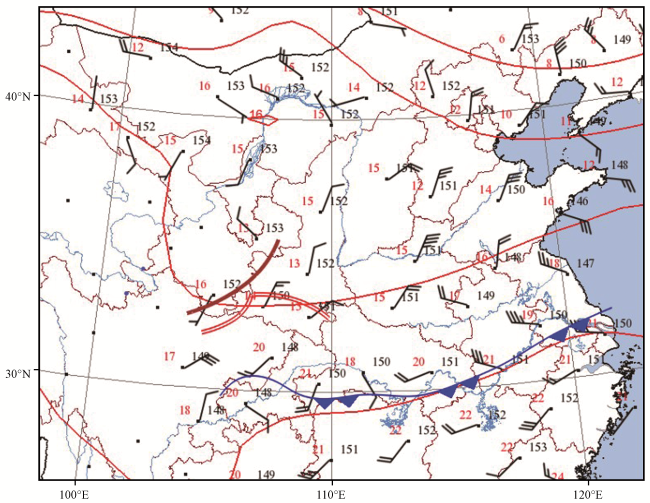
图2 2017年9月26日20:00 850 hPa风场、 温度场及高低空主要天气系统配置棕色单实线为500 hPa槽线, 蓝线为地面冷锋, 红线(红数值)为850 hPa温度场, 红色双实线为700 hPa切变线, 黑数字为850 hPa位热高度 Fig.2 The 850 hPa wind field, temperature field and configuration of major weather systems at high and low level at 20:00 on 26 September 2017.Brown line represents 500 hPa trough, blue line is for surface cold front, red line (red number) is for 850 hPa temperature, red double solid line is for 700 hPa shear line, black number is 850 hPa geopotential height |
3.1.2 地面形势
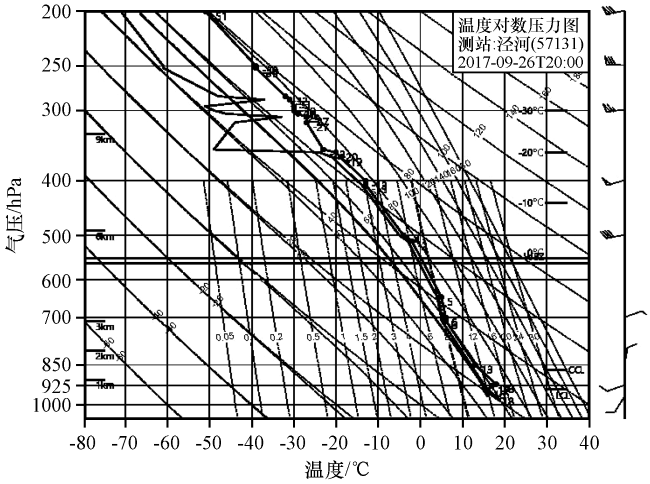
3.2 探空分析
4 物理机制分析
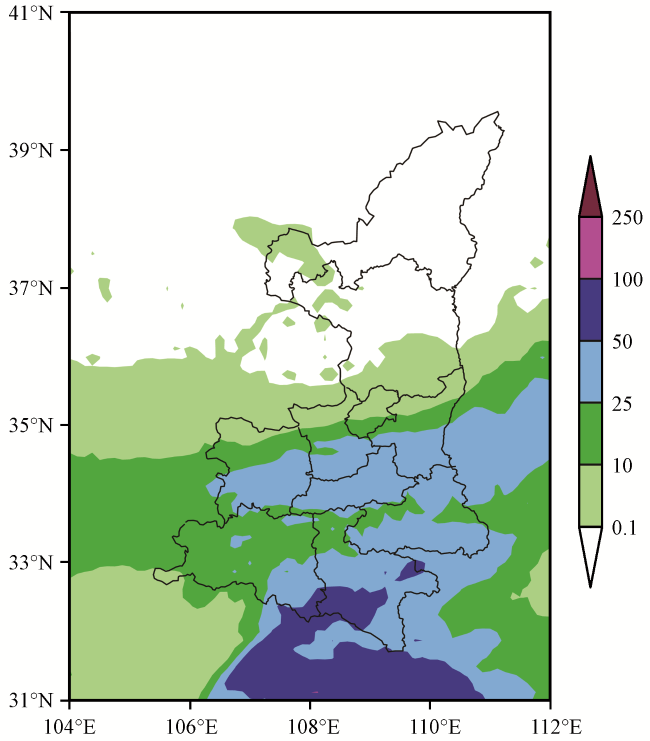
4.1 欧洲中心细网格数值预报产品的检验
4.2 水汽条件分析
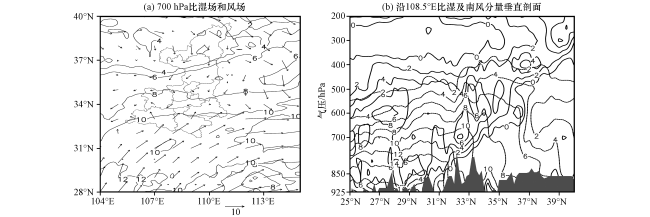
图5 2017年9月26日20:00 700 hPa比湿场(实线, 单位: g·kg-1)和风场(矢量, 单位: m·s-1)的叠加图(a)和沿着108.5°E比湿(虚线, 单位: g·kg-1)及南风分量(实线, 单位: m·s-1)垂直剖面(b)灰色阴影为地形 Fig.5 700 hPa specific humidity field (solid line, unit: g·kg-1) and wind field (vector, unit: m·s-1) (a) and the vertical cross section of specific humidity (dotted line, unit: g·kg-1) and south wind (solid line, unit: m·s-1) along 108.5 °E (b) at 20:00 on 26 September 2017.The grey shaded color area is terrain |
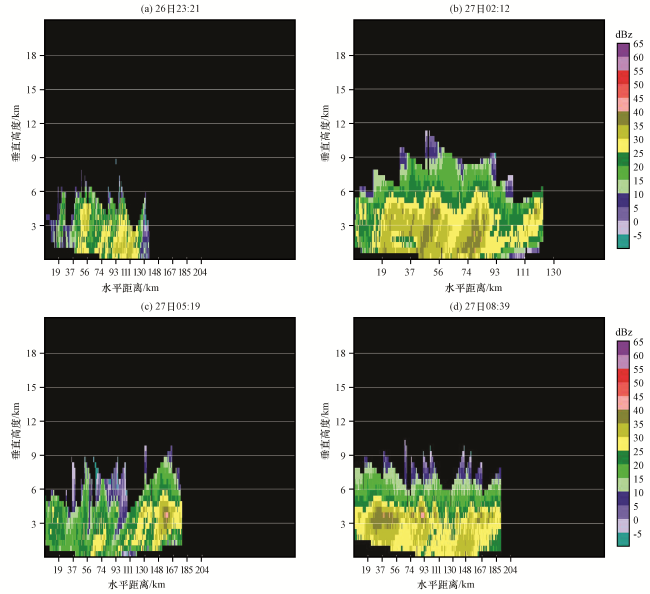
4.3 条件性不稳定和雷达回波
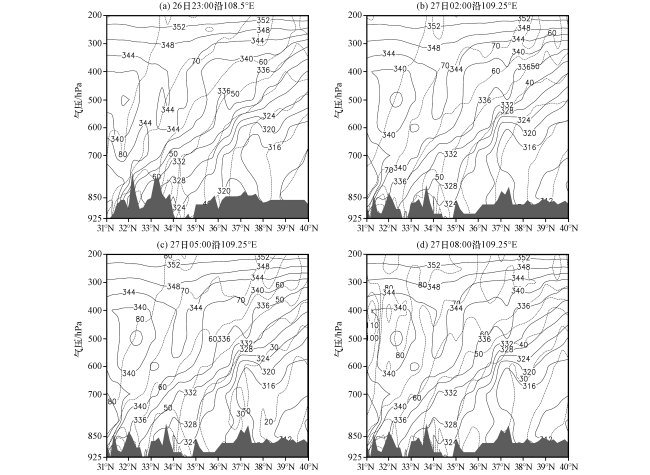
图6 2017年9月26日23:00至27日08:00地转绝对动量(Mg, 虚线, 单位: m·s-1)和饱和相当位温( *, 实线, 单位: K)沿经向垂直剖面阴影为地形 Fig.6 The meridional vertical cross-section of absolute momentum (Mg, dotted line, unit: m·s-1) and saturation pseudo-equivalent potential temperature ( *, solid line, unit: K) from 23:00 on 26 to 08:00 on 27September 2017.The grey shaded color area for terrain |
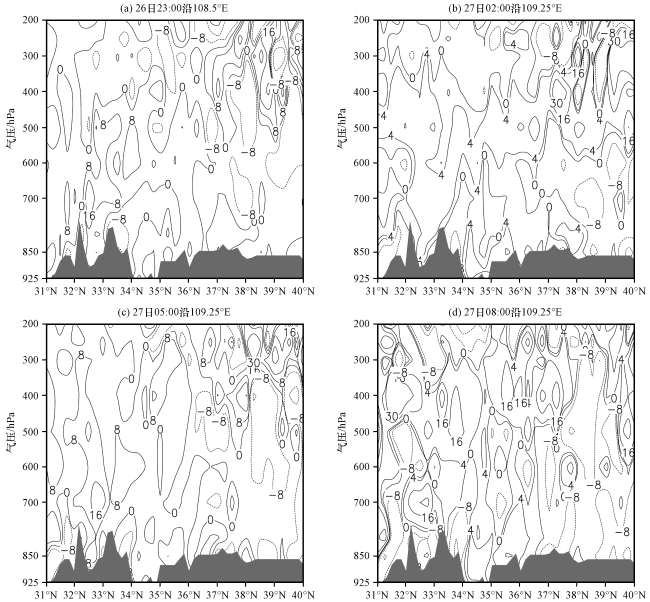
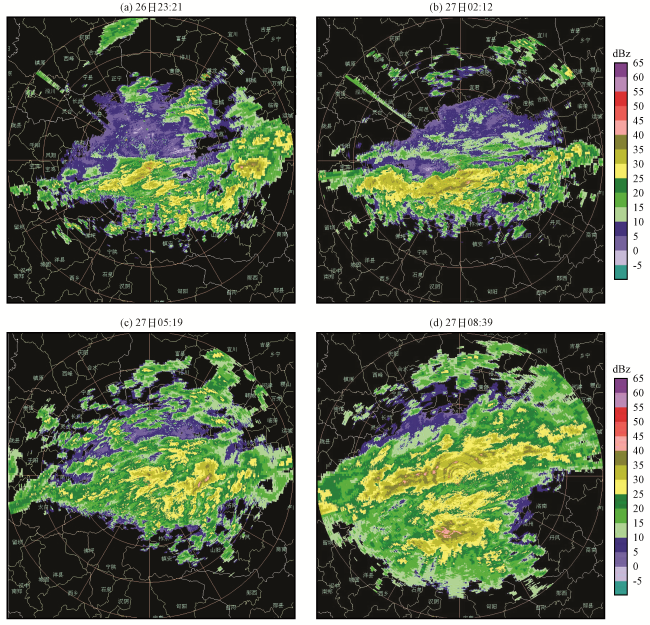
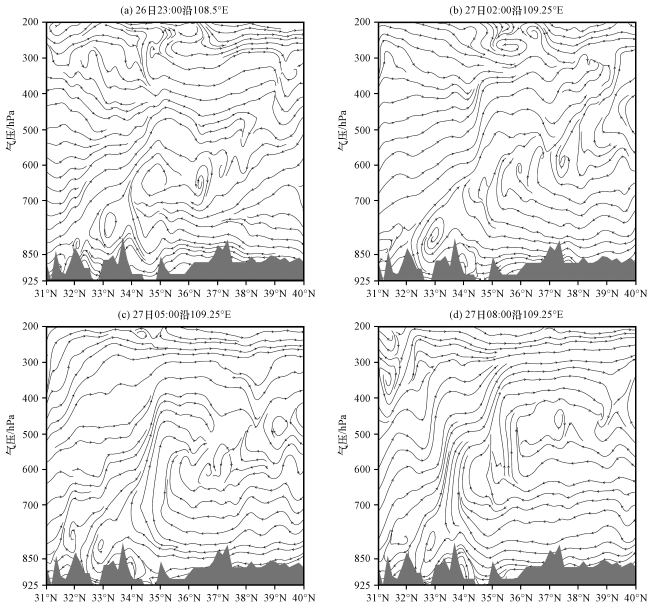
图9 2017年9月26日23:00至27日08:00垂直速度扩大负30倍(单位: Pa·s-1)和经向风(单位: m·s-1)经向环流阴影为地形 Fig.9 The meridional circulation of vertical velocities [unit: ×(-30)Pa·s-1] and longitudinal wind (unit: m·s-1)from 23:00 on 26 to 08:00 on 27 September 2017.The area of shaded grey color represent for terrain |