
1 引言
作为气候变化的基本要素之一, 降水是一种复杂自然事件, 在时间和空间上都表现出显著的多变性(Zhao et al, 2017)。作为陆地水循环的重要组成部分, 降水不仅是陆地表面重要的水源补给, 还对土壤-水分状态密切相关的生态系统和农业生产力、 水分和温度状态函数关联的生物地球化学过程以及依赖于水资源可持续性经济系统的功能等具有重要的作用(Kumar, 2013; Roque-Malo et al, 2017)。降水的改变对局地水文过程、 物候特征有重要影响, 理解不同尺度下降水的时空格局, 将有利于水资源的管理和决策支持系统的设计, 对当地农作物生产、 预测和降低相关气候和农业风险有指示性作用(Wagener et al, 2010)。
中国疆域辽阔, 经纬跨度大, 地形落差显著, 一些特定的等降水量线反而成为中国自然区划的重要参考指标。如400 mm等降水量线, 将中国划分为东部湿润半湿润区、 西部干旱半干旱区两部分; 而200 mm等降水量线, 以西为干旱区、 以东为半干旱区; 800 mm等降水量线, 后者是中国北方半湿润区和南方湿润区重要的分界线(王浩等, 2005; 李雪萍等, 2016)。此外, 800 mm等降水量线还是河流结冰与不结冰的重要分界线(汤瑞琪, 2015), 空间位置约在秦岭-淮河-青藏高原东南边缘一带。受中国陆地降水时空特征的变化, 800 mm等降水量线空间位置也随着发生变化。虽然已有部分学者对中国等降水量线的年代变化和空间分布做了相关研究(袁喆等, 2014; 李雪萍等, 2016; 吴凯等, 2017; 潘欣等, 2019), 但均使用中国气象站点观测资料(点数据)计算, 气象站点的空间分布非常有限, 并不能在空间上全覆盖, 使其在空间上的代表性具有一定局限。如李雪萍等(2016)基于1960 -2013年中国573个气象站月降水资料, 采用克里金插值法将站点降水量插值到面上分析; 而袁喆等(2014)基于1961 -2010年中国754个气象站日降水资料, 采用协同克里金插值法将站点降水量插值到面上。吴凯等(2017)则基于1961 -2014年的格点数据, 利用国家基础地理信息系统中所使用的China Lambert Conformal Conic投影坐标系统对空间点数据进行反距离权重法分析后绘制年降水特征的空间分布图, 再采用Pearson相关系数方法分析要素间的相关性。空间插值方法本身存在一定的不确定性, 对于时间序列问题的研究, 尤其需要注意。同时, 二者在评估等降水量线的空间移动时均采用了中心位置, 即袁喆等(2014)利用ArcGIS中的mean center工具, 而李雪萍等(2016)将空间位移分解为经向和纬向两个方向, 采用权位置来表征等降水量线的整体位移, 吴凯等(2017)则采用重心模型进行重心计算, 分析降水的聚散、 迁移和优势分布状态。
国际降水工作组(International Precipitation Working Group, IPWG)自2001年成立以来(Maggioni et al, 2016), 不断推动地面观测信息检验不同卫星降水产品的开发利用和再分析降水产品质量工作的进行, 同时也促进了我国高时空分辨率融合降水产品的发展, 进一步推动了中国逐日格点降水量实时业务系统的开发和运行。随着中国地面降水0.5°×0.5°格点数据集的发布, 降低了长时间序列降水数据在气候变化、 水循环过程以及物候特征研究中由不同插值方法带来的误差(Hutchinson, 1995, 1998; 高歌等, 2007; NMIC, 2012), 在极端降水和雪雨比等相关研究中得到了广泛应用(任国玉等, 2000; 董蕾等, 2014; 林厚博等, 2015; Ren et al, 2015; Shen et al, 2015; Wang et al, 2013, 2016)。因此, 该数据集为解决中国区域内降水空间特征及其变化进程提供了更可靠的资料。
随着全球气候的不断变暖, 有研究指出中国干旱区的暖温带、 中温带北界普遍北移, 使得天然植被与作物北界向西北和高海拔地区迁移, 在中国东部温度带普遍北移的同时, 干湿区分界线发生了显著的移动(万英等, 2002; 张雪芹等, 2011; 郑景云等, 2013)。800 mm等降水量线作为我国东部季风区重要的地理分界线, 与气候变化进程密切相关。鉴于此, 本研究以中国地面降水0.5°×0.5°格点数据集(V2.0)为基础资料, 提取不同时间尺度下中国东部季风区800 mm等降水量线的空间分布位置, 借助GIS空间分析功能与其他统计学方法, 计算等降水量线的重心位置, 追踪其空间位移变化。以期能更好地理解全球气候变暖背景下中国800 mm等降水的空间分布和移动特征, 对中国东部地区南北方的地理分界、 物候变化和自然灾害的监测等提供参考依据。
2 数据来源与方法介绍
2.1 数据来源
所用的长时间序列、 高分辨率气象数据集为中国地面降水0.5°×0.5°格点数据集(V2.0), 来源于国家气象信息中心(http: //data.cma.cn/)。该数据集是基于国家气象信息中心2472个中国地面高密度国家级气象观测站的降水资料, 结合GTOPO30 DEM数据集而生产的, 以ASCII码格式存储, 数据经交叉验证、 误差分析表明: 质量较好(国家气象信息中心, 2012)。且该数据集进行插值误差分析后, 能够更加准确地描述中国大陆降水空间场上的主要分布特征和数量特征(赵煜飞等, 2014)。需说明的是, 该数据集为日数据, 始于1961年, 由于2016年和2017年日数据缺失较为严重, 故本文只选取1961 -2015年的日数据进行降水量特征提取和分析。同时, 中国自然区划采用赵松乔提出的自然区划(王静爱等, 2009)。本文主要关注东部季风区800 mm等降水量线的时空特征。文中涉及的地图是基于国家测绘地理信息局标准地图服务网站下载的审图号为GS(2016)1603号的中国地图制作, 底图无修改。
2.2 研究方法
2.2.1 Mann-Kendall检验方法
首先, 基于MATLAB平台编程, 将日降水数据处理为年降水量, 并基于年数据计算不同时间尺度的多年平均年降水量, 主要包括1年、 5年、 10年、 20年、 30年以及1961 -2015年6种时间尺度的平均年降水量。其次, 基于ArcGIS软件, 将ASCII码数据转换为ArcGIS软件的通用数据格式(.grid), 利用重分类、 栅格-矢量转换等工具, 提取东部季风区800 mm等降水量线, 且通过人机交互式解译方法对其人工跟踪、 平滑处理。再次, 基于空间分析模块, 计算各时间尺度下等降水量线的空间重心位置。最后, 结合专业制图和统计软件计算其空间重心的经向和纬向移动趋势, 并做深入分析。
MK检验方法: Mann-Kendall是一种非参数统计检验方法(Mann, 1945; Kendall, 1975), 常用于水文、 气象等长时间序列变化趋势的突变点检测。该检测方法的优点是可以应用于一组没有显著分布特征的时序数据, 检测范围大且不易受少数异常值干扰。本研究中, 800 mm等降水量线空间重心移动的趋势检测在MATLAB中实现。
2.2.2 等降水量线空间重心
GIS空间分析中, 研究一个多边形从一个区域到另一个区域的空间移动时, 往往需要将该图形的兴趣变量分配给一个特定点来近似, 如质心或中心, 有时也被称为“操作点”, 以此作为图形的“代表”, 方便计算和追踪, 质心作为专业术语, 经常被定义为一个物体或若干物体集合名义上的重心(De et al, 2008)。通过对降水重心的分析, 有利于多个维度观察事物变化特征。在空间维度上, 重心模型反映区域发展指标与形心分析的契合程度, 便于分析研究区域要素在空间上的流动性与聚集性; 在时间维度上, 区域重心动态变化表示区域要素分布的对比和转移, 有助于深化研究区域发展历程、 状态和趋势(Zhang et al, 2004; 袁喆等, 2014)。
式中: 和 为重心坐标; 和 是空间上降水等值线上点的坐标; 是等值线空间处理后的赋值, 用于计算等值线坐标点的空间权重, 空间重心位置的确定在ArcGIS 10.02软件的空间分析模块完成(吴秀芹等, 2007)。
2.2.3 集合经验模态分解EEMD原理
集合经验模态分解(Ensemble Empirical Mode Decomposition, EEMD)是一种近年来发展的时间上局部自适应时间序列分析技术, 适合于分析非线性、 非平稳的时间序列, 把原数据表示成有限个周期成分或者分解为有限个本征模态函数(Intrinsic Mode Function, IMF)和一个趋势项的叠加, 且无需事先引入基函数(Wu et al, 2007, 2009)。该方法原理较为简单: 利用多次测量取平均值的原理, 通过在原数据中加入适当大小的白噪音来模拟多次观测的情景, 经多次计算后作集合平均。由于白噪声的频谱均匀分布, 在原始数据信号中引入白噪声, 将使得信号自动分布到合适的参考尺度上, 噪音经多次平均后相互抵消。这样集成均值的计算结果就可以直接视作最终结果。该方法在气候变化的周期性和非线性研究中使用较为广泛, 如Ji et al (2014)利用EEMD对全球陆地气温的非线性趋势进行了分解计算, 并发现1980年之后有加速升温的趋势。文中EEMD对原始数据的分解均在MTALAB中编程计算。
3 结果与分析
3.1 不同时间尺度下800 mm等降水量线空间分布
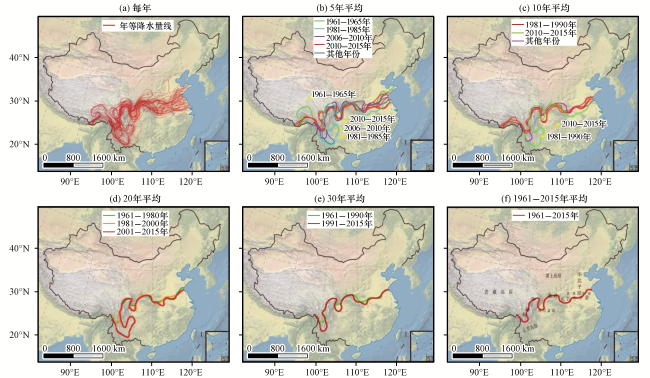
中国东部季风区800 mm等降水量线空间上总体表现为东北-西南向分布, 不同区域不同时间尺度800 mm等降水量线具有明显的差异性波动。为方便分析, 不妨以105°E作为参考线, 将800 mm等降水量线划分为东段和西段两部分。如图1(a)所示, 1961 -2015年800 mm等降水量线经向变化介于23°N -40°43'N, 华北平原南部至长江中下游平原、 云贵高原波动幅度较大, 秦岭、 黄土高原西南以及藏东一带分布相对集中, 且整体向南偏移。5年平均年降水量分析表明[图1(b)], 800 mm等降水量线东西部波动幅度较年际变化相对平缓, 但仍有明显波动, 波动较大的时间主要为1961 -1965年、 1981 -1985年、 2006 -2010年、 2011 -2015年, 藏东南和云贵高原西部地区波动同样显著。尤其是1961 -1965年期间, 800 mm等降水量线在藏东南向西北方向移动的幅度最大。东段最北界为1961 -1965年, 位于36°18′N, 即山东丘陵中部, 最南位于33°36′N, 其重心移动的极值直线距离为293 km, 波动较大区域主要位于黄淮平原一带。10年平均800 mm等降水量线空间分布上总体与5年平均分布相近[图1(c)], 1981 -1990年和2001 -2015年的空间变化最为显著, 其变化主要发生在藏东南-云贵高原一带, 2011 -2015年藏东南的800 mm等降水量线向东南方向移动较为显著。20年和30年平均分布表明[图1(d)~(e)], 800 mm等降水量在1961 -2000年的空间分布相似, 2000 -2015年的变化相对明显, 尤其是藏东南地区, 800 mm等降水量线空间上向东南方向迁移的现象十分明显。总体分析, 东部季风区800 mm等降水量线在1961 -2015年呈东北-西南分布, 受地形和季风等影响, 东西段差异显著。
3.2 800 mm等降水量空间重心分布
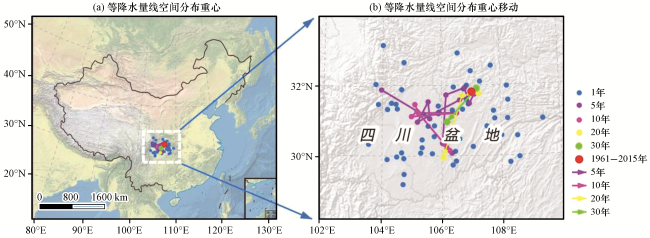
利用GIS空间分析功能, 计算不同时间尺度下800 mm等降水量的空间重心位置(图2)。图2显示, 不管是何种时间尺度, 中国东部季风区800 mm等降水量线的空间重心主要集中分布于四川盆地及其周边地区, 经度范围介于101°49'44"E -108°32'55"E, 纬度介于29°30'16"N -34°5'31"N, 经向迁移直线距离最大为513.31 km, 纬向最大迁移距离为651.95 km。随着时间尺度的增大, 800 mm等降水量线的空间重心位置向四川盆地内部分布。此外, 10年、 20年、 30年尺度的等降水量线空间重心主要分布于川东北, 且各时间尺度下重心位置随时间变化而变化。1961 -2015年期间800 mm等降水量线的空间重心位置分布于川东北, 且2000年之后空间重心变化较为显著。
3.3 800 mm等降水量空间重心迁移
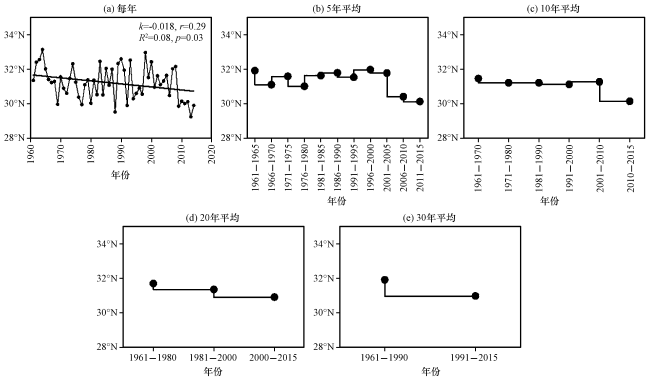
为了进一步理解800 mm等降水量线的空间变化, 将其移动方向分解为经向和纬向两个方向。图3为800 mm等降水量线空间重心分布年际和年代际的经向变化, 其中, 1961 -2015年空间分布重心有明显向低纬移动的趋势, 且年际波动较大[图3(a)]。5年尺度分析, 1961 -2000年等降水量线空间分布重心表现出南北交替变化的波动趋势; 2000年后, 尤其是2006 -2010年期间, 空间重心表现出显著南移趋势[图3(b)], 10年尺度分析也表现出类似规律。20年尺度分析表明, 800 mm等降水量线的空间分布重心在1961 -1980年、 1981 -2000年、 2000 -2015年均表现为南移趋势, 即向低纬度方向移动, 且前两个阶段南移幅度之和与第三阶段移动相仿。因此, 经向移动分析表明, 800 mm等降水量线的空间分布重心在1961 -2015年具有显著的南移趋势。
3.4 800 mm等降水量空间分布重心移动趋势非线性分析和突变评估
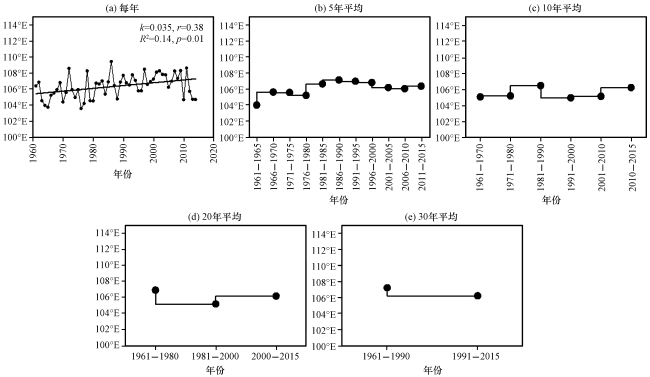
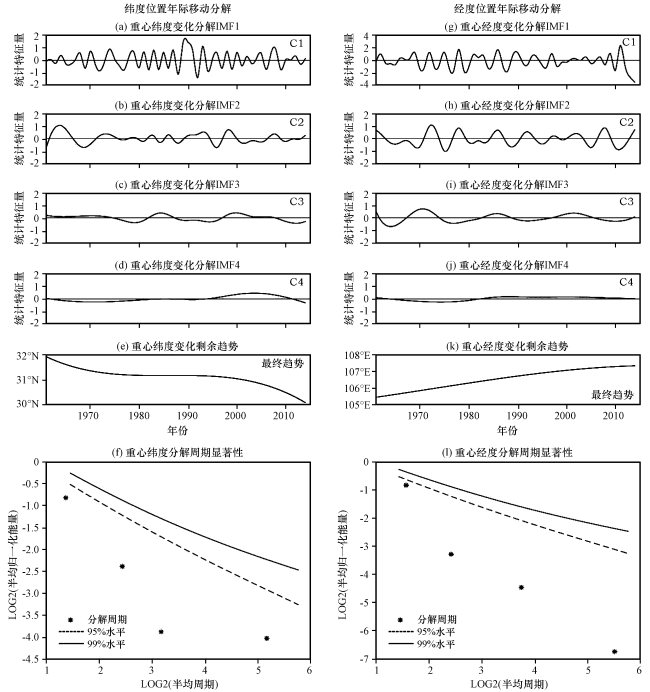
结合800 mm等降水量空间分布重心的经向和纬向分析, 年际尺度[图3(a), 图4(a)]研究表明空间分布重心有一定的规律性, 即向南(或者低纬度)、 向东移动, 但5年、 10年、 20年、 30年时间尺度分析中, 并未呈现明显的统一的移动规律, 即800 mm等降水量线在此4种时间尺度下的空间变化与年际变化差异较大。基于此, 对图3(a)和图4(a)中等降水量线空间分布重心年际变化进行集合经验模态分解, 即EEMD分析。图5(a)~(f)为利用EEMD对经向变化信号[图3(a)]的分解结果, 其中, 图5(a)~(d)为分解图3变化曲线的本征模式函数(IMFs), 图5(e)为去除周期和噪声干扰的最终经向变化趋势线, 图5 (f)为提取经向信号IMFs对应4个周期的显著性检验, 该4个周期均未通过显著性检验, 即重心位置经向变化未检测到显著的周期。同理, 图5(g)~(l)为利用EEMD对纬向变化变化信号[图4(a)]的分解结果, 其中图5(g)~(j)为分解的IMFs, 图5(k)为去除周期和噪声干扰的最终纬向变化趋势线, 图5 (l)为提取纬向信号IMFs对应4个周期的显著性检验, 而分解的4个周期均未通过显著性检验, 即重心位置纬向变化波谱中未检测到显著的周期。总之, EEMD分解后可得到800 mm等降水量线空间分布重心经向和纬向变化的最终趋势线, 表明年际变化有向南、 向东移动的明显趋势。
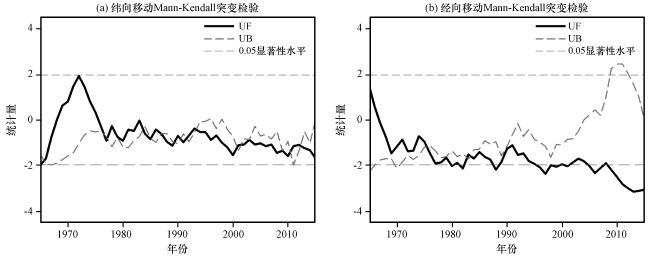
中国东部季风区800 mm等降水量线空间分布重心沿经向有明显的低纬移动趋势, 即向南移动, 而纬向年际移动具有明显的东移趋势。为了进一步明确800 mm等降水量线空间分布重心在经向和纬向的年际变化趋势是否发生显著改变, 即突变。在此, 采用水文学和气象学中常用的MK突变检验方法对重心年际变化趋势进行突变检验, 结果如图6所示, 800 mm等降水量线空间重心沿纬线和经线方向移动具有多变性, 即波动较为强烈, 空间分布的移动趋势突变点并不显著。因此, 中国东部季风区800 mm等降水量线空间分布重心的变化较为强烈, 但其长期变化趋势并未发生显著突变。
4 讨论
中国东部季风区800 mm等降水量线在空间分布上具有明显的分布特征, 其空间分布重心在1961 -2015年发生显著变化。其中, 东西段变化差异明显, 经向和纬向方向移动趋势和变化规律存在差异性。据李雪萍等(2016)研究表明, 华中地区800 mm等降水量线在20世纪80年代、 21世纪00年代分别北移15~54 km和48~181 km, 20世纪90年代、 21世纪10年代初分别南移0~171 km和38~152 km, 与黄淮平原等降水量线的移动规律相符。此外, Ren et al (2015)研究指出在 1960-1996年夏季长江中下游降水呈增加的趋势, 而在黄河中下游呈减少的趋势。Wang et al (2005)分析了 1961 -2001 年中国年度和季节平均总降水量变化情况, 指出年平均降水在西南、 西北和东部地区有增加的趋势, 而在中部、 北部和东北部地区有减少的趋势, 并且这种变化趋势基本上与平均降水变化一致。该降水时空变化特征, 与本文800 mm等降水量线的时空变化都反映出相同的规律。
薛峰(2001)通过对东亚夏季风EASM(The East Asian summer monsoon)的年代变化研究得出EASM与全球大气环流和海表温度(SST)密切相关, 其指数变化与我国降水时空分布密切相关。薛峰等(2018)分析了1998年和2016年的Niño3.4指数、 副高指数、 脊线指数, 指出东亚夏季风存在显著的季节性变化, El Niño指数与中国降水的时空分布尤其是长江以南地区的降水分布密切相关。李娜(2016)分析了东亚冬季风(EAWM, East Asian Winter Monsoon), 对1948年1月到2015年9月67年全球大气月平均NCEP/NCAR数据进行16个EAWM指数分析得出东亚冬季风强度变化整体减弱, 且其整体上与降水呈正相关。此外, 肖志祥等(2018)研究表明长江流域夏季降水异常与ENSO关系密切。可知, 本研究中800 mm等降水量线空间分布重心的南偏与全球气候变化背景下季风强弱变化以及El Nino现象有关。
相关研究也表明陆地季风降水受全球太平洋年代际振荡(Pacific Decadal Oscillation, PDO)、 大西洋多年代际振荡(Atlantic Multidecadal Oscillation, AMO)的影响, 其中PDO与亚洲季风变化关系最为显著(Mantua et al, 2002; Schubert et al, 2009; 王先芳, 2014)。太平洋年代际振荡(PDO)是一种年代际时间尺度上的气候变率强信号, 被认为是叠加在气候长期变化趋势上的一种扰动, 能够引起太平洋及其周边地区气候的年代际变化, 对ENSO等气候事件的年际变化有一定调节作用(杨修群等, 2004)。PDO的时间尺度具有多重性, 主要表现为20年周期和50年周期, 我国地区气候变化的年代际波动与PDO的相位变化关系密切(朱乾根等, 1997)。例如, 当PDO 为暖(冷)相位(或事件)时, 亚洲季风降水减少(增加)(王先芳, 2014; 黄悦等, 2019)。对我国东部季风区而言, 当PDO处于暖相位时, 华北、 华南以及东南地区降水量发生异常, 且明显偏少, 而华东、 长江中下游地区降水显著增多; 当PDO处于冷相位时反之(于淼等, 2015)。此外, 从地质学角度也被证明中国东部季风降水受PDO的显著影响(姚嘉惠等, 2018), 而PDO在近20~30年存在明显的年代际转折, 很可能是东亚夏季风减弱的主导原因(Zhu et al, 2015; 王欢等, 2019)。总而言之, 我国东部季风区800 mm等降水量空间变化在不同时间尺度下的变化不同, 是由于大气环流、 地形、 局地热力差异(许田田等, 2018)等综合作用所致, 而年际变化的强迫因子主要是ENSO主导, 年代际变化受PDO的显著影响。
5 结论
受东亚季风和南亚季风影响, 中国东部季风区800 mm等降水量线空间分异特征显著、 年际和年代际变化差异明显。本文基于高分辨率中国地面降水0.5°×0.5°格点数据集, 结合GIS空间分析和时序分析等方法, 对中国东部季风区1961 -2015年800 mm等降水量线时空变化特征进行研究, 得到如下主要结论:
(1) 1961 -2015年中国东部季风区800 mm等降水量线空间分布存在明显波动, 其中, 分布于黄淮平原和藏东南地区的等降水量线年际和年代际波动较大。同时, 等降水量线的空间分布重心位于四川盆地东北地区。
(2) 中国东部季风区800 mm等降水量线空间分布重心移动的并没有显著的周期变化特征, 但其分布重心在空间上具有向东、 向南的移动趋势, 且均通过了0.05的显著性水平检验。
(3) 等降水量线空间分布重心沿经向和纬向的显著变化过程中, MK突变分析并未检测到显著的突变点, 即800 mm等降水量线空间移动趋势并未发生显著的突变。
此外, 中国东部季风区800 mm等降水量线的空间分布和时序变化较为复杂, 深受大气环流、 地形以及局地气候等影响。但其空间变化主要受ENSO和PDO影响, 前者主导年际变化, 后者主要影响其年代际波动。