
1 引言
2 资料来源与方法介绍
3 结果分析
3.1 5月青藏高原感热和印度洋海温与新疆夏季降水的奇异值分解分析
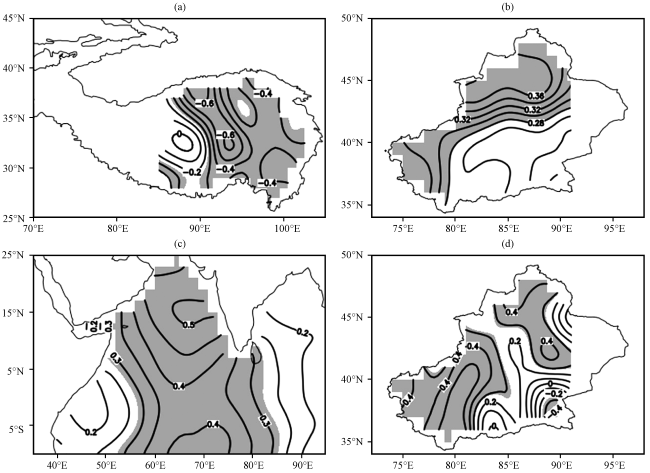
图2 5月青藏高原地表感热(a)和印度洋海温(c)分别与新疆夏季降水奇异值分解分析的第1模态(b, d)分布阴影部分表示通过95%信度检验 Fig.2 The first mode in the SVD expansion for the correlations between the sensible heat in the Qinghai-Xizang Plateau (a) and the temperature in Indian Ocean (c) in May and the summer time precipitation in Xinjiang (b, d).The shaded represent that it is significant at the 95% confidence level |
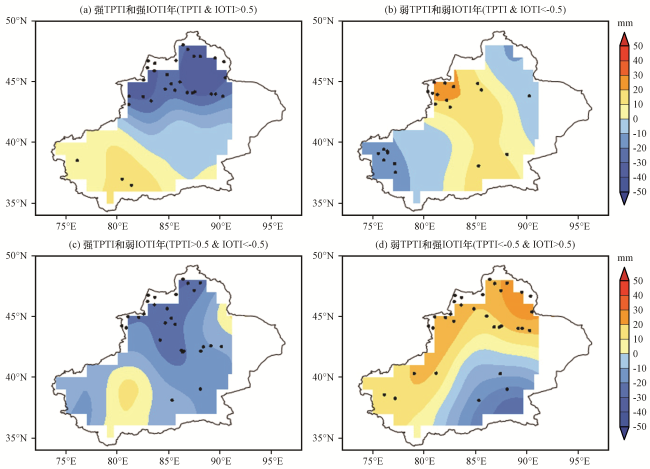
表1 TPTI和IOTI热力异常的4种情况Table 1 Four configurations of thermal anomalous TPTI and IOTI years |
| 类别 | TPTI | IOTI | 年份 |
|---|---|---|---|
| (a) | >0.5 | >0.5 | 1983, 2012, 2014 |
| (b) | <-0.5 | <-0.5 | 2002, 2004 |
| (c) | >0.5 | <-0.5 | 1979, 1981, 1982, 1984, 1985, 1986 |
| (d) | <-0.5 | >0.5 | 1998, 2003, 2009, 2010, 2016, 2017 |
实下划线年份为根据NINO34指数确定的EL Niño年; 虚下划线年份为La Niña年 |
表2 TPTI或IOTI独立异常的4种情况Table 2 Four configurations of anomalous TPTI or IOTI years |
| 类别 | TPTI | IOTI | 年份 |
|---|---|---|---|
| (a) | >0.5 | <|0.25| | 1994, 2006 |
| (b) | <-0.5 | <|0.25| | 2000, 2001, 2011, 2013 |
| (c) | <|0.25| | >0.5 | 1991, 2007, 2015 |
| (d) | <|0.25| | <-0.5 | 2008 |
3.2 5月青藏高原感热和印度洋海温异常对新疆夏季降水的共同影响
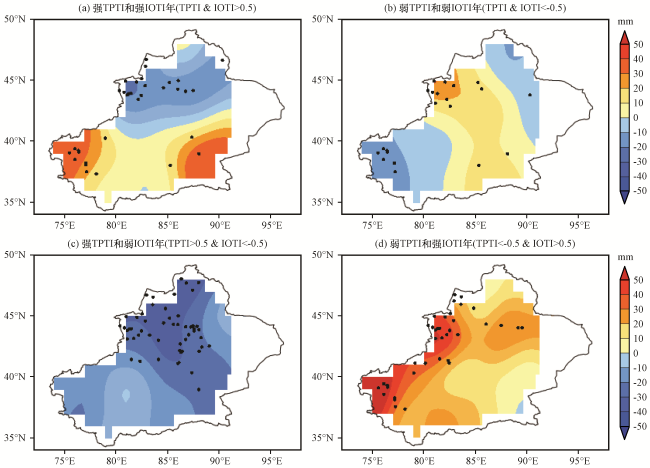
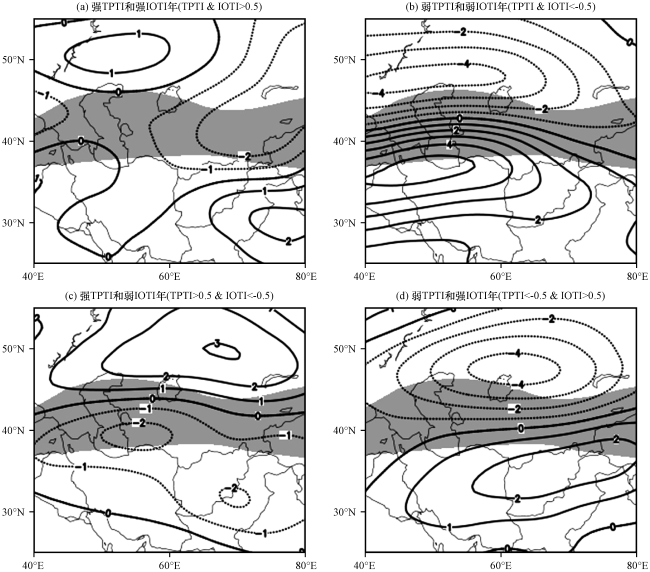
图4 中亚夏季200 hPa纬向风异常的合成分析分布特征(等值线, 单位: m·s-1)阴影部分为风速大于25 m·s-1的副热带西风急流区域 Fig.4 Composite distributions of summer zonal wind anomalies (contour, unit: m·s-1) at 200 hPa in Central Asia.The shaded denote the climatological axis of the subtropical westerly jet where wind speeds are larger than 25 m·s-1 |
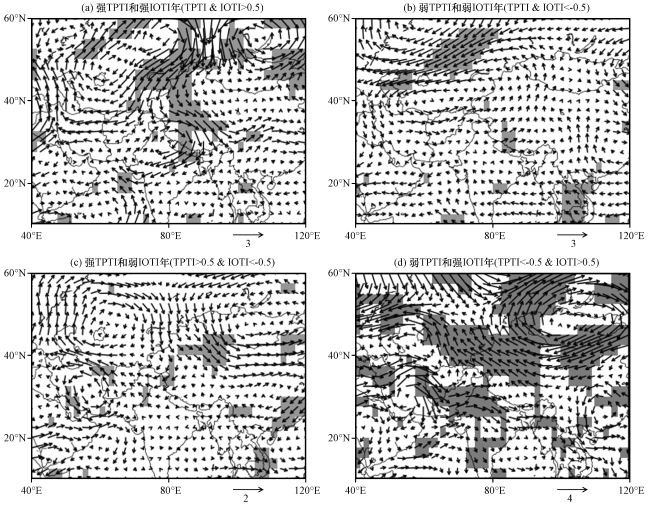
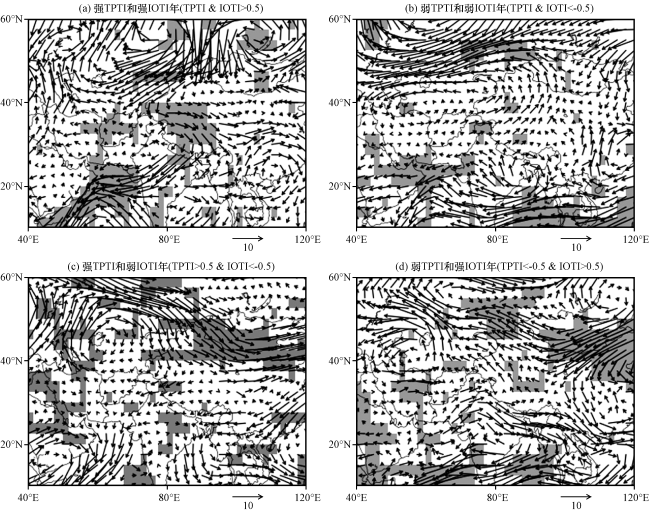
图6 中亚夏季水汽通量(从地表积分至300 hPa)异常的合成分析分布特征(矢量, 单位: kg·m-1·s-1)阴影部分表示通过了95%信度检验 Fig.6 Composite distributions of summer water vapour flux anomalies (vector, unit: kg·m-1·s-1) that are vertically integrated from the surface to 300 hPa in Central Asia.The shaded represent the water vapour flux anomalies have passed 95% significant confidence level |
3.3 5月青藏高原感热和印度洋海温对新疆夏季降水的单独影响
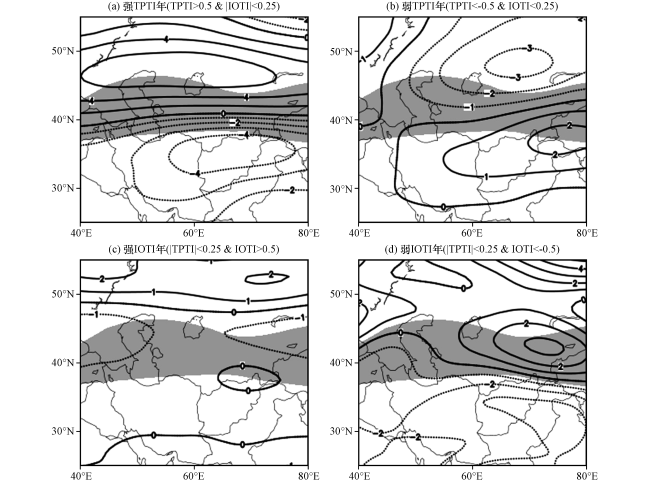
图8 中亚夏季200 hPa纬向风异常的合成分析分布特征(等值线, 单位: m·s-1)阴影部分为风速大于25 m·s-1的副热带西风急流区域 Fig.8 Composite distributions of summer zonal wind anomalies (contour, unit: m·s-1) at 200 hPa in Central Asia.The shaded denote the climatological axis of the subtropical westerly jet where wind speeds are larger than 25 m·s-1 |
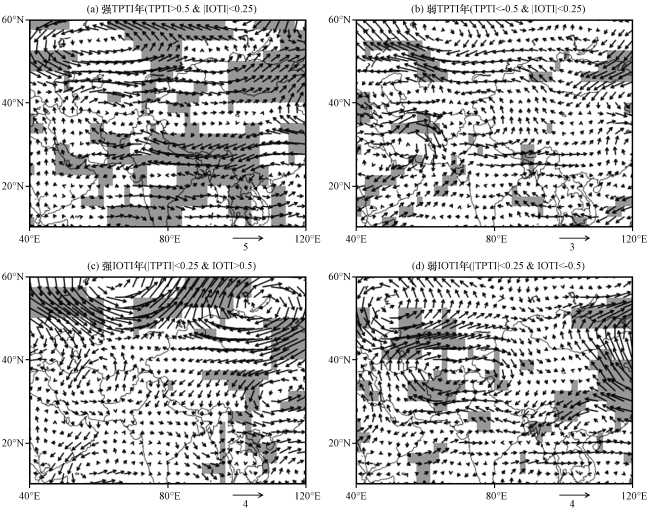
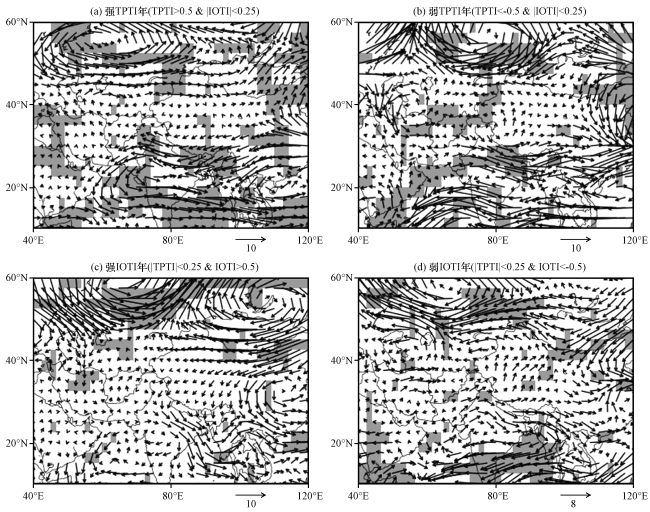
图10 中亚夏季水汽通量(从地表积分至300 hPa)异常的合成分析分布特征(矢量, 单位: kg·m-1·s-1)阴影部分表示通过了95%信度检验 Fig.10 Composite distributions of summer water vapour flux anomalies (vector, unit: kg·m-1·s-1) that are vertically integrated from the surface to 300 hPa in Central Asia.The shaded represent the water vapour flux anomalies have passed 95% significant confidence level |
4 讨论
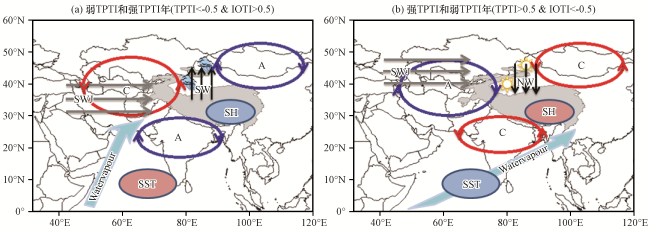
图11 5月高原感热和印度洋海温异常对新疆夏季降水协同影响的机制示意图A和C分别为异常反气旋和异常气旋; SH为高原感热; SST为印度洋海温; 红(蓝)色阴影为正(负)异常; SWJ为副热带西风急流; SW(NW)为南(北)风异常; 灰色阴影为海拔3000 m以上区域 Fig.11 Sketch map in the concurrent effects of thermal anomalies over the QXP and IO in May on summer rainfall in Xinjiang.The capital A and C represent the anomalous anticyclone and cyclone; SH represents the sensible heat over the QXP;SST represents the sea surface temperature over the IO; The blue and red shaded areas represent negative and positive SH and SSTs anomalies, respectively; SWJ represents the subtropical west wind jet; SW (NW) represents south (north) wind anomalies; The grey shaded represents terrain heights over 3000 m |