1 引言
2 资料来源与方法介绍
2.1 研究区概况
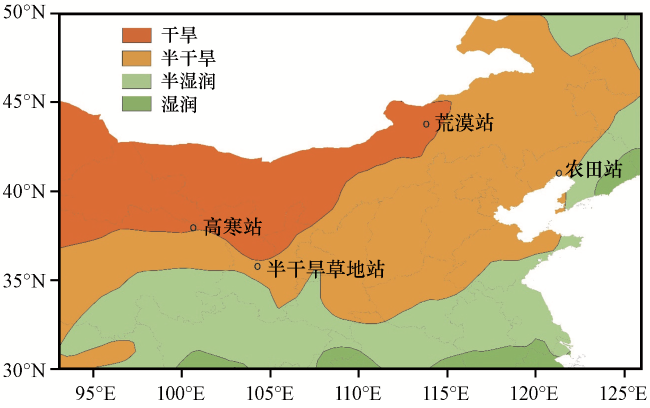
图1 观测站的地理分布及气候分区 [根据曾剑等(2011)改绘]Fig.1 Geographical distribution and climatic zoning of the observatory [According to Zeng et al (2011)] |
表1 不同下垫面站点的气候要素Table 1 Climatic elements of different underlying surface sites |
| 站点 | 下垫面类型 | 年降水量 /mm | 平均 气温/℃ | 全年日照时数/h | 年均蒸发 /mm |
|---|---|---|---|---|---|
| 祁连* | 高寒草甸 | 403.1 | 0.7 | 2918.0 | 700.0 |
| 东苏 | 荒漠草地 | 197.0 | 3.3 | 3196.0 | 2678.0 |
| 锦州 | 玉米农田 | 565.9 | 9.5 | 2699.6 | 1747.4 |
| 榆中 | 半干旱草地 | 381.8 | 6.7 | 2607.2 | 1528.5 |
*阿柔站常规气象资料缺失严重, 使用祁连站作为其替代站 |
2.2 观测资料及数据处理
2.3 地表能量平衡
2.4 土壤热通量
2 cm和5 cm的土壤温度能够通过观测得到, 0 cm的土壤温度可由下式换算得到
2.5 Bowen比和蒸散系数
3 结果与分析
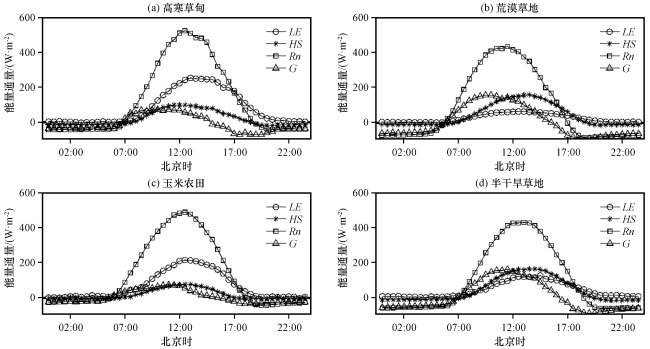
3.1 不同下垫面能量通量各平衡分量的日变化特征
3.2 地表能量闭合度
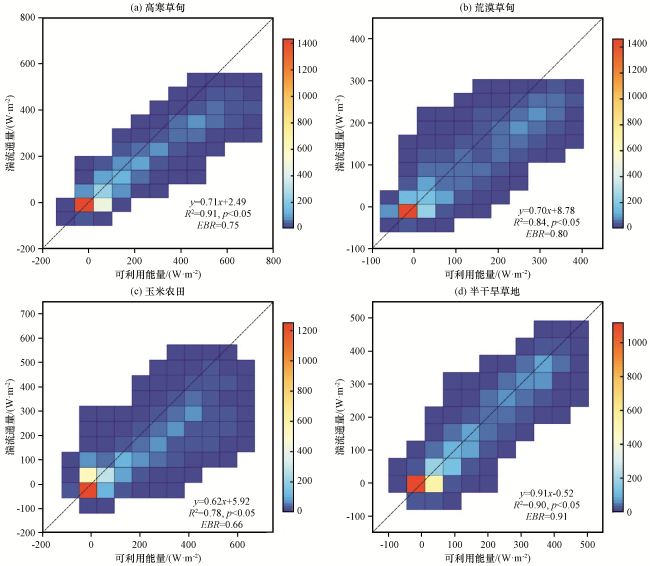
图3 2008年7 -9月不同下垫面的能量平衡分析结果色标代表EBR的个数 Fig.3 Energy balance analysis results of different underlying surfaces from July to September 2008.The color bars represent the count of EBR value |
表2 中国北方四类典型下垫面的能量闭合度Table 2 Energy closure of four typical underlying surfaces in north China |
| 下垫面 | 斜率 | 截距 | 决定系数 | EBR |
|---|---|---|---|---|
| 高寒草甸 | 0.71 | 2.49 | 0.91 | 0.75 |
| 荒漠草地 | 0.69 | 8.78 | 0.84 | 0.80 |
| 玉米农田 | 0.62 | 5.92 | 0.78 | 0.66 |
| 半干旱草地 | 0.91 | -0.52 | 0.90 | 0.91 |
表3 不同下垫面的能量闭合度Table 3 Energy closure of different underlying surfaces |
| 下垫面 | 地理位置 | 斜率 | 截距 | 决定系数 | EBR | 数据来源 |
|---|---|---|---|---|---|---|
| 森林 | 芬兰北部 | 0.81 | 7.00 | 0.90 | 0.69 | Sánchez et al, 2010 |
| 玉米农田 | 中国中部 | 0.67 | - | 0.84 | - | Rahman et al, 2019 |
| 稻米农田 | 韩国 | 0.58 | 15.20 | 0.64 | 0.61 | Kim et al, 2014 |
| 工业集中区 | 韩国 | 0.46 | 24.74 | 0.63 | 0.61 | Kim et al, 2014 |
| 稀树草原 | 加州东部 | 0.85 | 12.00 | 0.91 | - | Castellvi et al, 2008 |
| 稀树草原 | 非洲南部 | 0.87 | 10.79 | 0.87 | 0.93 | Majozi et al, 2017 |
- 表示原文中未给出具体值 |
3.3 能量分量的分配特征
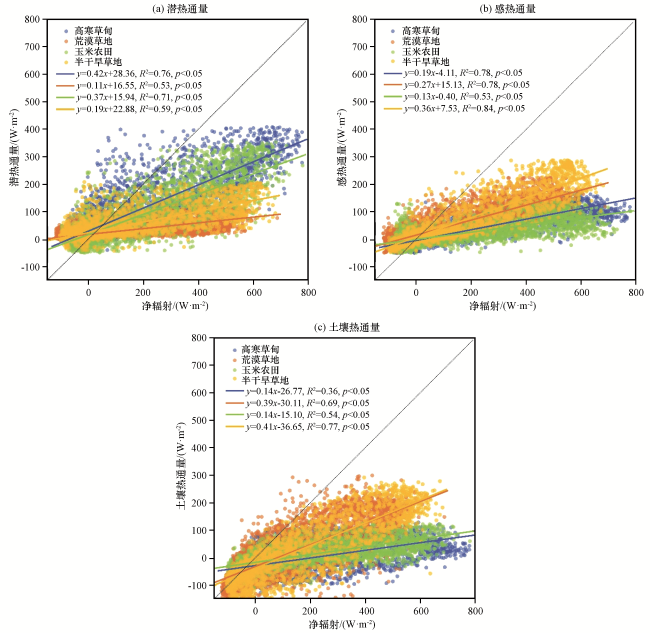
表4 不同下垫面各能量支出项与净辐射的关系Table 4 Relations between energy expenditure and net radiation on different underlying surface |
| 下垫面 | LE与Rn | H与Rn | G与Rn | |||||||||
|---|---|---|---|---|---|---|---|---|---|---|---|---|
| 斜率 | 截距 /(W·m-2) | 决定系数 | P值 | 斜率 | 截距 /(W·m-2) | 决定系数 | P值 | 斜率 | 截距 /(W·m-2) | 决定系数 | P值 | |
| 高寒草甸 | 0.42 | 28.36 | 0.76 | <0.05 | 0.19 | -4.11 | 0.78 | <0.05 | 0.14 | -26.77 | 0.36 | <0.05 |
| 荒漠草地 | 0.11 | 16.55 | 0.53 | <0.05 | 0.27 | 15.13 | 0.70 | <0.05 | 0.40 | -30.11 | 0.66 | <0.05 |
| 玉米农田 | 0.37 | 15.94 | 0.71 | <0.05 | 0.13 | -0.40 | 0.53 | <0.05 | 0.14 | -15.10 | 0.54 | <0.05 |
| 半干旱草地 | 0.19 | 22.88 | 0.59 | <0.05 | 0.36 | 7.53 | 0.84 | <0.05 | 0.41 | -36.54 | 0.77 | <0.05 |
3.4 能量分量影响因子
表5 单一下垫面NDVI与湍流通量的线性回归参数Table 5 Parameters of the linear regression between the turbulent flux and NDVI for single underlying surface |
| 下垫面 | LE与NDVI | H与NDVI | ||||||
|---|---|---|---|---|---|---|---|---|
| 斜率 | 截距(W·m-2) | 决定系数 | P值 | 斜率 | 截距(W·m-2) | 决定系数 | P值 | |
| 高寒草甸 | 506.22 | -15.15 | 0.82 | <0.05 | -92.57 | 122.83 | 0.25 | >0.05 |
| 荒漠草地 | 43.38 | 50.01 | 0.01 | >0.05 | 151.69 | 97.22 | 0.09 | >0.05 |
| 玉米农田 | 280.20 | 15.62 | 0.82 | <0.05 | -129.06 | 129.72 | 0.75 | <0.05 |
| 半干旱草地 | 91.57 | 68.49 | 0.10 | >0.05 | -343.92 | 264.24 | 0.22 | >0.05 |
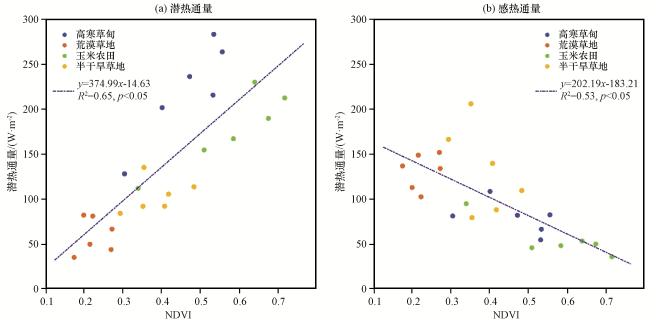
图7 典型下垫面NDVI与湍流通量的关系Fig.7 The relationship between NDVI and turbulent flux for typical underlying surface |
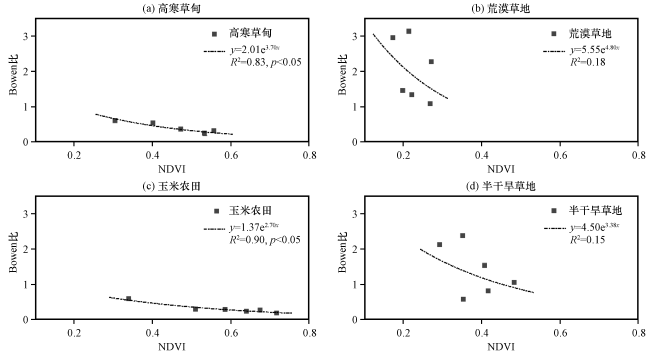
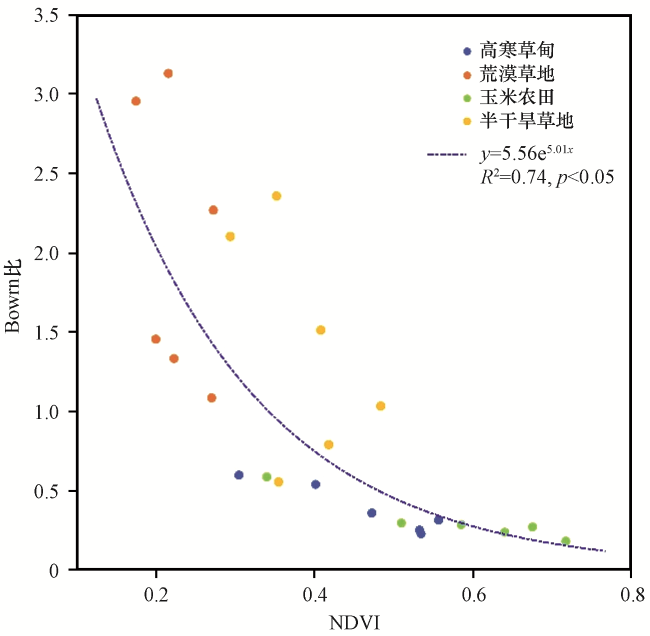
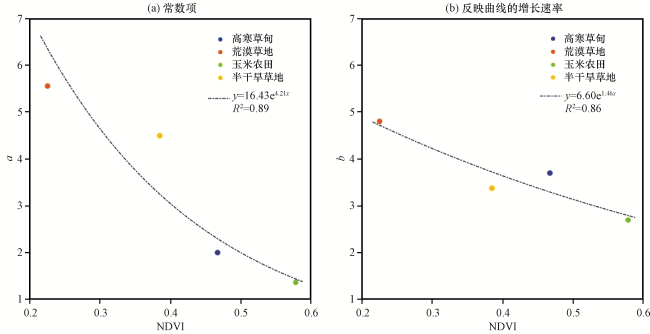
图8 单一下垫面NDVI对Bowen比的影响Fig.8 The influence of NDVI on Bowen ratio of single underlying surface |