
1 引言
随着社会经济的发展, 国内各行业对天气预报的准确性和时空分辨率要求不断提高。由于气象观测站点离散化分布, 导致依靠站点观测进行模式预报订正的传统模式后处理方法(张冰等, 2008; 孙靖等, 2015)无法满足精细化网格预报的要求。受中国气象局委托, 国家气象信息中心经过多年技术攻关, 完成中国区域(0° -60°N, 70°E -140°E)地面气象要素格点融合系统研发。该系统于2018年正式业务运行, 并向国省气象业务单位实时提供逐小时或逐日5 km分辨率格点融合产品(简称格点融合产品)集。
该地面气象要素格点融合系统采用两种技术路线生成相应的气象要素产品。对于2 m温度、 10 m风速等连续性要素, 该系统采用美国海洋大气局地球系统研究实验室(NOAA/ESRL)开发的时空多尺度分析系统(A space-time multi-scale analysis system, STMAS)(Xie et al, 2005, 2011)作为核心算法, 以ECMWF全球模式(空间分辨率为0.125°)的相应预报作为背景场, 对中国范围内的国家级和区域自动站进行融合而得。STMAS是一个多重网格和变分同化系统, 它视物理量的变化为长波和短波的叠加, 将分析区域分成不同分辨率的多重网格, 利用格点数控制分析尺度, 从粗网格开始, 逐步增加格点数, 以达到不断解析观测细节的目的(张涛等, 2014)。地面观测数据在进入融合系统前, 经过业务质控系统的处理(任芝花等, 2015), 被划分为包括数据正确、 数据可疑、 数据错误、 数据未作质量控制等在内的9种分类, 其中只有数据正确的观测被允许进入融合系统。
降水格点融合产品依据融合的观测种类不同采用的融合方法也有所差别。其中, 对于融合站点观测和卫星反演降水资料的二源融合产品, 采用PDF(概率密度函数)技术订正卫星降水系统误差加OI(最优插值)技术融入地面观测的两步融合方法制成(潘旸等, 2018a); 对于融合地面观测、 卫星和雷达反演降水资料的三源融合产品, 采取的是PDF订正卫星和雷达降水的系统误差, 再利用BMA(贝叶斯模式平均)方法融合两者形成最优初始场, 最后使用OI技术融入地面观测的技术路线。二源和三源融合产品均提供给业务单位使用。
目前, 众多科研人员利用上述格点融合产品作为初始场研发了多种二次开发产品, 对这些下游产品的检验工作很多(孙小龙等, 2015; 韩帅等, 2017; 师春香等, 2018; 曾小青等, 2019), 但对格点融合产品集全面和详细检验的工作却很少。因此, 本文对2018年全年5 km分辨率逐小时格点融合产品集中的地面2 m温度、 10 m风速(整点的2 min平均风速)及24 h累积[逐日08:00(北京时, 下同)至次日08:00]降水等三种业务运行的格点融合产品进行较为细致的常规检验和分析。希望通过此工作, 为使用者更好地应用这套格点融合产品集提供思路。
2 资料选取和插值方法
2.1 资料选取
2.1.1 非独立检验数据
选取2018年2380个国家级地面气象自动站观测数据作为检验真值。这些国家站为人工值守站, 其正确性可得到最大限度保证。因其站数和空间分布均匀度均比下文提到的机场观测站和水利部降水观测站更有优势, 故作为本文重点分析内容。由于这些国家级观测参与了格点融合产品制作中, 改检验称为非独立检验。下文检验结果除特别说明外, 均为此类检验。
2.1.2 独立检验数据
为尽可能全面反映实况格点融合产品的质量, 本文收集未被用于格点融合产品制作的中国机场站的温度和风及水利部观测的降水等观测数据进行独立检验。
其中, 机场观测站中挑选2018年到报率90%以上的10个站(广州白云、 杭州萧山、 上海浦东、 上海虹桥、 太原武宿、 大连周水子、 天津滨海、 北京首都、 沈阳桃仙和乌鲁木齐地窝堡)进行检验。由于机场站数量少且相隔较远, 无法利用自身观测进行有效质控。为此, 挑选各机场周围距离最近(距离均在10 km以内)且经业务质控系统证明可信的气象自动站观测与其进行对比; 分别得到两者在2 m气温和10 m风速之间的差别。去掉差别在±6σ(乌日柴胡等, 2019)以外的时次后, 得到质控后的机场观测值。
对水利部降水观测数据质控时, 以0.1°(10 km)为搜索半径, 找到与水利部测站相距最近的经业务质控系统证明可信的地面气象自动站(如果没有, 则剔除该水利部测站); 保留两者都有有效降水量或降水观测值均为0 mm的观测时次, 当一方有观测值另一方没有时, 如两者之间差值在10 mm内则保留, 否则剔除。利用此方式, 尽可能剔除可能影响检验结果的观测奇异值。质控后的水利部降水观测站在2万至3万, 每个时次不尽相同。
2.2 插值方法介绍
为了与站点观测进行对比, 针对连续性要素温度和风速等, 采用双线性插值法将格点融合产品插值到站点所在经纬度, 得到在站点位置的分析值。为减少地形高度对2 m温度格点产品检验的影响, 在插值过程中加入地形高度订正处理, 其中高程数据、 高度订正方法及方法中所用具体参数均与该产品制作单位保持一致(韩帅等, 2018)。
由于降水具有空间不连续的特点, 为最大限度地给出二源和三源融合产品准确性上限, 选用“最小误差”插值法作为独立和非独立检验降水格点融合产品的插值方法。该方法的主要思路是: 首先计算任意观测站点周围最近的四个格点的位置; 然后分别计算站点观测值与四个格点值之间的差值; 最后, 挑选其中差值绝对值最小的一个格点值作为该站点位置上的分析值。如果有2个及以上格点具有相同的偏差绝对值, 选择偏差小于0的格点值作为站点分析值。由此看出, 用这种插值方法计算出的检验结果, 特别是在均方根误差和平均误差检验中, 基本上是最优的。
3 检验方法
在总结前人检验工作的基础上(何晓凤等, 2014; 张蒙等, 2016; 崔园园等, 2018a, 2018b; 朱智等, 2018; 敖雪等, 2018; 潘旸等, 2018a), 选取均方根误差(RMSE)、 平均误差(ME)、 命中率(Hit)和Bias评分等对格点融合产品进行检验评估, 具体公式如下:
式中: n为样本总数; 为站点观测值; 为格点融合产品插值到站点位置的分析值。从平均误差公式可知, 当站点观测平均值大于格点融合产品的时, 平均误差大于0, 反之小于0。
根据检验对象的不同, 命中率指标的定义有所不同。计算温度和风速等要素的命中率公式如下:
0%
对于2 m温度, n为样本总数; h为站点观测值和站点分析值之间误差绝对值在2 ℃、 1 ℃或0.5 ℃以内的样本数, 其中2 ℃误差阈值的命中率与国家气象中心对温度预报业务检验的标准一致。对于10 m风速, n为站点观测值落在某一风速区间内的样本总数; h为站点观测值和站点分析值均落在同一风速区间内的样本数, 其中风速区间分别为[0.0, 3.3], [3.4, 7.9]和[8.0, 13], 分别对应0~2级、 3~4级和5~6级风速。命中率在0~100%之间变化, 越接近100%, 说明格点融合产品准确性越高。
计算降水的命中率(尤凤春等, 2009)和Bias评分(孙靖等, 2015)如下:
式中: 为站点观测值和站点分析值均在同一阈值区间内的样本数; 为站点观测值未在某一阈值区间但站点分析值在的样本数; 为站点观测值在某一阈值区间但站点分析值未在的样本数。降水阈值区间分别为(0, 0.1], (0.1, 10], (10, 25], (25, 50], (50, 100], [100, ∞)。
在非独立检验中, 对检验结果采取全国、 分省、 分月或分季节等统计方式。四季划分如下, 冬季为12月、 1月和2月, 春季为3 -5月, 夏季为6 -8月, 秋季为9 -11月。由于观测站数量少且分布不均匀, 独立检验只进行均方根误差和平均误差两种检验计算和时间统计, 不做空间统计。由于缺少观测数据, 澳门、 香港和台湾等特区或省份不在此次检验范围内。以下是具体检验结果。
4 地面2 m温度检验
4.1 误差的时间变化
2018年2 m温度格点融合产品全国平均均方根误差和平均误差分别为1.24 ℃和-0.08 ℃[图1(a)]。月平均均方根误差整体上呈浅“U”型分布, 即年初和年底较大, 年中较小, 但在6月和8月有明显波动; 最大值出现在1月, 为1.4 ℃, 最小值在7月和9月, 分别为1.06 ℃和1.04 ℃, 6月和8月分别为1.3 ℃和1.2 ℃。由各月平均误差均在0 ℃以下且全年在0 ℃和-0.2 ℃之间变化可知, 格点融合产品的平均态要比实际观测的偏高, 偏高较大的月份分别出现在1月、 6月、 7月和8月, 分别为-0.15、 -0.13、 -0.11和-0.19 ℃。
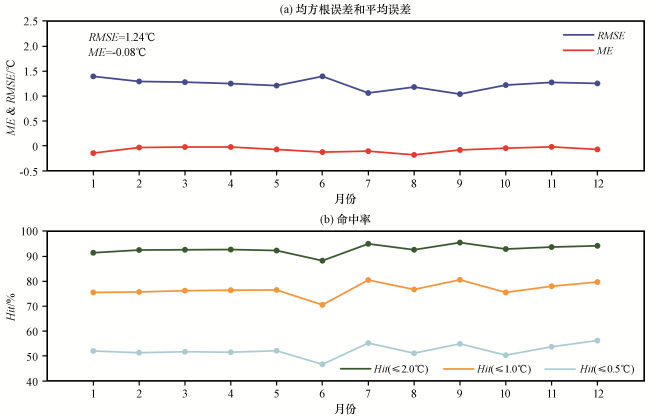
阈值为2 ℃、 1 ℃和0.5 ℃的命中率分别在88%~95%, 70%~80%和47%~55%[图1(b)], 说明格点融合产品与观测之间的差别多在±0.5 ℃至±2 ℃内。随月份变化趋势基本一致, 其中6月最低, 7月和9月最高。
4.2 误差的空间分布
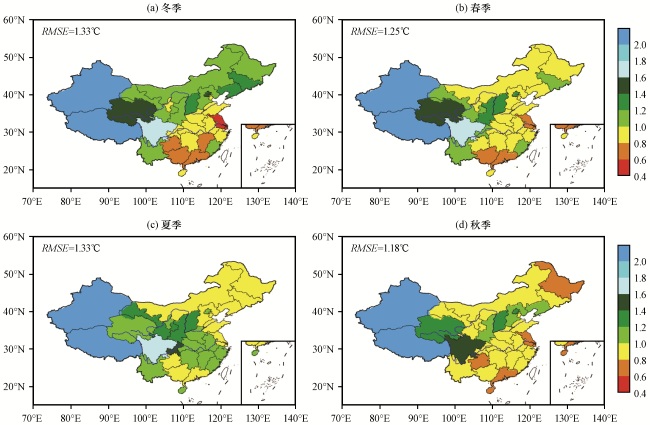
从2018年温度格点融合产品在中国各省各季节平均均方根误差分布(图2)可知, 除冬季江苏省在0.4~0.6 ℃, 其他省份各季节均在0.6 ℃以上。其中, 西藏和新疆两省各季节均在2 ℃以上; 四川省在1.4 ℃以上, 青海、 北京、 陕西和山西四地在1 ℃以上; 其他省份根据季节不同均方根误差在0.6~1.2 ℃。中西部站点观测稀疏、 当地地形高度较高和下垫面情况复杂可能是导致均方根误差在空间分布上呈中西部高于东部的主要原因之一。
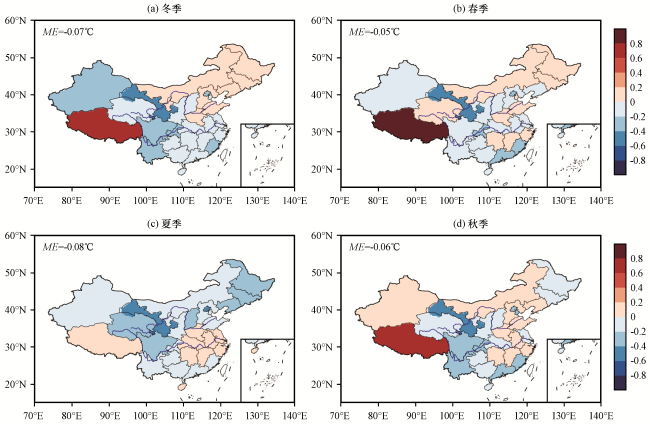
结合平均误差在各省分布(图3)可知, 格点融合产品的平均误差在西藏地区全年大于0, 即整体表现为格点分析值较实况观测值偏低的状态, 其中春季偏低程度最大, 平均偏低0.8 ℃以上。而甘肃、 北京和重庆三地则全年表现为偏高状态, 偏高程度分别在0.4, 0.3和0.2 ℃以上。其他省份在不同季节的平均误差在-0.4~0.4 ℃。
4.3 高低温天气检验
表1 高温天气时2 m温度格点融合产品检验评估Table 1 The RMSE and ME of the gridded 2 m temperature products in hot days |
| 月份 | ≥35 ℃ | ≥37 ℃ | ≥40 ℃ | |||||
|---|---|---|---|---|---|---|---|---|
| RMSE | ME | RMSE | ME | RMSE | ME | |||
| 6月 | 1.53 | -0.01 | 1.84 | -0.03 | 2.91 | 0.11 | ||
| 7月 | 0.95 | -0.07 | 1.03 | 0.05 | 1.15 | 0.09 | ||
| 8月 | 1.11 | -0.01 | 1.20 | 0.21 | 1.34 | -0.03 | ||
表2 低温天气时2 m温度格点融合产品检验评估Table 2 The RMSE and ME of the gridded 2 m temperature products in cold days |
| 月份 | ≤-20 ℃ | ≤-25 ℃ | ≤-30 ℃ | |||||
|---|---|---|---|---|---|---|---|---|
| RMSE | ME | RMSE | ME | RMSE | ME | |||
| 1月 | 2.32 | -0.41 | 2.46 | -0.58 | 2.96 | -1.04 | ||
| 2月 | 2.08 | -0.36 | 2.52 | -0.73 | 3.37 | -1.34 | ||
| 12月 | 1.96 | -0.46 | 2.81 | -1.01 | 3.47 | -1.62 | ||
由表1可知, 夏季各月站点观测分别大于35, 37和40 ℃时, 两者之间的平均误差在-0.1~0.1 ℃, 表明格点融合产品在高温天气时, 其平均态与实际相差不大。但从各月均方根误差均在1 ℃左右或以上可知, 相比于真值, 格点融合产品的分析值存在至少±1 ℃以上的差别, 这种差别会随高温温度的提高而增大。其中, 6月和8月高温天气的均方根误差明显大于7月, 这可能是导致上述两月均方根误差整体增大[见图1(a)]的主要原因之一。除高温外, 冬季各月站点观测分别出现低于-20, -25和-30 ℃的气温时(表2), 格点融合产品的平均误差均在0 ℃以下, 且均方根误差均在2 ℃左右及以上。由此可知, 低温天气下, 格点融合产品较实况观测整体偏高, 这是冬季均方根误差大于其他季节[见图1(a)]的主要原因之一。
4.4 独立检验
利用质控后的机场2 m温度观测进行独立检验(图略)。结果表明, 全年平均均方根误差和平均误差分别为1.36 ℃和-0.1 ℃。其中, 月平均均方根误差最大的月份为1月的1.53 ℃, 其次是6月和8月的1.49 ℃和1.42 ℃, 最小的两个月为7月和9月, 分别为1.05 ℃和1.19 ℃。平均误差除7月为0.01 ℃外, 其他月均在0 ℃以下, 偏差相对较大的月份分别为1月、 2月、 8月和11月, 分别为-0.25, -0.17, -0.15和-0.23 ℃。结合图1(a)可知, 两种检验结果随时间变化的趋势几乎一致, 只是独立检验体现出的产品准确性低于非独立检验的, 这与两种检验的原理是一致的。
5 地面10 m风速
5.1 误差的时间变化
地面10 m风速格点融合产品各月平均均方根误差和平均误差结果[图4(a)]显示, 全国全年平均均方根误差为1.07 m·s-1, 各月均在0.9 m·s-1以上, 其中3-5月的均方根误差最大, 均在1.1 m·s-1以上, 4月又是这三个月中最大的, 为1.19 m·s-1; 秋季是全年均方根误差最小的季节, 9-11月分别为0.98, 0.96和0.94 m·s-1。各月平均误差在0.3~0.6 m·s-1, 表明风速格点融合产品值整体小于实际观测值。
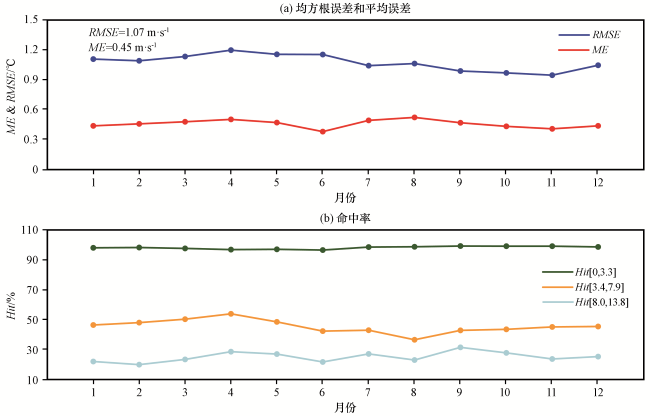
观测风速在0~2级风速时[图4(b)], 风速格点融合产品各月命中率均在90%以上, 随着观测风速增加到3~4级和5~6级, 命中率分别下降到50%和30%左右。由此可知, 10 m风速格点融合产品可以精确地描述风速较小地情况, 对于3~6级的风速描述能力偏弱, 主要表现为风速较实况偏小(图略)。
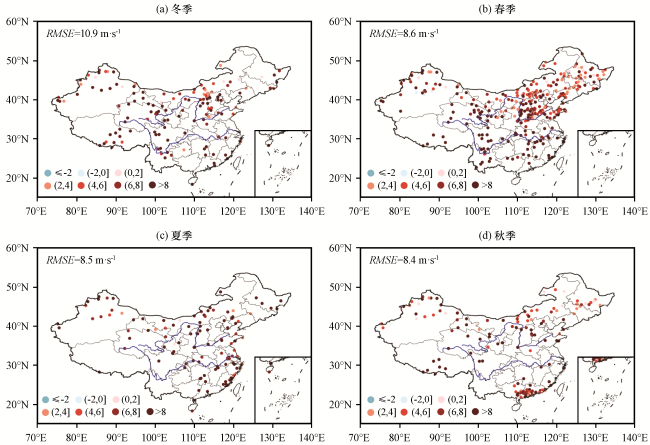
5.2 大风天气检验
挑选站点观测风速在7级(13.9 m·s-1)以上时的10 m风速格点融合产品进行检验及分季节统计, 得到平均误差在全国的空间分布(图5)。从站点分布看, 大风天气在冬季和春季更容易出现, 主要为冷锋后大风, 多分布在内陆35°N以北地区; 夏季和秋季沿海地区出现大风频次有所增加, 多与台风登陆有关。分析平均误差发现, 风速格点融合产品除在个别位置比观测值偏大外, 均低于站点观测值。冬季均方根误差和平均误差最大, 分别为10.9 m·s-1和9.3 m·s-1, 其他季节相差不大, 均方根误差随季节依次为8.6, 8.5和8.4 m·s-1, 平均误差依次为6.8, 6.5和6.4 m·s-1。说明格点融合产品对7级以上大风天气的描述比实际观测平均偏弱6 m·s-1以上。
5.3 独立检验
利用质控后的机场10 m风速观测进行独立检验(图略)。结果表明, 全年平均均方根误差和平均误差分别为2.13 m·s-1和1.65 m·s-1。其中, 月平均均方根误差在11月最小, 为1.87 m·s-1, 其他月在2.07~2.26 m·s-1, 各月平均误差在1.4~1.89 m·s-1之间变化。对比图4可知, 独立检验结果更加明显地反映出10 m风速融合产品结果偏小的结论。
6 降水
6.1 误差的时间变化
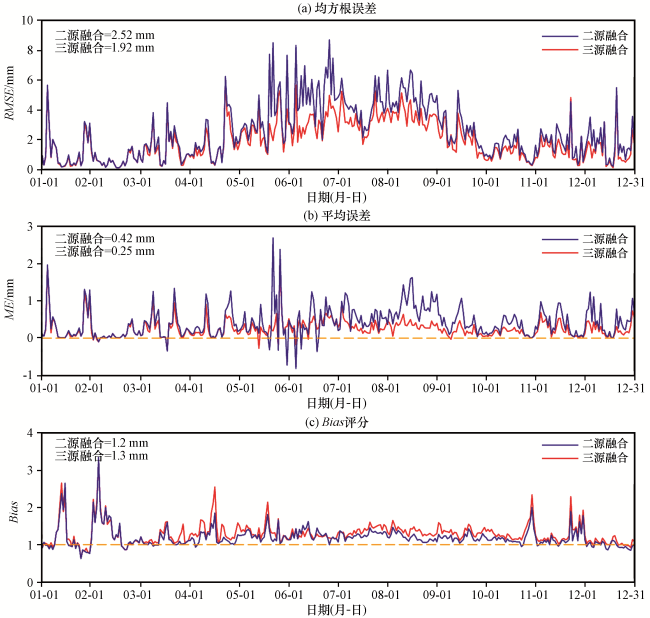
由二源融合和三源融合24 h累积降水格点融合产品均方根误差、 平均误差和Bias评分时间序列图(图6)可知, 无论是全年平均还是逐日结果, 三源融合产品的准确性均好于二源融合, 这种优势在4 -9月中国雨季期间尤为明显; 但两种降水产品在4 -9月的均方根误差也要大于其他月份, 6 -8月偏大最为明显。逐日平均误差在-1~3 mm之间变化, 但大部分时次均大于0 mm, 即两种降水格点产品的整体降水量均小于实际观测值。从Bias评分可知, 除个别时次小于1外, 两种降水格点产品的评分均大于1, 且三源融合的Bias评分几乎均大于二源融合的, 说明两种格点融合产品中的降水面积均大于实际观测的, 且三源融合产品的更大。
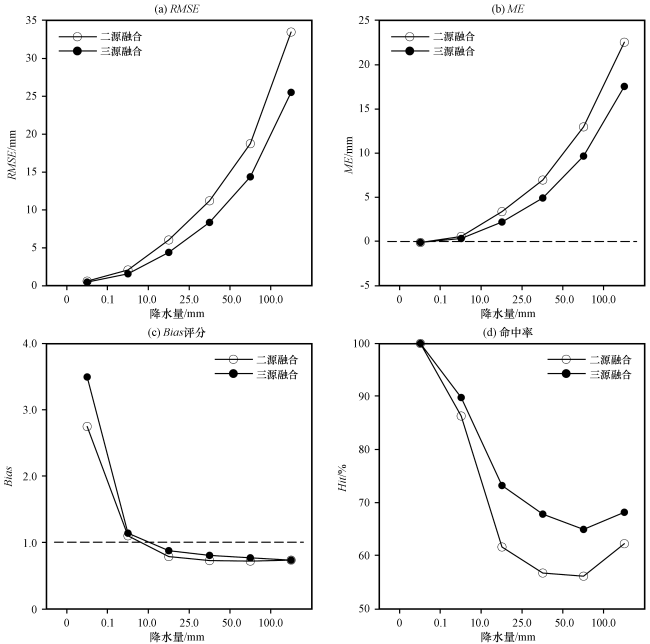
6.2 不同降水量级的误差
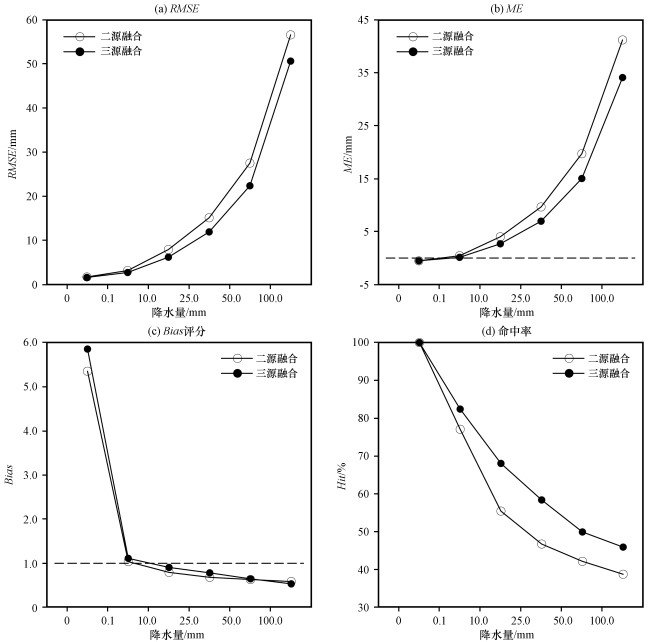
6.3 独立检验
利用水利部站点降水观测进行独立检验(图8), 结果表明, 各类检验指标随降水阈值的变化趋势与非独立检验基本一致, 三源融合降水准确性优于二源融合。不同的是, 独立检验的均方根误差和平均误差在各阈值区间内均比非独立检验的结果更大。三源融合降水在大于25 mm以上的三个降水区间内均方根误差分别为11.9, 22.4和50.6 mm, 平均偏差分别为6.9, 15.0和34.0 mm; 在独立检验的Bias评分中, 0~0.1 mm降水的评分也比非独立检验的高2~3, 进一步证明多源降水融合产品在这一区间内存在较多的虚假降水; 独立检验的命中率在各阈值区间内也有不同程度的下降。上述独立检验中与均方根误差和平均误差有关的结论与该产品制作单位对其2016年夏季降水期间多源降水观测产品进行独立检验时得到的基本一致(潘旸等, 2018b)。
7 结论
本文对2018年5 km分辨率中国地面气象要素2 m温度、 10 m风速和24 h累积降水格点融合产品集进行2380个国家级气象自动站的非独立检验和机场、 水利部观测的独立检验。结果如下:
(1) 2 m温度格点融合产品非独立检验结果表明, 格点融合产品比实况观测整体偏暖, 各月均方根误差均在1 ℃左右, 其中冬季和夏季均方根误差大于其他月份。针对35 ℃以上高温天气, 该产品存在1 ℃以上的均方根误差; 对-20 ℃以下低温天气, 存在2 ℃以上的均方根误差, 对低温天气呈现整体偏暖的状态。
(2) 10 m风速格点融合产品非独立检验结果表明, 该格点产品对0~2级风的描述与实际基本一致, 但随着风速的增加, 误差逐渐增大。对于3级以上风速的描述主要表现为较观测值偏小。
(3) 二源融合和三源融合降水格点产品非独立检验结果表明, 两种产品在描述降水事件时均存在0~0.1 mm降水空报偏多, 大于0.1 mm的降水偏弱, 随降水量级的增加偏弱程度增大的情况。但三源融合产品的准确性优于二源融合产品的。因此, 在业务工作中, 在不要求时效性的前提下, 使用三源融合产品是更好的选择。
(4) 分析各要素独立检验结果所得的结论与从非独立检验中得到的一致。在相同检验条件下, 前者显示的准确性均比后者呈现不同幅度的降低, 符合两类检验的原理; 另外, 降水产品的独立检验结果与国家气象信息中心对自身产品进行独立检验得到的结果基本一致, 侧面印证了文中两类检验结果的正确性。
总体而言, 国家气象信息中心制作的5 km分辨率地面观测格点融合产品对一般天气描述较好, 但对高低温、 大风或强降水等灾害性天气的描述能力有待提高, 复杂地形和下垫面影响及空间分辨率不足可能是导致复杂天气下产品准确性不高的主要原因。