1 引言
2 数据来源与方法介绍
2.1 资料来源
2.2 SEA统计方法
3 结果分析
3.1 测站区域夜闪电及Na层分布
3.2 钠原子密度时空变化特征
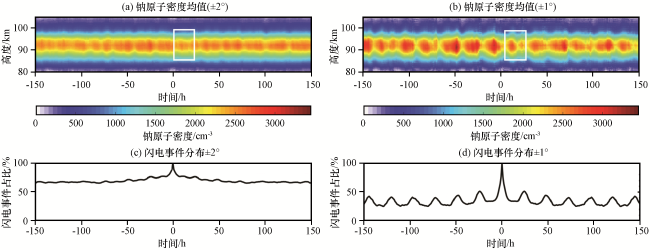
图4 测站周围±2°和±1°上空的Na原子在闪电前后150 h内密度均值的SEA统计结果(a, b)以及相应的闪电事件时序分布(c, d)白色矩形框为钠原子密度减小的区域 Fig.4 Mean response of Na density from superposed epoch analyses 150 h before and after lightning overhead the station (a, b) and the distributions of total number of lightning events in each time bin of the composite analysis (c, d) within ±2° and ±1°, respectively.The white rectangles label the decreasing area of Na atoms density |
3.3 雷暴活动分布与中性金属Na原子的密度均值特征
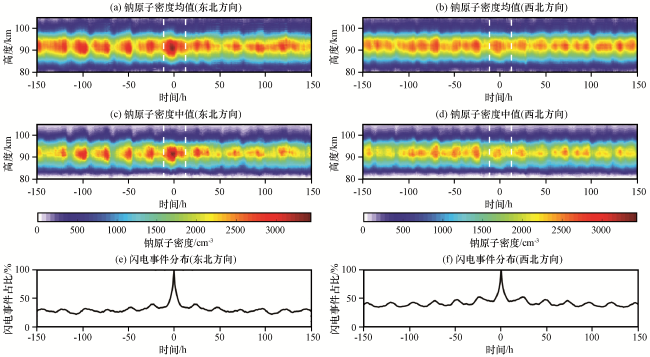
图5 测站东北和西北两个区域上空Na原子在闪电前后150 h内的密度均值(a, b)和中值(c, d)分布的时序叠加统计结果以及相应的闪电事件的分布(e, f)白色虚线内为Na原子增强区间(-12~ 12 h) Fig.5 Mean response (a, b) and median response (c, d) of Na density from superposed epoch analyses 150 h before and after lightning overhead the northeast and northwest regions of the station, and the distributions of total number of lightning events in each time bin of the composite analysis (e, f).The white dotted lines label the enhancement of Na atom ranging from -12 to 12 hours |
3.4 东北部雷暴活动触发下钠原子密度随高度的变化特征
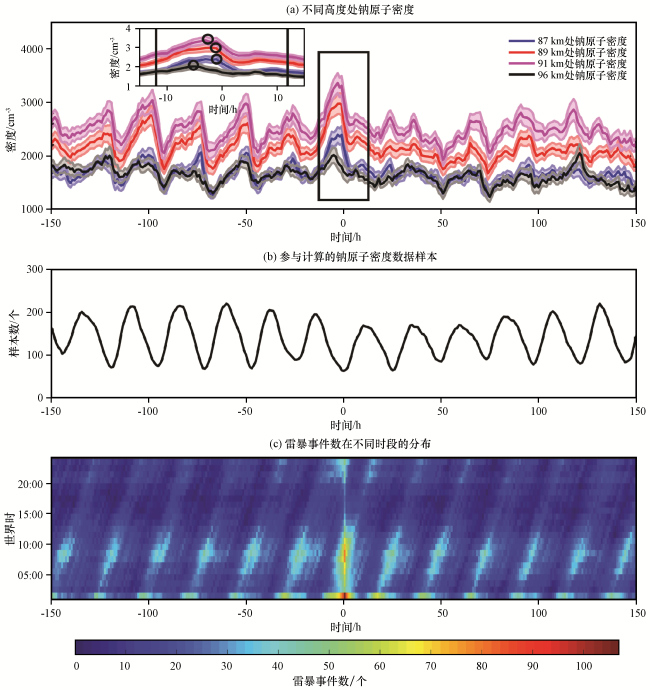
图6 测站东北方上空85~96 km处Na原子密度在闪电前后150 h内的演变情况以及相应的总Na原子数和闪电事件的分布黑色圆圈标记了Na原子密度峰值位置 Fig.6 Response of Na density from superposed epoch analyses 150 h before and after lightning ranging from 85 km to 96 km overhead the northeast region of the station (a), and the distributions of total number of Na data points (b) and lightning events (c) in each time bin of the composite analysis.The black rectangle is enlarged area.The black circles label the peak of Na atom density |