1 引言
2 暴雨概况
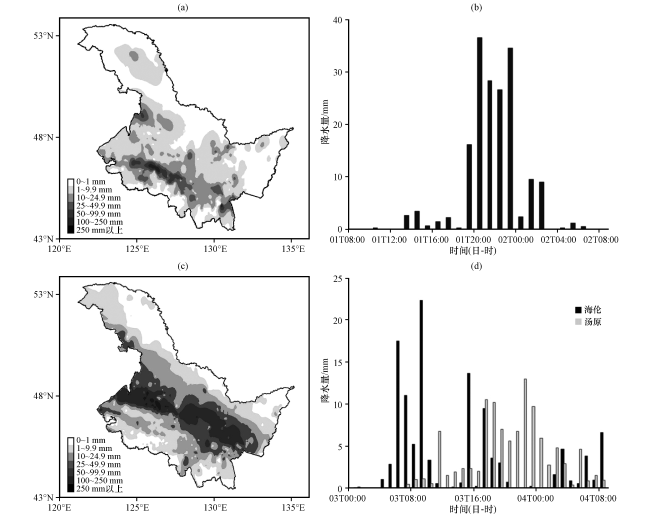
图1 2017年8月1日08:00至2日08:00和2018年8月2日20:00至4日08:00黑龙江降水量分布(a, c), 绥化市北安站(b)及海伦站和汤原站(d)逐小时雨量变化Fig.1 The observed precipitation in Heilongjiang province (a, c) and hourly precipitation at rainstorm central stations (b, d)from 08:00 on 1 to 08:00 on 2 August 2017 (a, b) and from 20:00 on 2 to 08:00 on 4 August 2018(c, d) |
3 环流形势演变特征
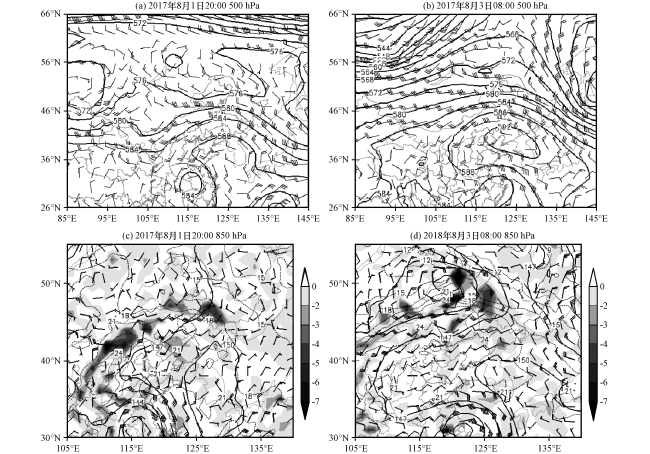
图2 2017年8月1日和2018年8月3日高空形势场实线为高度场(单位: dagpm); 风羽为风场(单位: m·s-1); 虚线为温度场(单位: ℃); 阴影为水汽通量散度(单位: ×10-7 g·s-1·cm-2·hPa-1) Fig.2 The geopotential height (solid lines, unit: dagpm), wind field (barb, unit: m·s-1), temperature field (dotted lines, unit: ℃) and the vapor flux divergence(the shaded, unit: ×10-7 g·s-1·cm-2·hPa-1) on 1 August 2017 and on 3 August 2018 |
4 水汽条件
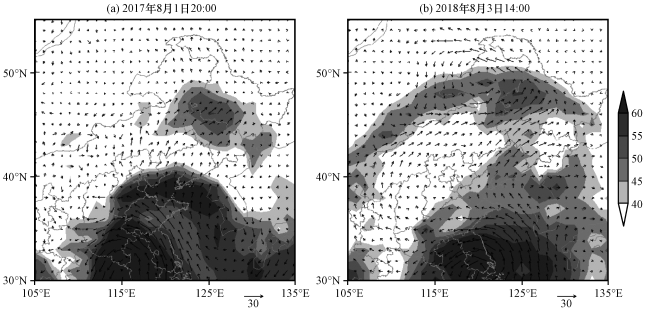
图3 2017年8月1日20:00和2018年8月3日14:00两次暴雨过程的大气可降水量(阴影, 单位: mm)和850 hPa水汽通量(矢量, 单位: g·s-1·cm-1·hPa-1)Fig.3 The precipitable water (the shaded, unit: mm) and 850 hPa vapor flux (vector, unit: g·s-1·cm-1·hPa-1) of two rainstorm processes at 20:00 on 1 August 2017 and at 14:00 on 3 August 2018 |
5 高低空急流的动力作用
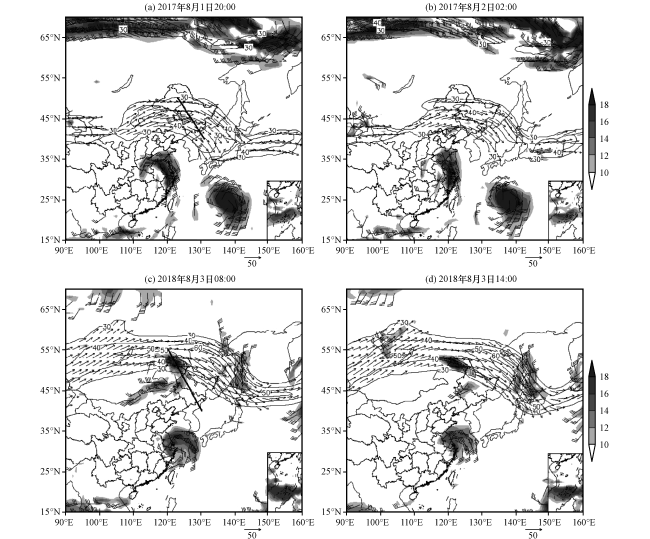
图4 2017年8月1日20:00至2日02:00和2018年8月3日08:00 -14:00高低空急流演变风矢量和风羽分别为200 hPa和850 hPa风场, 等值线和阴影风别为200 hPa和850 hPa风速(单位: m·s-1) Fig.4 The evolution of upper lever jet and low lever jet from 20:00 on 1 to 02:00 on 2 August 2017, and from 08:00 to 14:00 on 3 August 2018.The wind vector and the wind barb denote wind field at 200 hPa and 850 hPa, the contour and shaded denote wind speed at 200 hPa and 850 hPa (unit: m·s-1) |
6 暴雨形成的热力动力诊断
6.1 大气热力及不稳定特征
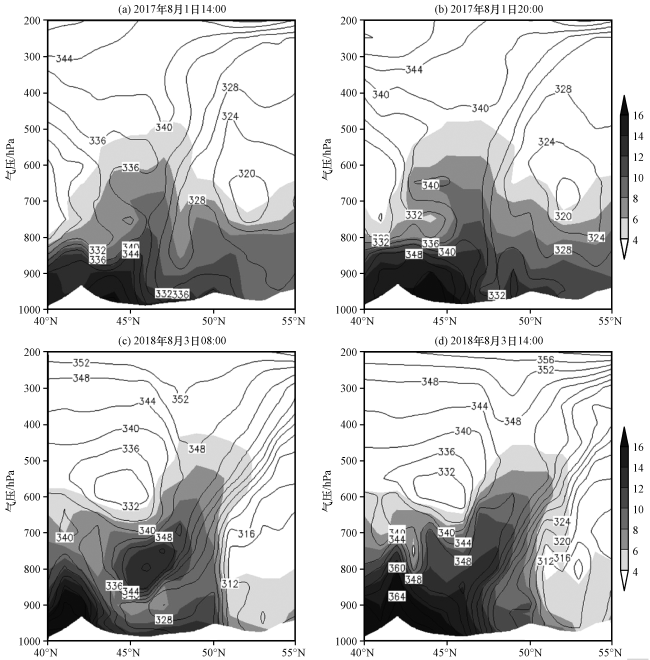
图7 2017年8月1日14:00 -20:00和2018年8月3日08:00 -14:00假相当位温(实线; 单位: K)和比湿(阴影, 单位: g·kg-1) 沿126°E垂直剖面下方白色区为地形 Fig.7 The vertical cross-sections along 126°E of the specific humidity (the shade, unit: g·kg-1) and the pseudo-equivalent potential temperature (solid lines, unit: K) from 14:00 to 20:00 on 1 August 2017 and from 08:00 to 14:00 on 3 August 2018.The below white area denote terrain |
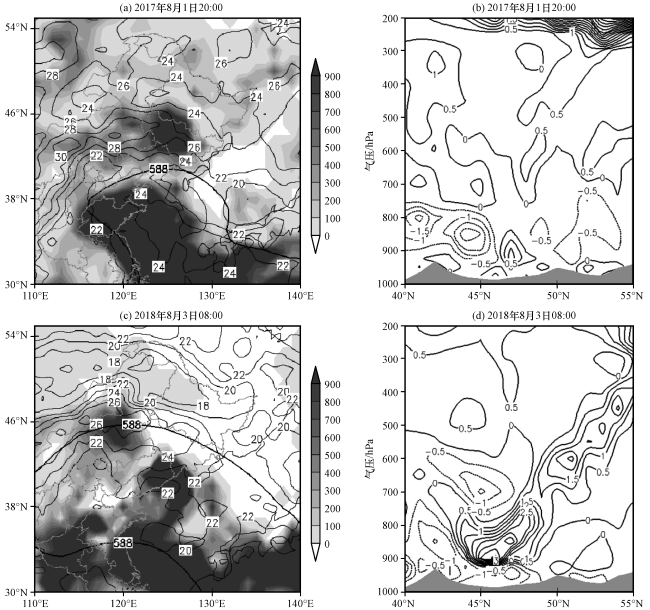
图8 2017年8月1日20:00和2018年8月3日08:00 CAPE(阴影, 单位: J·kg-1)和 (实线, 单位: K)(a, c, 粗实线为588 dagpm线), 湿位涡沿126°E经向剖面(等值线, 单位: PVU= 10-6 m2·K·s-1·kg-1)(b, d)Fig.8 The distribution of convective available potential energy cape (the shaded, unit: J·kg-1) and (solid lines, unit: K) (a, c, the heavy line is 588 dagpm), the vertical cross-section of MPV along 126°E (contour, unit: 10-6 m2·K·s-1·kg-1) at 20:00 on 1 August 2017 and at 08:00 on 3 August 2018 |
6.2 锋生动力学
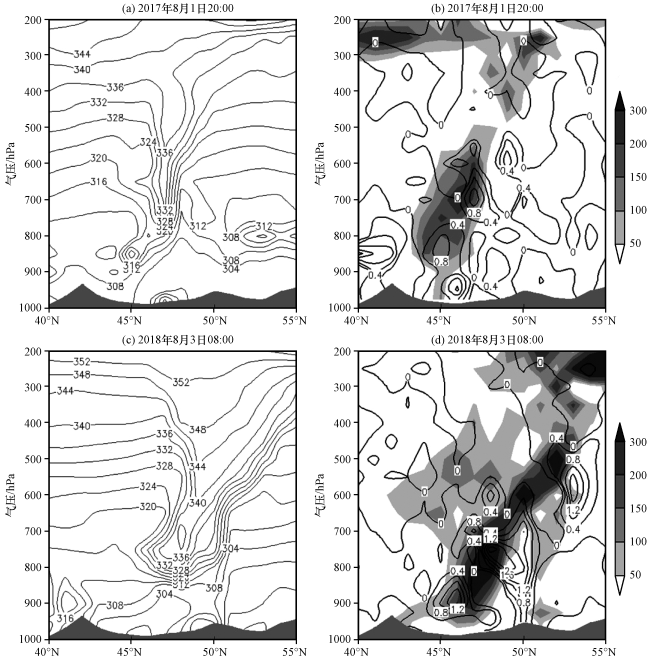
图9 2017年8月1日20:00和2018年8月3日08:00广义位温(单位: K)(a, c), 锋生函数 [阴影, 单位: K·h-1·(100 km)-1]和温度平流(等值线, 单位: ×10-6 K·s-1)(b, d)沿126°E经向剖面下方阴影区为地形 Fig.9 The vertical cross-section along 126°E of generalized potential temperature (unit: K) (a, c), frontogenesisfunction (the shaded, unit: K·h-1·(100 km)-1) and temperature advection(contoured, unit: ×10-6 K·s-1)at 20:00 on 1 August 2017 and at 08:00 on 3 August 2018.The below shaded area denote serrain |
6.3 动力因子诊断分析
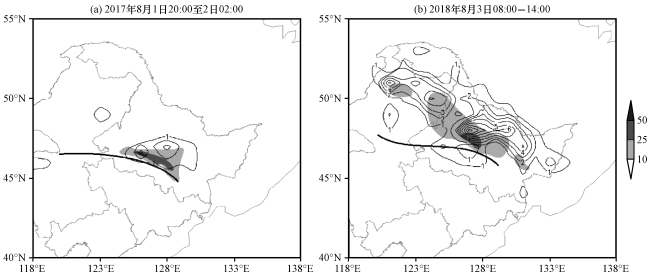
图10 2017年8月1日20:00至2日02:00和2018年8月3日08:00 -14:00 6 h平均的水汽散度通量正值区(等值线, 单位: ×10-3 m3·Pa2·kg-1·s-2)和6 h 累积降水量(阴影, 单位: mm)黑实线为地面暖锋 Fig.10 The positive region of 6 hours average moisture divergence flux (contour line, unit: ×10-3 m3·Pa2·kg-1·s-2)and the 6 hours accumulated precipitation (shaded, unit: mm) from 20:00 on 1 to 02:00 on 2 August 2017 and from 08:00 to 14:00 on 3 August 2018.The black solid line is the warm front of the ground |
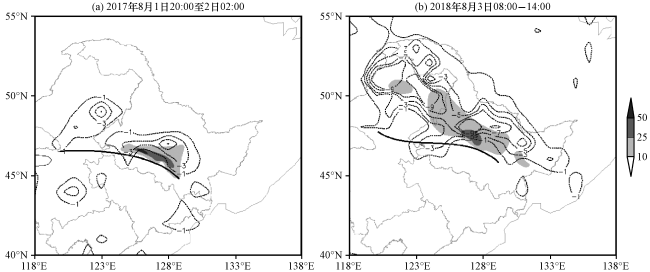
图11 2017年8月1日20:00至2日02:00和2018年8月3日08:00 -14:00 6 h平均的水汽螺旋负值区(等值线, 单位: ×10 m3·Pa2·kg-1·s-2)和6 h 累积降水量(阴影, 单位: mm)黑实线为地面暖锋 Fig.11 The negative region of 6 hours average moisture vertical helicity (contour, unit: ×10 m3·Pa2·kg-1·s-2)and the 6 hours accumulated precipitation (the shaded, unit: mm) from 20:00 on 1 to 02:00 on 2 August 2017 and from 08:00 to 14:00 on 3 August 2018.The black solid line is the warm front of the ground |