1 引言
2 数据来源与方法介绍
2.1 数据来源
2.2 研究方法
2.2.1 最大值合成法
2.2.2 趋势分析法
2.2.3 相关性分析
3 NDVI的时空分布格局
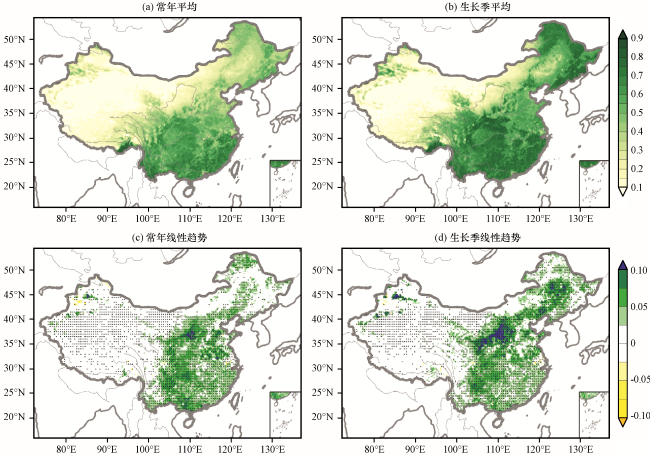
图1 2000 -2016年中国区域NDVI平均态(a, b)及长期趋势[c, d, 单位: ×(10a)-1]图(c)、 (d)中阴影部分表示该区域通过了95%的显著性检验 Fig.1 The climate mean (a, b) and long-term trend [c, d, unit: ×(10a)-1] of NDVI in China from 2000 to 2016.In Fig.1(c) and (d), the shaded areas indicate that the statistically trend passed significant level at the 95% |
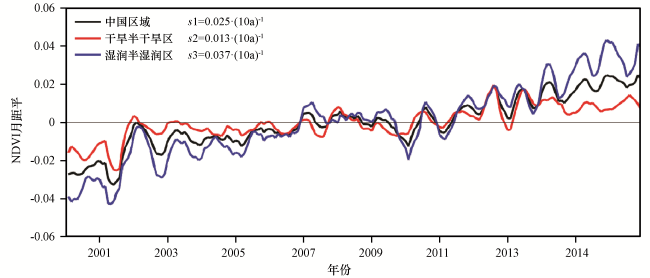
图2 2000 -2016年中国区域和两个分区植被NDVI月距平5点平滑时间序列s1、 s2和s3分别是三个区域NDVI随时间变化的线性趋势, 且均通过了95%的显著性检验 Fig.2 The time series of 5-point-moving-averaged monthly NDVI anomalies over China as a whole and two subregions from 2000 to 2016.s1, s2 and s3 represent the linear trend of NDVI with time over these three regions, respectively, and all of them are statistically significant at the 5% level |
4 NDVI与气候驱动因素之间的关系
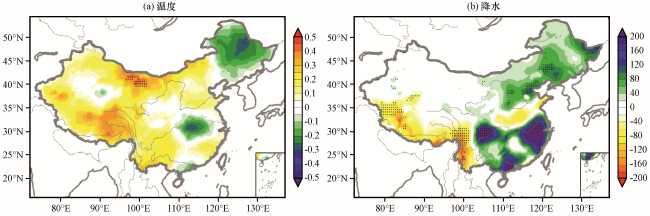
图3 2000 -2016年中国区域平均气温[a, 单位: ℃·(10a)-1]和年总降水量[b, 单位: mm·(10a)-1]线性趋势阴影部分表示该区域通过了95%的显著性检验 Fig.3 The linear trend of temperature [a, unit: ℃·(10a)-1] and annual precipitation [b, unit: mm·(10a)-1] in China from 2000 to 2016.The shaded areas indicate that the statistically trend have passed the significant level at 95% |
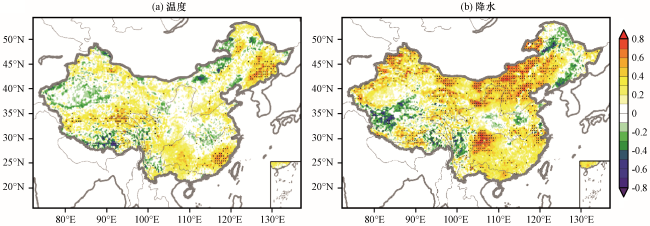
图4 2000 -2016年中国区域NDVI与年平均温度(a)及年总降水量(b)相关系数分布阴影部分表示该区域通过了95%的显著性检验 Fig.4 Spatial distribution of the correlation coefficients of the annual anomalies between NDVI and temperature (a), and between NDVI and precipitation (b) from 2000 to 2016.The shaded areas indicate that the correlation coefficients have passed the significant level at 95% |
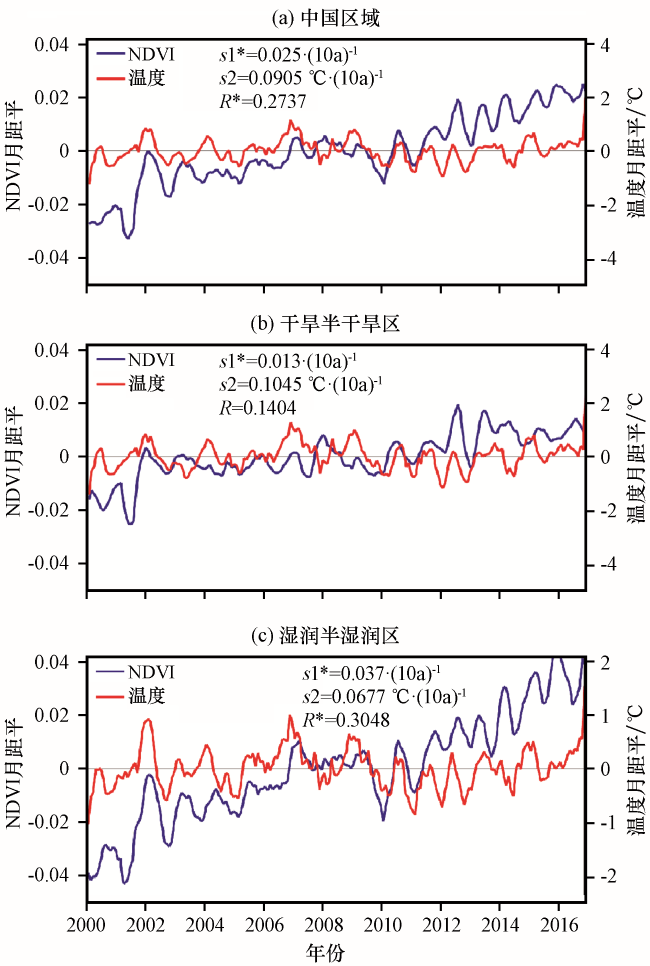
图5 2000 -2016年中国区域和两个分区NDVI与气温月距平5点平滑时间序列s1和s2分别表示NDVI和气温随时间变化的线性趋势; R是NDVI和温度时间序列的相关系数; *代表通过了95%的显著性检验 Fig.5 Time series of 5-point-moving-averaged monthly NDVI and temperature anomalies for China as a whole and two subregions from 2000 to 2016.s1 and s2 represent the linear trend of NDVI and air temperature, respectively.R is the correlation coefficient between NDVI and temperature time series.Number with asterisk is statistically significant at the 95% level |
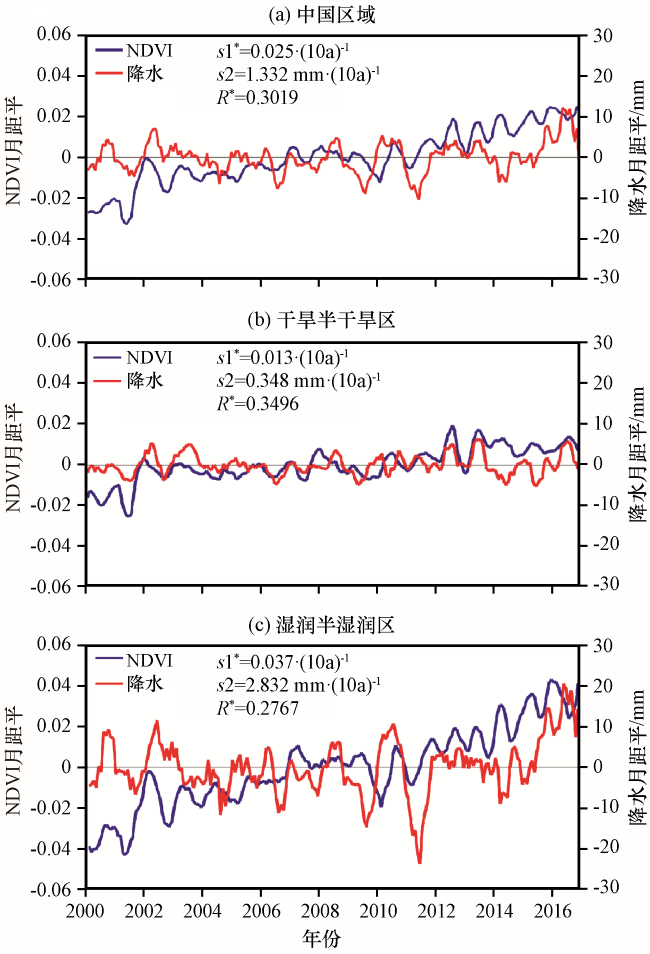
图6 2000 -2016年中国区域和两个分区NDVI和降水月距平5点平滑时间序列s1和s2分别表示NDVI和降水随时间变化的线性趋势; R是NDVI和降水时间序列的相关系数; *代表通过了95%的显著性检验 Fig.6 Time series of 5-point-moving-averaged monthly NDVI and precipitation anomalies for China as a whole and two subregions from 2000 to 2016.s1 and s2 represent the linear trend of NDVI and precipitation, respectively.R is the correlation coefficient between NDVI and precipitation time series.Number with asterisk is statistically significant at the 95% level |
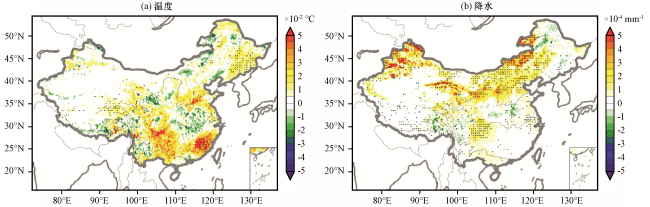
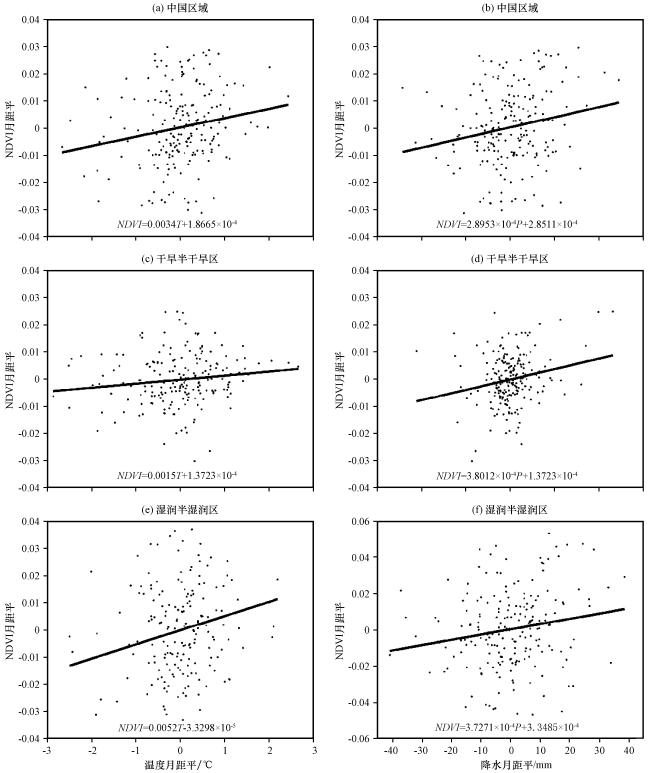
图7 2000 -2016年中国区域植被NDVI与年平均温度(a×10-2 ℃-1)及年总降水量(b×10-2 ℃-1)的线性回归分布阴影部分表示该区域通过了95%的显著性检验 Fig.7 Linear regression distribution of annual anomalies between NDVI and temperature (a×10-2 ℃-1), and between NDVI and precipitation (b×10-2 ℃-1) from 2000 to 2016.The stippled areas represent statistically regression coefficient have passed the significant level at the 5% |