
1 引言
2 资料来源与方法介绍
2.1 资料来源
2.2 环流指数
2.3 其他方法
3 降雪与温度变化
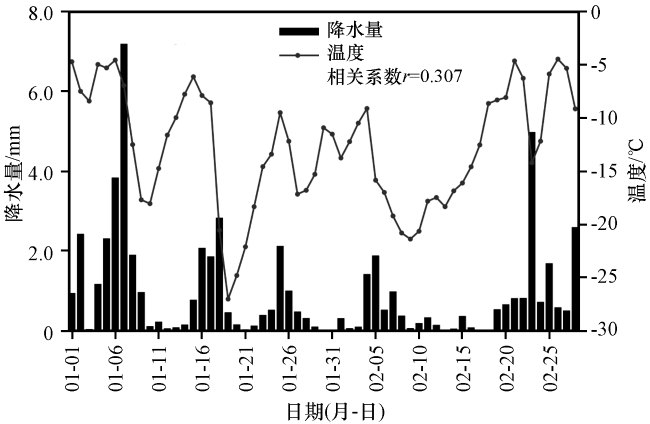
图3 2010年1 -2月新疆北部气温(单位: ℃)及平均降雪量(单位: mm)的逐日变化温度与降雪量相关系数r通过了95%显著性水平检验 Fig.3 Daily evolutions of temperature and daily total snowfall in northern Xinjiang from January to February in 2010.The correlation coefficient between the temperature and snowfall has passed the significant test of 95% |
4 蒙古高压作用
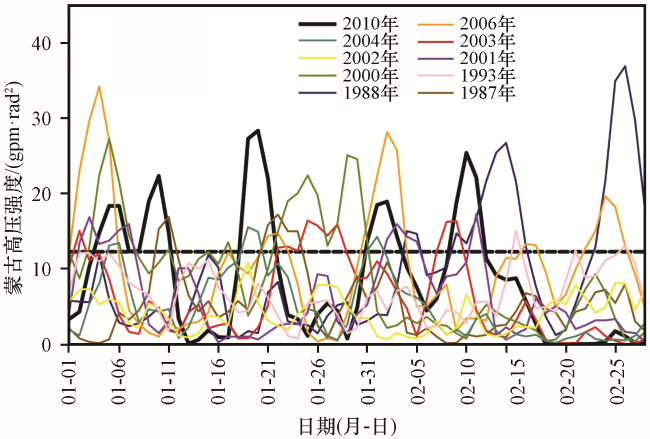
图4 2010年1 -2月新疆北部降雪异常偏多年蒙古高压强度P逐日变化曲线黑色虚线为2010年蒙古高压平均强度P 2010=12.26 gpm·rad2 Fig.4 Evolution of the Mongolian high intensity for the ten extremely large precipitation winters in northern Xinjiang from January to February in 2010.The black dotted line marks the 2010 winter-mean Mongolian high intensity (P 2010=12.26 gpm·rad2) |
表1 2010年1 -2月蒙古高压指数(中心纬度 ϕ、 高压强度 P和高压面积 S)与滞后/超前温度的相关系数Table 1 Lead and lag correlation coefficients between Mongolian high index (latitude of Mongolian high center ϕ, Mongolian high strength P and Mongolian high area S) and northern Xinjiang lag/pre-temperature from January to February in 2010 |
| 指标 | 滞后、超前温度的天数/d | ||||||||||
|---|---|---|---|---|---|---|---|---|---|---|---|
| -5 | -4 | -3 | -2 | -1 | 0 | 1 | 2 | 3 | 4 | 5 | |
| rϕt | 0.144 | 0.208 | 0.296 | 0.382* | 0.424* | 0.396* | 0.266 | 0.190 | 0.198 | 0.155 | 0.167 |
| rpt | 0.278 | 0.192 | -0.01 | -0.282 | -0.525* | -0.618* | -0.551* | -0.425* | -0.308 | -0.194 | -0.098 |
| rst | 0.233 | 0.139 | -0.051 | -0.275 | -0.456* | -0.559* | -0.560* | -0.474* | -0.342* | -0.207 | -0.098 |
首行负/正值代表环流指数滞后/超前温度的天数; * 表示通过99%的显著性水平检验 |
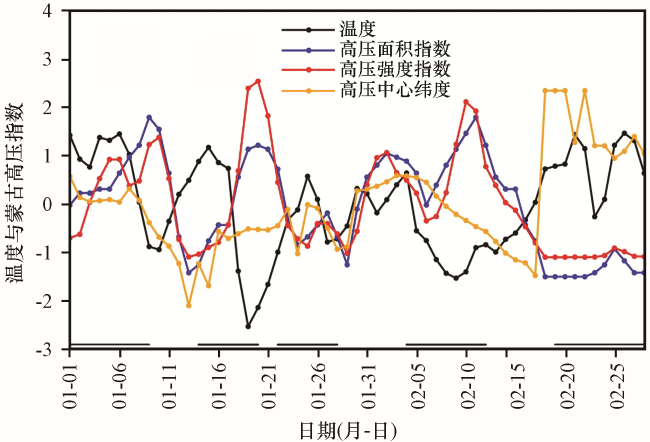
图5 2010年1 -2月新疆北部温度与蒙古高压指数(中心纬度ϕ、 高压强度P和高压面积S)的演变所有参数已标准化, 单位为1; 横轴黑色加粗线段为5次持续性降雪过程 Fig.5 Evolutions of the Mongolia high latitude, intensity, and coverage area in northern Xinjiang from January to February in 2010.All parameters of the Mongolia high are standardized.The black lines along the x-axis represent 5 continuous snowfall processes |
5 极涡的作用
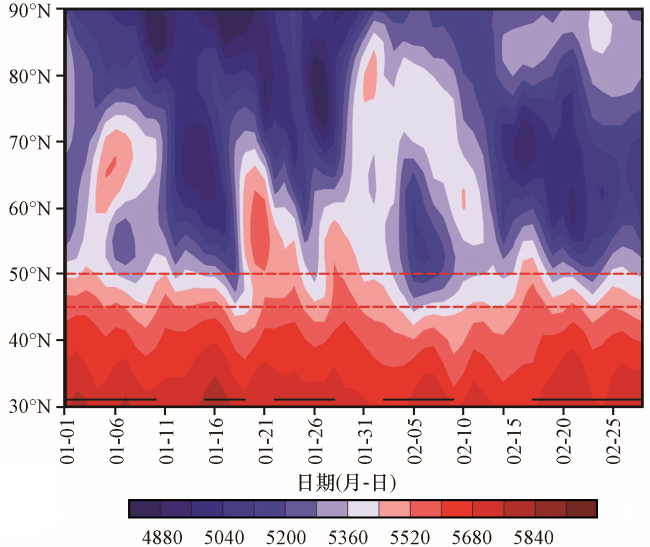
图7 2010年1 -2月新疆北部500 hPa位势高度场在80°E -92°E经度带内纬向平均的纬度-时间剖面(单位: gpm)红色虚线范围为新疆北部所在纬度带(43°N -50°N); 黑色实线标记了5次降雪天气过程 Fig.7 Latitude-time evolution of the geopotential height average over the 80°E -90°E longitude band in northern Xinjiang from January to February in 2010.Unit: gpm.The red dotted lines denotes the latitude band of northern Xinjiang (43°N - 50°N).The black line along the x-axis denotes the 5 continuous snowfall processes |
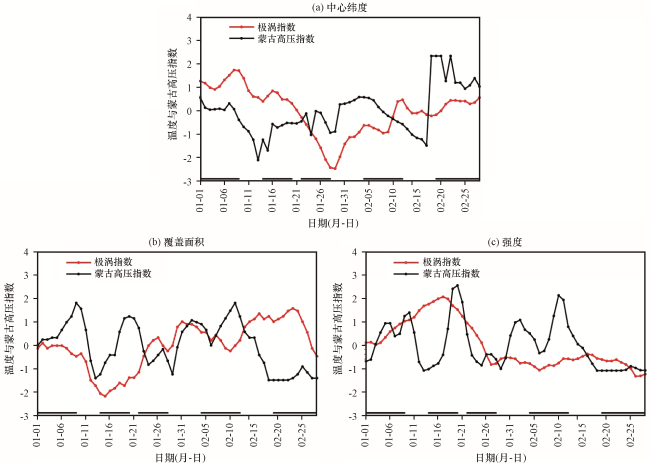
图8 2010年1 -2月新疆北部100 hPa极涡与地面蒙古高压相关参数的时间演变横轴黑色加粗线段标记了5次持续性降雪过程 Fig.8 Evolutions of the three parameters of the 100 hPa polar vortex and the surface Mongolia high in northern Xinjiang from January to February in 2010.The black lines along the x-axis denotes the 5 continuous snowfall processes |
表2 2010年1 -2月100 hPa极涡参数(包括中心纬度 ϕ、 面积 s和强度 p)超前地面蒙古高压参数(包括中心纬度 ϕ、 面积 S和强度 P )的超前滞后交叉相关统计表Table 2 Lead and lag cross correlation coefficients between the 100 hPa polar vortex parameters (including central latitude, coverage area, and intensity) and the surface Mongolian high parameters (including central latitude, coverage area, and intensity) from January to February in 2010 |
| 指标 | 滞后、超前温度的天数/d | ||||||||||
|---|---|---|---|---|---|---|---|---|---|---|---|
| -5 | -4 | -3 | -2 | -1 | 0 | 1 | 2 | 3 | 4 | 5 | |
| rϕϕ | 0.154 | 0.130 | 0.112 | 0.091 | 0.066 | 0.014 | -0.075 | -0.157 | -0.237 | -0.304 | -0.336* |
| rϕS | -0.068 | -0.028 | 0.023 | 0.078 | 0.125 | 0.132 | -0.102 | 0.018 | -0.081 | -0.178 | -0.253 |
| rϕP | -0.134 | -0.051 | 0.031 | 0.102 | 0.14 | 0.133 | 0.112 | 0.062 | -0.007 | -0.086 | -0.165 |
| rsϕ | 0.264 | 0.375* | 0.441* | 0.494* | 0.529* | 0.566* | 0.597* | 0.624* | 0.629* | 0.631* | 0.616* |
| rsS | -1.102 | -0.108 | -0.130 | -0.156 | -0.171 | -0.179 | -0.225 | -0.281 | -0.325 | -0.337* | -0.317 |
| rsP | -0.025 | -0.056 | -0.117 | -0.18 | -0.222 | -0.242 | -0.28 | -0.326 | -0.367* | -0.399* | -0.388* |
| rpϕ | -0.449* | -0.489* | -0.514* | -0.532* | -0.543* | -0.532* | -0.507* | -0.479* | -0.462* | -0.453* | -0.436* |
| rpS | 0.166 | 0.169 | 0.163 | 0.16 | 0.162 | 0.173 | 0.161 | 0.131 | 0.083 | 0.032 | -0.008 |
| rpP | 0.119 | 0.153 | 0.18 | 0.198 | 0.21 | 0.224 | 0.226 | 0.216 | 0.18 | 0.13 | 0.085 |
首行负/正值代表环流指数滞后/超前温度的天数; * 表示相关系数通过了99%的显著性水平检验 |
6 水汽条件
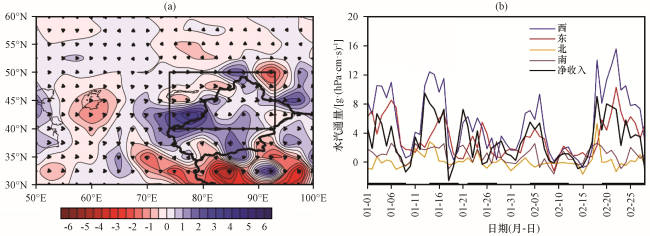
图9 2010年1月1 -9日700 hPa等压面平均水汽通量[矢量, 单位: g·(hPa·cm·s)-1]、 水汽通量散度[彩色区, 单位: g·(hPa·cm2·s)-1](a)及1 -2月新疆北部水汽净收入和4个边界(74°E -93°E, 40°N -50°N)水汽输送曲线(b)图(b)中横轴黑色线段为5次持续性降雪过程 Fig.9 The multi-day mean water vapor flux [vector, unit: g·(hPa·cm·s)-1] and water vapor flux divergence [color area, unit: g·(hPa·cm2·s)-1] at 700 hPa from 1 to 9 January 2010 (a) and the evolution of water vapor flux in the four directions of north Xinjiang (74°E -93°E, 40°N -50°N) in the marked area from January to February (b).In Fig.9(b), the black line along the x-axis marks the 5 continuous snowfall processes |