

1 引言
2 资料来源与方法介绍
2.1 资料来源
2.2 绕流和爬流的计算方法
2.3 对流有效位能
3 天气概览
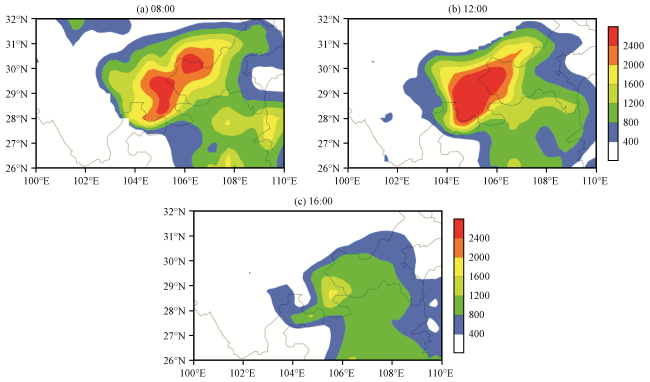
3.1 暴雨实况
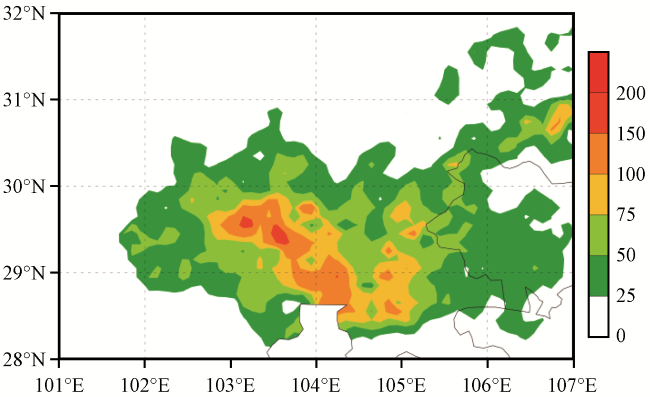
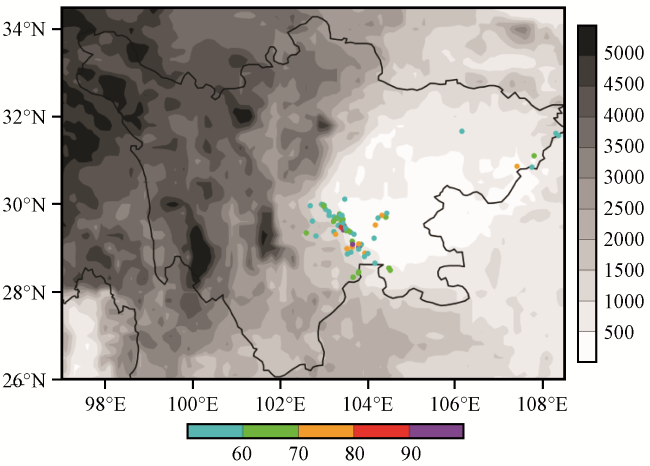
3.2 环流形势
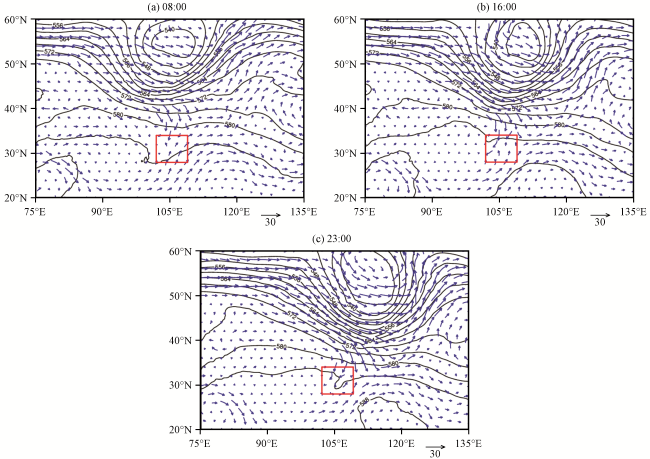
3.3 不稳定层结
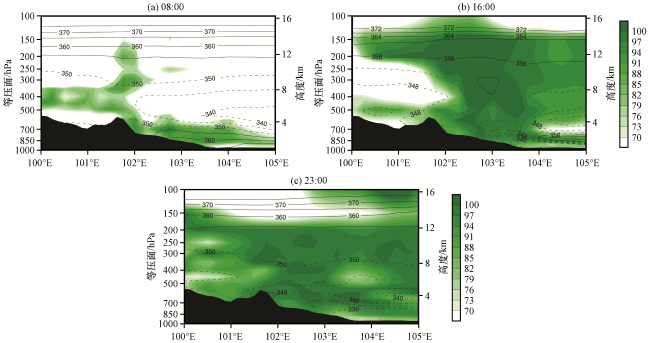
3.4 次级环流圈
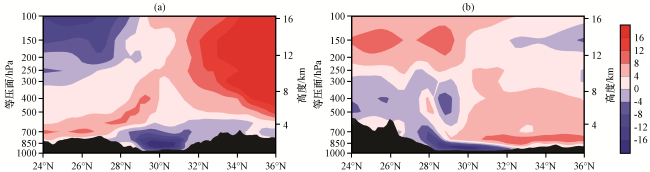
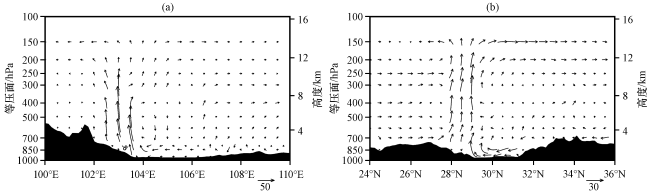
图7 2018年5月21日 16:00沿29.5°N纬向风速与垂直速度合成矢量(a)和沿104°E经向风速与垂直速度合成矢量(b)的垂直剖面图(单位: m∙s-1)黑色阴影为地形(单位: m) Fig.7 Vertical cross-section of the vectors of u and w along 29.5°N (a) and the vectors of v and w along 104°E (b) at 16:00 on 21 May 2018.Unit: m∙s-1.The black shadow is the terrain (unit: m) |
4 地形产生的绕流和爬流运动
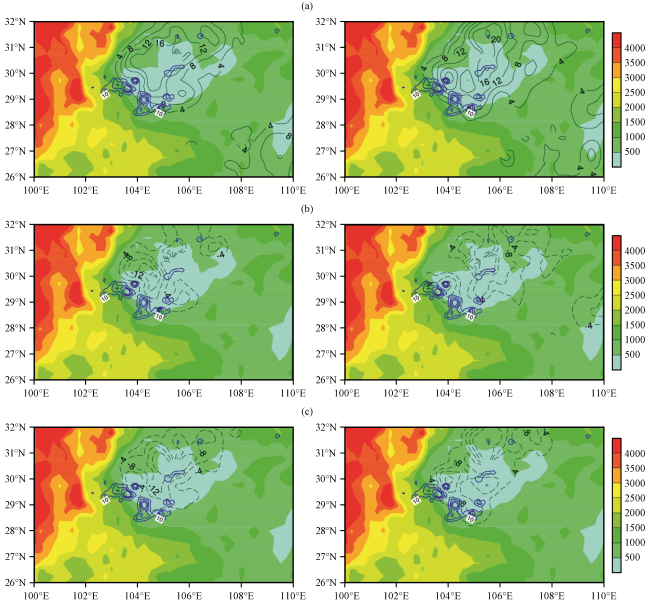
图8 2018年5月21日16:00绕流(左)和爬流(右)的矢量模(a)、 纬向分量(b)和经向分量(c)(等值线, 单位: m∙s-1)蓝色等值线为降水量(单位: mm), 彩色区为地形高度(单位: m) Fig.8 The distribution of vector mode (a), zonal (b) and meridional components (c) of flow around (left) and flow over (right) at 16:00 on 21 May 2018 (contour, unit: m∙s-1).The blue contour is precipitation (unit: mm), color area is the terrain height (unit: m) |
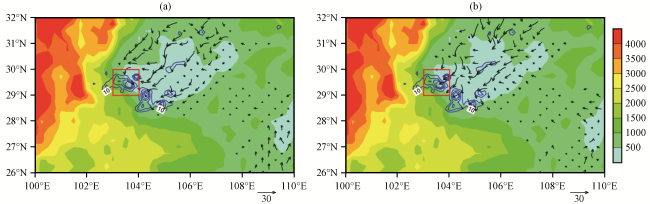
图9 2018年5月21日 16:00绕流(a)和爬流(b)的流场(矢量, 单位: m∙s-1)和降水(蓝色等值线, 单位: mm)分布图彩色区为地形高度(单位: m) Fig.9 Flow field (vector, unit: m∙s-1) and precipitation (blue contour, unit: mm) distribution of flow around (a) and flow over (b) at 16:00 on 21 May 2018.Color area is the terrain height (unit: m) |
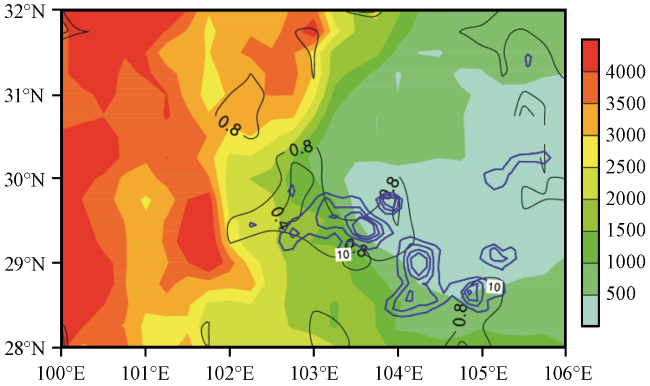
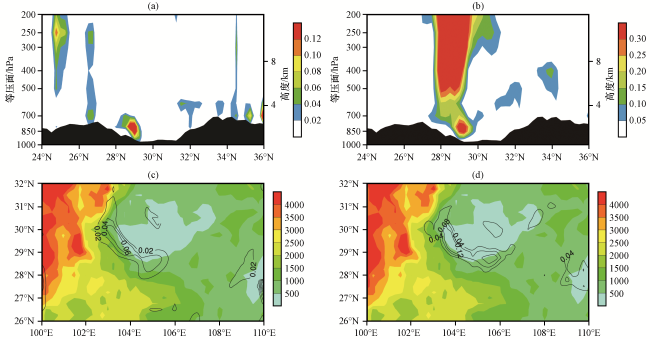


图11 2018年5月21日16:00爬流强迫的垂直速度(a, 彩色区)和ERA5提供的垂直速度(b, 彩色区)的垂直剖面以及900 hPa爬流强迫出的垂直速度(c, 黑色等值线)和900 hPa等压面上垂直运动强度(d, 黑色等值线)(单位: m∙s-1)(a)和(b)中的黑色阴影以及(c)和(d)中的彩色区均为地形(单位: m) Fig.11 Vertical velocity forced by flow over (a, color area) and vertical section provided by ERA5 (b, color area), vertical velocity forced by flow over at 900 hPa (c, contour) and vertical motion intensity at 900 hPa (d, contour) at 16:00 on 21 May 2018.Unit: m∙s-1.The black shadow in (a) and (b), and the color area in (c) and (d) is the terrain (unit: m) |