

1 引言
2 降水过程简介
3 三种资料的大中尺度环流特征
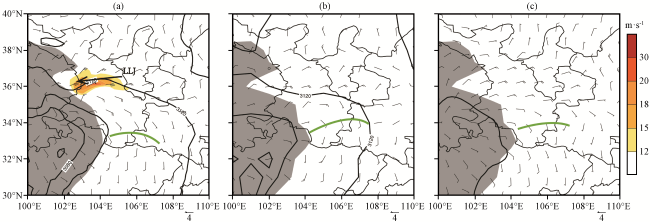
图2 2017年8月6日12:00 GRAPES_GFS(a)、 FNL(b)和ERA-interim(c)三种资料分析700 hPa的环流形势黑色等值线为位势高度(单位: gpm); 彩色区为风速大于12 m·s-1的低空急流区; 阴影为地形高度大于3000 m的地区; 绿色线为切变线; 箭头表示低空急流(LLJ)的风向, 风向杆标准为4 m·s-1 Fig.2 The circulation situation of GRAPES_GFS (a), FNL (b) and ERA-interim (c) three objective data of 700 hPa at 12:00 on 6 August 2017.The black contours represent geopotential height (unit: gpm); Coloring area for wind speed over 12 m·s-1; The shadow region for terrain height which is greater than 3000 m of 700 hPa; Green line for the shear line; The arrow indicate wind direction of Low Level Jet (LLJ); A full barb indicates 4 m·s-1 |
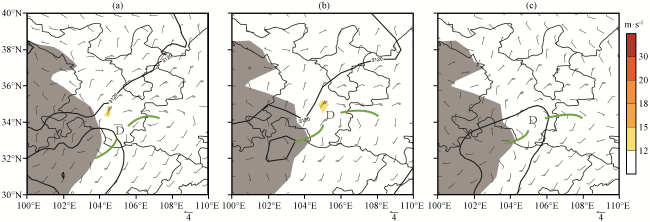
图3 2017年8月7日00:00 GRAPES_GFS(a)、 FNL(b)和ERA-interim(c)三种资料分析700 hPa的环流形势黑色等值线为位势高度(单位: gpm); 彩色区为风速大于12 m·s-1的低空急流区; 阴影为地形高度大于3000 m的地区; 绿色线为切变线; D为低压中心; 风向杆标准为4 m·s-1 Fig.3 The circulation situation of GRAPES_GFS (a), FNL (b) and ERA-interim (c) three objective data of 700 hPa at 00:00 on 7 August 2017.The black contours represent geopotential height (unit: gpm); Coloring area for wind speed over 12 m·s-1; The shadow region for terrain height which is greater than 3000 m of 700 hPa; Green line for the shear line; Capital D represent low-pressure center; A fall barb indicates 4 m·s-1 |
表1 三种资料与观测探空资料的对比Table 1 Comparison of three kinds of objective analysis data and observation sounding data |
| 要素 | 气压/hPa | 统计值 | 观测值 | GRAPES_GFS | FNL | ERA-interim |
|---|---|---|---|---|---|---|
| 位势高度/dagpm | 200 | 平均值 | 1247.76 | 1247.02 | 1246.50 | 1248.55 |
| 均方根误差 | / | 2.09 | 2.24 | 2.03 | ||
| 500 | 平均值 | 583.93 | 583.96 | 583.78 | 584.15 | |
| 均方根误差 | / | 1.20 | 1.15 | 1.21 | ||
| 700 | 平均值 | 310.58 | 310.44 | 310.60 | 310.66 | |
| 均方根误差 | / | 0.02 | 0.09 | 0.03 | ||
| 温度/℃ | 200 | 平均值 | -47.60 | -47.52 | -47.82 | -47.29 |
| 均方根误差 | / | 1.14 | 0.98 | 0.03 | ||
| 500 | 平均值 | -4.14 | -4.02 | -4.24 | -3.82 | |
| 均方根误差 | / | 0.93 | 0.87 | 0.93 | ||
| 700 | 平均值 | 11.22 | 11.21 | 11.11 | 11.37 | |
| 均方根误差 | / | 1.00 | 0.85 | 0.87 | ||
| 风速/(m·s-1) | 200 | 平均值 | 21.40 | 21.10 | 21.15 | 20.94 |
| 均方根误差 | / | 3.63 | 3.02 | 3.65 | ||
| 500 | 平均值 | 8.51 | 7.78 | 7.82 | 7.39 | |
| 均方根误差 | / | 2.21 | 1.91 | 2.29 | ||
| 700 | 平均值 | 6.75 | 6.04 | 6.13 | 5.70 | |
| 均方根误差 | / | 2.05 | 1.81 | 1.83 |
4 数值试验设计
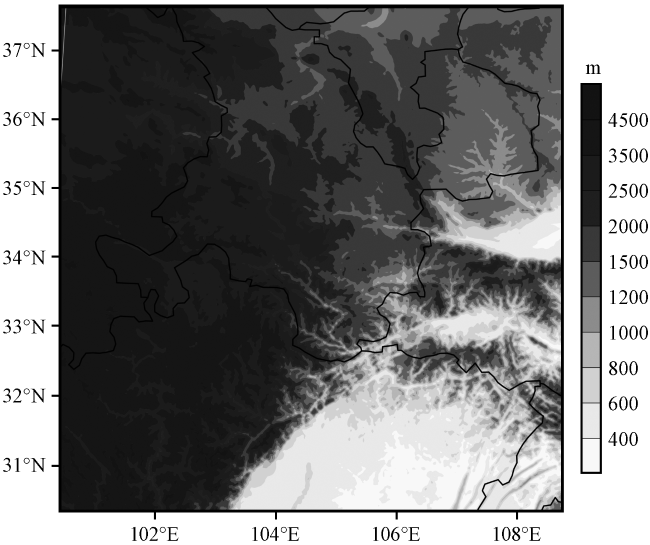
图4 WRF模式第三重嵌套网格区域填色为地形高度(单位: m) Fig.4 Third nested mesh region of WRF.The color area denote topographic height (unit: m) |
表2 数值试验的物理过程Table 2 Configuration of physical process schemes |
| 网格区域 | 积云参数化 | 微物理过程 | 边界层方案 | 短波辐射 | 长波辐射 | 陆面过程 |
|---|---|---|---|---|---|---|
| D01 | Grell-Devenyi集合方案 | WSM 6类冰雹方案 | YSU 方案 | Goddard 短波方案 | RRTM方案 | RUC 陆面过程方案 |
| D02 | Grell-Devenyi集合方案 | WSM 6类冰雹方案 | YSU 方案 | Goddard 短波方案 | RRTM方案 | RUC 陆面过程方案 |
| D03 | 无 | WSM 6类冰雹方案 | YSU 方案 | Goddard 短波方案 | RRTM方案 | RUC 陆面过程方案 |
5 模拟结果对比分析
5.1 环流分布特征的对比分析
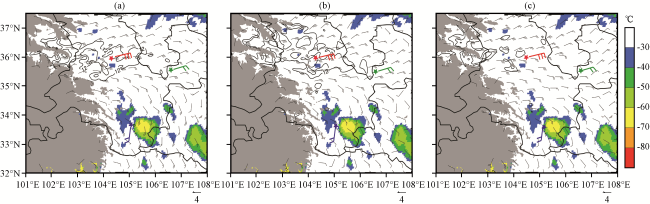
图5 D03模拟区域2017年8月6日12:00 700 hPa上GRAPES_GFS资料(a)、 FNL资料(b)、 ERA-interim资料(c)模拟风场(等值线, 单位: m·s-1)和TBB(彩色区, 单位: ℃)合成分布三种不同颜色标志为观测风场(红色为榆中站, 绿色为平凉站, 紫色为武都站); 阴影为地形高度大于3000 m的地区 Fig.5 The simulated wind field (contour, unit: m·s-1) and TBB (color area, unit: ℃) of GRAPES_GFS (a), FNL (b), ERA-interim (c) on analog domain D03 of 700 hPa at 12:00 on 6 August 2017.Three different marks are observation station (red is Yuzhong, green is Pingliang, purple is Wudu); The shadow region for terrain height which is greater than 3000 m of 700 hPa |
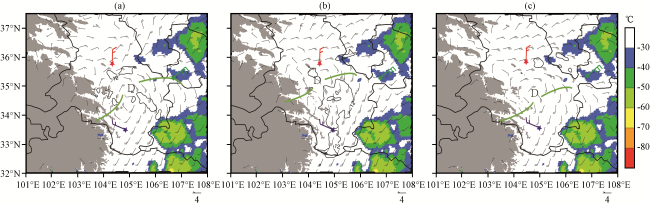
图6 D03模拟区域2017 年8月7日00:00 700 hPa上GRAPES_GFS资料(a)、 FNL资料(b)、 ERA-interim资料(c)模拟风场和TBB合成分布三种不同颜色标志为观测风场(红色为榆中站, 绿色为平凉站, 紫色为武都站); D表示低压中心, 绿色线为切变线; 阴影为地形高度大于3000 m的地区 Fig.6 The simulated wind field (contour, unit: m·s-1) and TBB (color area, unit: ℃) of GRAPES_GFS (a), FNL (b), ERA-interim (c) on analog domain D03 of 700 hPa at 00:00 on 7 August 2017.Three different marks are observation station (red is Yuzhong, green is Pingliang, purple is Wudu); D represent low-pressure center and green line for the shear line; The shadow region for terrain height which is greater than 3000 m of 700 hPa |
5.2 降水分布特征的对比分析
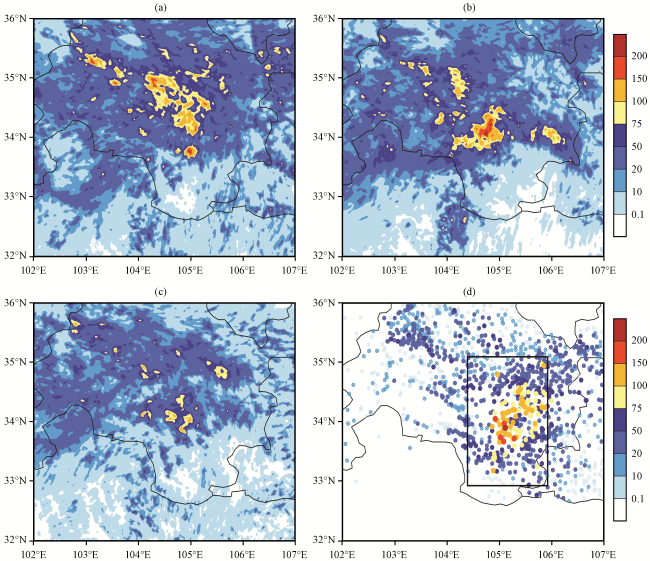


图7 GRAPES_GFS资料(a)、 FNL资料(b)和ERA-interim资料(c)作为初始场D03模拟区域及同时段观测(d)的2017年8月6日00:00至7日00:00 24 h降水量分布(单位: mm)图(d)中方框为计算区域平均小时降水率的范围 Fig.7 The distribution of 24-hour precipitation of GRAPES_GFS (a), FNL (b), ERA-interim (c) at D03 and observation (d) from 00:00 on 6 to 00:00 on 7 August 2017.Unit: mm.In Fig.7(d), the rectangle represents the range of calculating the average hourly precipitation rate |
表3 降水预报检验方法Table 3 Test method for precipitation |
| 观测有降水 | 观测无降水 | |
|---|---|---|
| 模拟有降水 | N1 | N3 |
| 模拟无降水 | N2 | N4 |
表4 不同阈值下三种初始场资料模拟结果的总指数( TS)、 虚假预警率( FAR)、 命中率( POD)Table 4 The TS, FAR, POD results of three kinds of initial field simulation under different threshold |
| 评分指标 | 降水量级/mm | GRAPES_GFS | FNL | ERA-interim |
|---|---|---|---|---|
| TS | ≥10 | 0.58 | 0.56 | 0.47 |
| ≥20 | 0.39 | 0.31 | 0.24 | |
| ≥50 | 0.10 | 0.03 | 0.01 | |
| ≥75 | 0.02 | 0.02 | 0 | |
| FAR | ≥10 | 0.38 | 0.33 | 0.33 |
| ≥20 | 0.51 | 0.50 | 0.50 | |
| ≥50 | 0.75 | 0.85 | 0.67 | |
| ≥75 | 0.85 | 0.86 | 1 | |
| POD | ≥10 | 0.90 | 0.76 | 0.62 |
| ≥20 | 0.66 | 0.45 | 0.32 | |
| ≥50 | 0.15 | 0.04 | 0.02 | |
| ≥75 | 0.02 | 0.02 | 0 |