
1 引言
2 资料来源与方法介绍
3 冷涡短时强降水时间分布特征
表1 2011 -2020年6 -8月冷涡背景下东北地区主要短时强降水过程Table 1 Cases of hourly heavy rainfall in Northeast China induced by cold vortices from June to August during 2011 -2020 |
| 冷涡序号 | 短时强降水时段 | 最大1 h降水量/mm | 冷涡序号 | 短时强降水时段 | 最大1 h降水量/mm |
|---|---|---|---|---|---|
| 1 | 2011年6月7 -9日 | 34.9 | 34 | 2016年6月15 -18日 | 88.3 |
| 2 | 2011年7月1 -3日 | 43.4 | 35 | 2016年6月23日 | 26.1 |
| 3 | 2011年7月7 -8日 | 48.2 | 36 | 2016年6月29 -30日 | 65.1 |
| 4 | 2011年7月12 -14日 | 48.9 | 37 | 2016年7月20 -21日 | 33.3 |
| 5 | 2011年7月18 -21日 | 52.6 | 38 | 2016年7月27 -29日 | 48.7 |
| 6 | 2011年8月1 -3日 | 74.8 | 39 | 2016年8月12 -13日 | 50.2 |
| 40 | 2016年8月16、 18日 | 36.0 | |||
| 7 | 2012年6月8 -12日 | 69.2 | |||
| 41 | 2017年6月1日 | 26.0 | |||
| 8 | 2012年7月1 -2日 | 37.2 | |||
| 9 | 2012年7月9 -10日 | 40.4 | 42 | 2017年6月19 -21日 | 58.5 |
| 10 | 2012年7月20 -26日 | 63.2 | 43 | 2017年6月24 -25日 | 48.6 |
| 11 | 2012年8月8日 | 33.7 | 44 | 2017年7月13 -14日 | 107.1 |
| 12 | 2013年6月17 -19日 | 40.6 | 45 | 2017年8月5 -9日 | 56.3 |
| 13 | 2013年7月1 -2日 | 42.8 | 46 | 2017年8月11 -16日 | 69.1 |
| 14 | 2013年7月15 -19日 | 47.7 | 47 | 2018年6月12 -14日 | 42.2 |
| 15 | 2013年7月23日 | 46.4 | 48 | 2018年6月19 -20日 | 37.7 |
| 16 | 2013年8月12 -14日 | 59.6 | 49 | 2018年6月29日 | 54.6 |
| 17 | 2013年8月28日 | 58.6 | 50 | 2018年7月13 -14日 | 32.9 |
| 18 | 2014年6月7 -10日 | 41.6 | 51 | 2018年8月19 -21日 | 66.1 |
| 19 | 2014年6月6日 | 21.2 | 52 | 2019年6月7 -9日 | 33.2 |
| 20 | 2014年6月17 -18日 | 47.1 | 53 | 2019年6月26、 29日 | 69.8 |
| 21 | 2014年6月21 -23日 | 50.6 | 54 | 2019年7月7 -8日 | 28.8 |
| 22 | 2014年7月3 -4日 | 32.9 | 55 | 2019年7月9 -13日 | 84.1 |
| 23 | 2014年7月7 -8日 | 43.0 | 56 | 2019年7月23 -26日 | 50.9 |
| 24 | 2014年7月19 -21日 | 88.4 | 57 | 2019年7月27 -30日 | 69.1 |
| 25 | 2014年8月14 -18日 | 42.3 | 58 | 2019年8月22、 25日 | 52.1 |
| 26 | 2015年6月6 -9日 | 31.1 | 59 | 2019年8月26 -30日 | 53.6 |
| 27 | 2015年6月12日 | 39.2 | 60 | 2020年6月3日 | 25.8 |
| 28 | 2015年6月17 -19日 | 58.5 | 61 | 2020年6月20日 | 34.6 |
| 29 | 2015年7月26 -30日 | 62.9 | 62 | 2020年7月15 -16日 | 33.1 |
| 30 | 2015年8月2 -3日 | 41.8 | 63 | 2020年7月17、 19日 | 31.2 |
| 31 | 2015年8月6 -9日 | 61.1 | 64 | 2020年8月2 -4日 | 86.7 |
| 32 | 2015年8月19 -22日 | 47.7 | 65 | 2020年8月18 -19日 | 43.9 |
| 33 | 2016年6月10 -11日 | 39.4 |
3.1 月变化
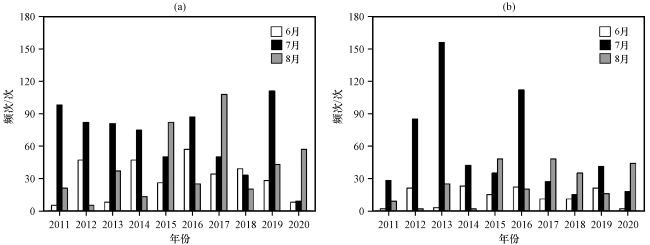
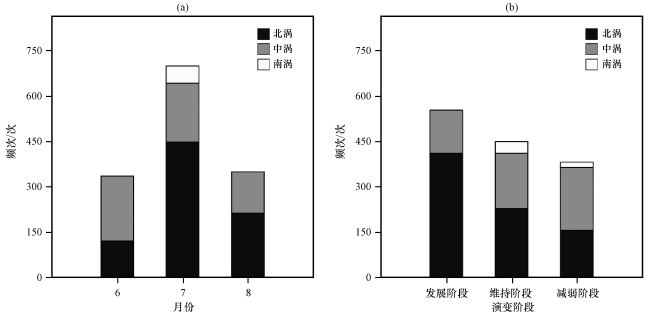
图3 2011 -2020年6 -8月不同冷涡类型造成的短时强降水频次月分布(a)和冷涡各演变阶段短时强降水频次分布(b)Fig.3 The monthly distribution of hourly heavy rainfall induced by different types of cold vortices (a) and hourly heavy rainfall distribution at each evolution stage of cold vortices (b) from June to August during 2011 -2020 |
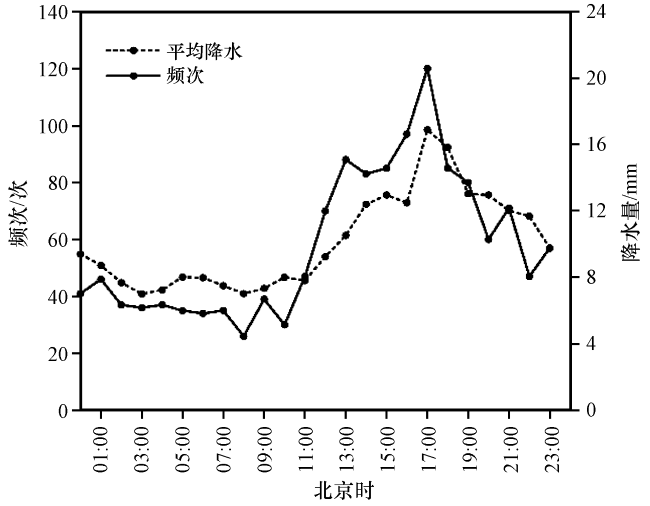
3.2 日变化
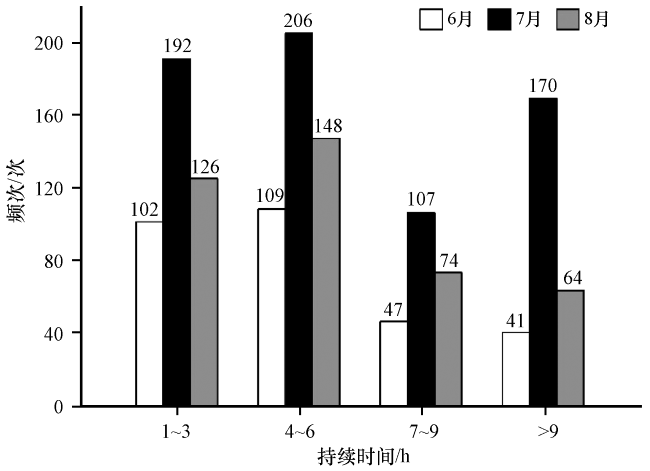
3.3 降水持续时间
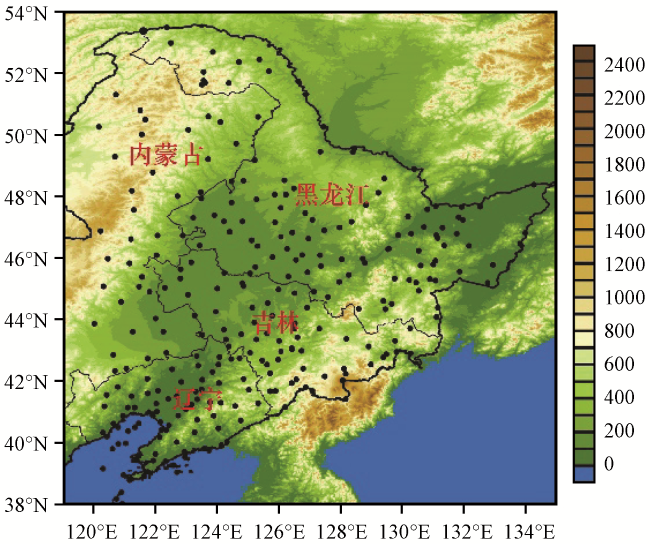
4 冷涡短时强降水的空间分布特征
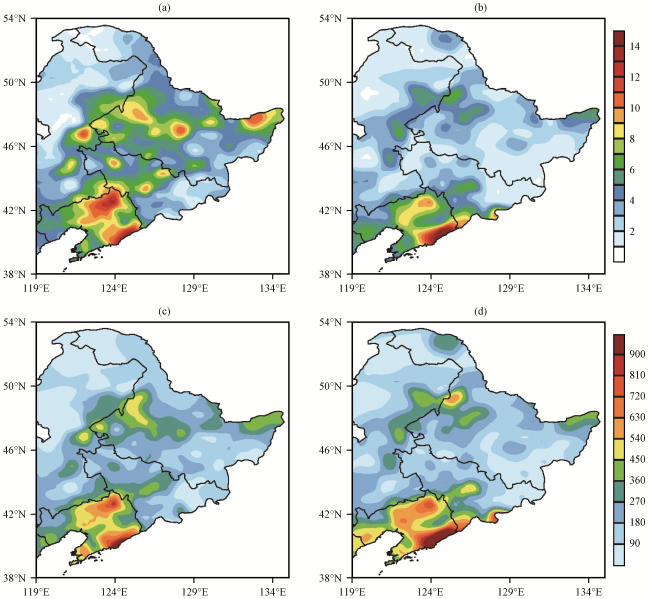
图6 2011 -2020年6 -8月冷涡背景下短时强降水(左)与暴雨(右)发生频次(a, b, 单位: 次)和对应降水量(c, d, 单位: mm)的空间分布Fig.6 The total frequency (a, b, unit: times) and corresponding precipitation (c, d, unit: mm) of hourly heavy rainfall (left) and rainstorm (right) caused by cold vortices from June to August during 2011 -2020 |
5 冷涡短时强降水天气分型
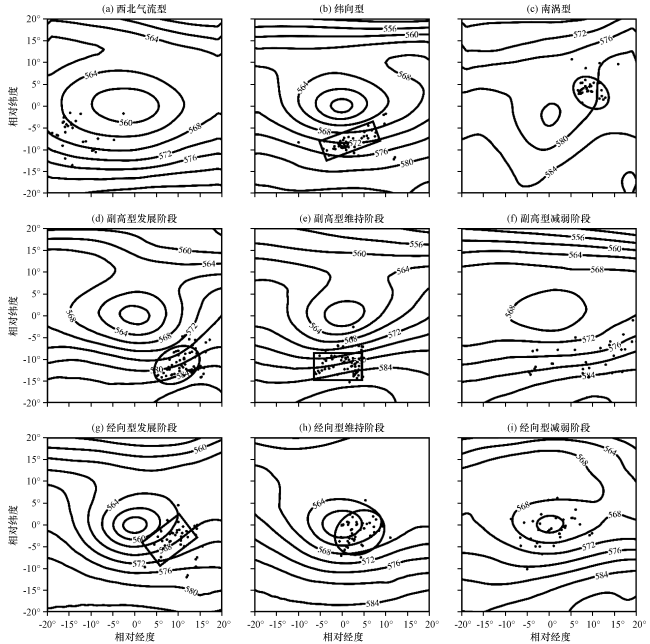
5.1 环流特征及降水落区
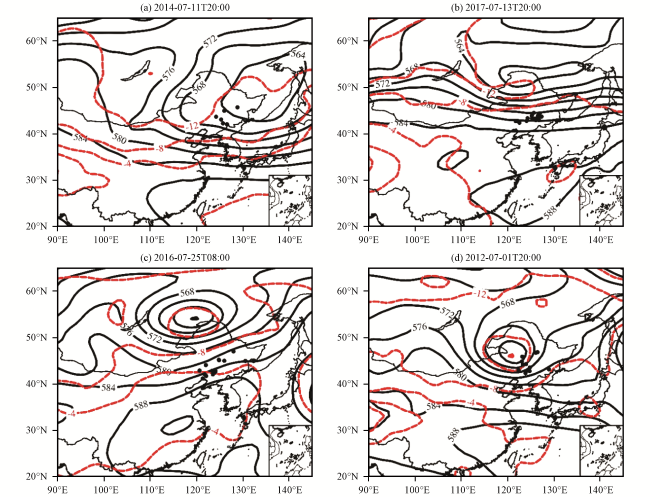
图7 西北气流型(a)、 纬向型(b)、 副高型(c)以及经向型(d)代表个例的500 hPa位势高度(黑色实线, 单位: dagpm)和温度(红色虚线, 单位: ℃)黑色圆点表示24 h内短时强降水站点 Fig.7 Geopotential height (blank solid line, unit: dagpm) and temperature (red dotted line, unit: ℃) of representative cases of northwest airflow type (a), zonal type (b), subtropical high type (c) and meridional type (d) at 500 hPa.Black dots represent hourly heavy precipitation within 24 hours |
5.2 冷涡短时强降水成因分析
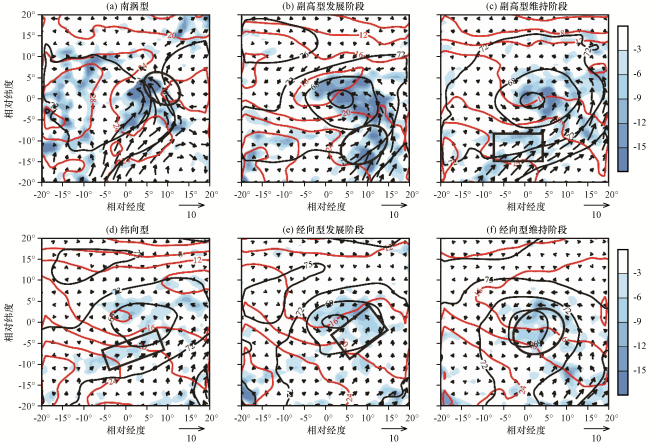
图9 925 hPa合成的位势高度(黑色等值线, 单位: dagpm)、 温度(红色等值线, 单位: ℃)、 水汽通量(矢量, 单位: g·cm-1·hPa-1·s-1)和水汽通量散度(彩色区, 单位: ×10-7 g·cm-2·hPa-1·s-1)方框和椭圆表示降水集中区 Fig.9 Composite geopotential height (blank contour, unit: dagpm), temperature (red contour, unit: ℃), moisture flux (vector wind, unit: g·cm-1·hPa-1·s-1) and moisture flux divergence (color area, unit: ×10-7 g·cm-2·hPa-1·s-1) at 925 hPa.The boxes and ellipses represent precipitation concentration areas |
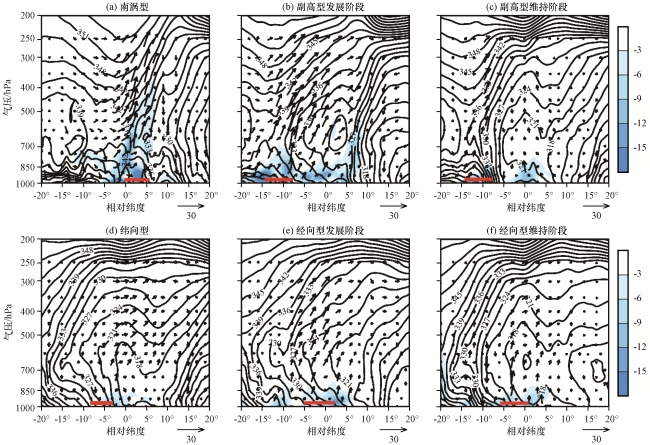
图12 沿降水区相对经度7.0°E(a)、 11.5°E (b)、 0.5°E (c)、 5.0°E (d)、 9.5°E (e)、 2.0°E (f)的水汽通量散度(彩色区, 单位: ×10-7 g·cm-2·hPa-1·s-1)、 假相当位温(等值线, 单位: K)以及风矢量的经向垂直剖面红色短线表示降水区, 风矢量为v(单位: m·s-1)和w(单位: ×10-2 Pa·s-1)的合成 Fig.12 Latitude-height cross sections of moisture flux divergence (color area, unit: ×10-7 g·cm-2·hPa-1·s-1), θ se (contour, unit: K) and the wind vector along the relative longitudes in main precipitation areas, which are 7.0°E (a), 11.5°E (b), 0.5°E (c), 5.0°E (d), 9.5°E (e) and 2.0°E (f).The red line represents precipitation area, the wind vector is composed of v (unit: m·s-1) and w (unit: ×10-2 Pa·s-1) |
6 冷涡短时强降水对流参数特征
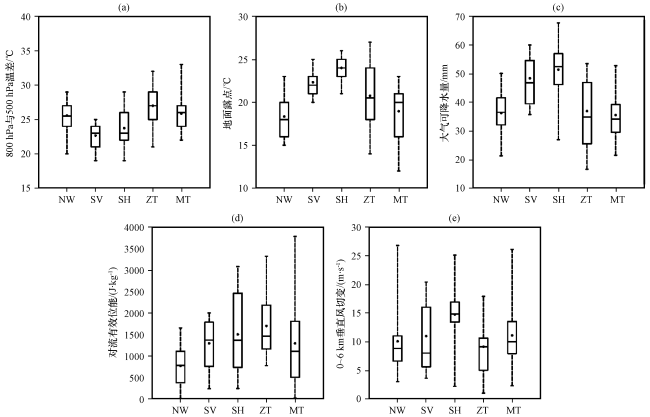
图13 东北地区冷涡短时强降水对流参数ΔT 85 (a)、 Td (b)、 PW (c)、 CAPE (d)和0~6 km垂直风切变(e)的箱型图NW为西北气流型, SV为南涡型, SH为副高型, ZT为纬向型, MT为经向型 Fig.13 Box-plots of convection parameters of hourly severe rainfall caused by cold vortices in Northeast China, which is include ΔT 85 (a)、 Td (b)、 PW (c)、 CAPE (d) and 0~6 km vertical wind shear (e).NW, SV, SH, ZT, MT represent northwest airflow type, south vortex type, subtropical high type, zonal type and meridional type |