

1 引 言
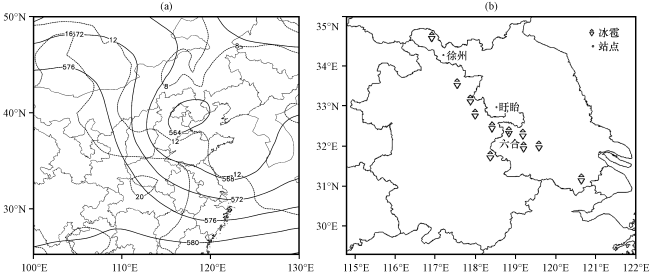
2 环流背景和天气概况
3 模式方案设计和模拟结果检验
3.1 模拟方案
3.2 模拟结果检验
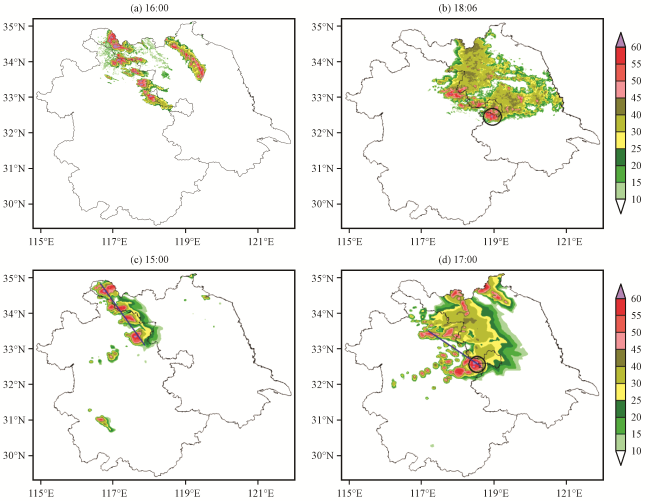
图2 观测(a, b)与模拟的(c, d)2015年4月28日组合反射率因子(单位: dBz)圆圈表示导致六合站出现强冰雹的超级单体风暴; 蓝色斜线表示后文中图5和图6的剖面位置 Fig.2 Observed (a, b) and simulated (c, d) composite reflectivity factor (unit: dBz) at 16:00 (a), 18:06 (b), 15:00 (c) and 17:00(d) on 28 April 2015.The circle represent the supercell storm causing heavy hails at Luhe station; The blue slash shows the section positions of Fig.5 and Fig.6 in the following text |
4 雹暴过程中的重力波特征
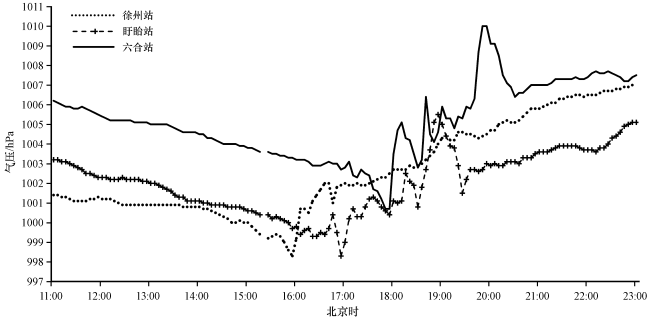
4.1 冰雹期间的气压波动
4.2 物理量场的波动特征
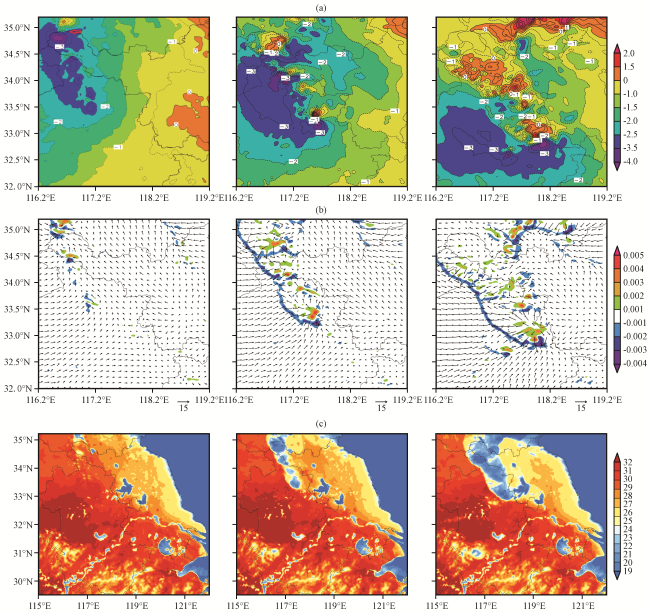
图4 模拟的2015年4月28日14:00(左)、 15:00(中)和16:00(右)海平面气压距平(a, 彩色区和等值线, 单位: hPa), 地面风场(矢量, 单位: m s-1)及散度场(彩色区, 单位: s-1)(b)以及2 m温度(c, 彩色区, 单位: ℃)红色箭头表示14:00风暴所处位置 Fig.4 Simulated sea level pressure anomaly (a, color area and counter, unit: hPa), wind field (vector, unit: m·s-1) and divergence field (color area, unit: s-1) on the surface (b), 2 m temperature (c, color area, unit: ℃) at 14:00 (left)、 15:00 (middle)、 16:00 (right) on 28 April 2015.The storm location at 14:00 is marked by red arrow in Fig.4(a) |
5 风暴组织过程的一种可能机制—中尺度重力波
5.1 重力波的形成和发展
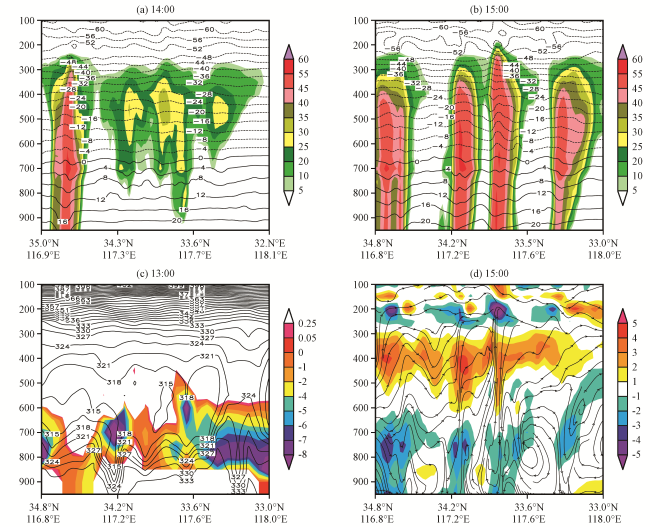
图5 模拟的2015年4月28日14:00 和15:00温度场(等值线, 单位: ℃)和反射率因子(彩色区, 单位: dBz)(a~b), 13:00假相当位温(等值线, 单位: K)和Richardson数 (彩色区)(c)以及15:00流场(流线)和温度距平场(彩色区, 单位: ℃) (d)垂直剖面图5(b)~(d)为沿图2(c)中斜线作的剖面 Fig.5 Simulated vertical cross-section of the temperature field (contour, unit: ℃) and reflectivity factor (color area, unit: dBz) at 14:00 and 15:00 (a~b), the potential pseudo-equivalent temperature (contour, unit: K) and Richardson number (color area) at 13:00 (c), the flow field (streamline) and temperature anomaly field (color area, unit: ℃) at 15:00 (d) on 28 April 2015.Fig.5(b)~(d) are the sections along the oblique line in Fig.2(c) |
5.2 中尺度重力波与对流的组织结构
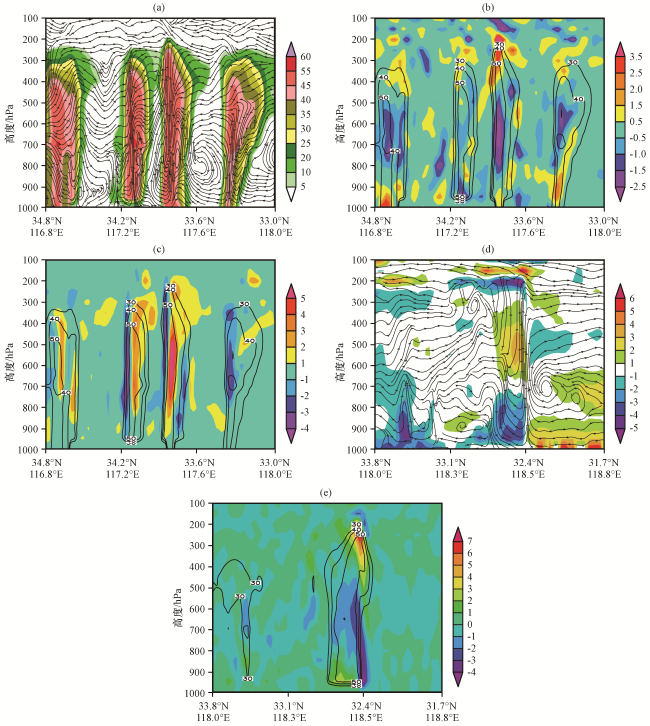


图6 模拟的2015年4月28日15:00流场(流线)和反射率因子(彩色区, 单位: dBz) (a), 散度 (彩色区, 单位: ×10-3 s-1)和反射率因子(等值线, 单位: dBz) (b), 涡度 (彩色区, 单位: ×10-3 s-1)和反射率因子(等值线, 单位: dBz) (c), 17:00流场(流线)和温度距平(彩色区, 单位: ℃) (d)及散度 (彩色区, 单位: ×10-3 s-1)和反射率因子(等值线, 单位: dBz) (e)图6(a)~(c)为沿图2(c)中斜线作的剖面, 图6(d)~(e)为沿图2(d)中斜线作的剖面 Fig.6 Simulated vertical cross-section of the flow field (stream line) and reflectivity factor (color area, unit: dBz) (a), the divergence (color area, unit: ×10-3 ·s-1) and reflectivity factor (contour, unit: dBz) (b), the vorticity (color area, ×10-3 ·s-1) and reflectivity factor (contour, unit: dBz) (c) at 15: 00、 the flow field (streamline) and temperature anomaly field (color area, unit: ℃) (d), the divergence (color area, unit: ×10-3 ·s-1) and reflectivity factor (contour, unit: dBz) (e) at 17:00 28 April 2015.Fig.6(a)~(c) are the sections along the oblique line in Fig.2(c); Fig.6(d)~(e) are the sections along the oblique line in Fig.2(d) |