1 引言
2 研究区域与资料来源
2.1 研究区域
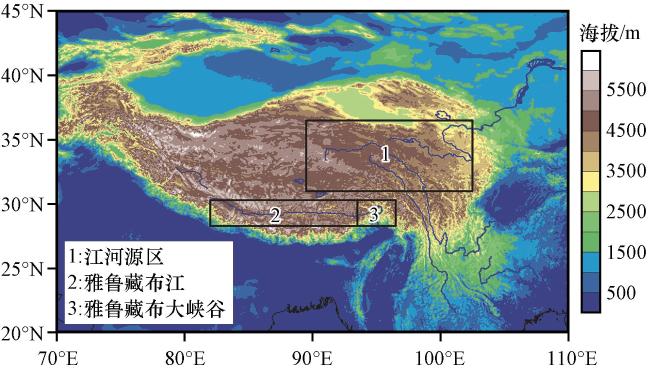
图1 青藏高原地区江河源(方框1), 雅鲁藏布江(方框2)及雅鲁藏布大峡谷(方框3)海拔(单位: m)和地理位置分布蓝色曲线表示河流 Fig.1 Altitude (unit: m) and geographical distribution of the Source Region of the Three-River (frame 1), Brahmaputra River (frame 2) and Brahmaputra Grand Canyon (frame 3) over the Qinghai-Xizang Plateau.The blue lines indicate the rivers |
2.2 资料来源
3 研究方法
3.1 大气水汽含量的计算
3.2 水汽输送通量及通量散度的计算
3.3 各边界水汽收支的计算
4 江河源及其毗邻地区水汽的时空分布特征
4.1 ERA5再分析数据的适用性分析
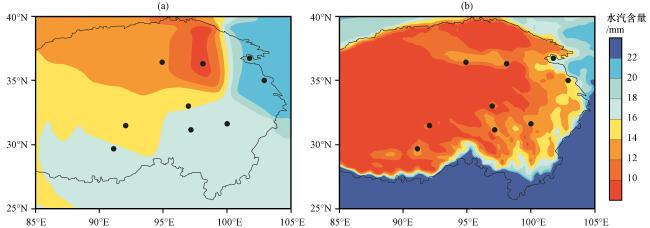
图2 1981 -2010年江河源及其毗邻地区夏季探空资料(a)和ERA5再分析资料(b)水汽含量的空间分布(单位: mm)黑点代表站点位置 Fig.2 Spatial distributions of water vapor content of radiosonde data (a) and reanalysis data (b) in summer over the Source Region of the Three-River and its surrounding areas during 1981 -2010.Unit: mm.The black spots represent the sites |
4.2 大气水汽含量的空间分布特征
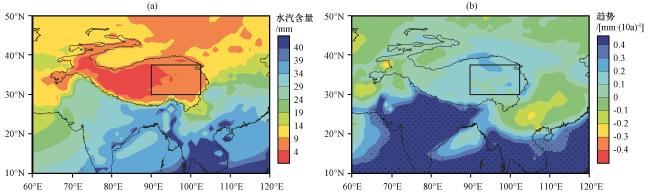
图3 1980 -2019年江河源及其毗邻地区平均水汽含量的分布(a, 单位: mm)及趋势[b, 单位: mm·(10a)-1]变化黑框为江河源区; 打点区域表示通过95%显著性水平检验 Fig.3 Distribution (a, unit: mm) and variation trend [b, unit: mm·(10a)-1] of average water vapor content over the Source Region of the Three-River and its surrounding areas during 1980 -2019.The black frames represent the Source Region of the Three-River and the dotted area passed the 95% significance test |
4.3 大气水汽含量的时间演变特征
5 江河源区水汽输送及收支特征
5.1 江河源区水汽输送特征
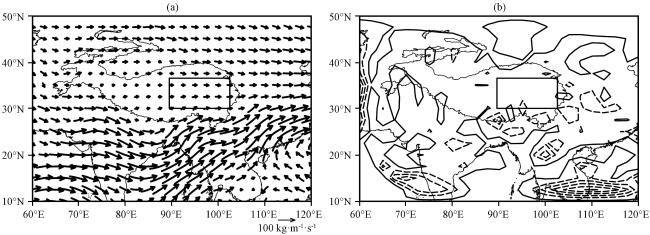
图6 1980 -2019年江河源区整层水汽通量(a, 单位: kg m-1 s-1)及其散度(b, 单位: kg m-2 d-1)分布实、 虚线分别表示正、 负散度; 黑框为江河源区 Fig.6 Distribution of water vapor flux (a, unit: kg m-1 s-1) and its divergence (b, unit: kg m-2 d-1) over the Source Region of the Three-River during 1980 -2019.The solid and dotted lines indicate positive and negative divergence.The black frames represent the Source Region of the Three-River |