1 引言
2 资料选取和方法介绍
2.1 资料选取
2.2 方法介绍
表1 主要参数列表Table 1 List of main parameters |
| 模拟区域1 | 模拟区域2 | |
|---|---|---|
| 分辨率 | 30 km | 10 km |
| 格点数 | 226×180 | 340×262 |
| 微物理方案 | WRF single-moment 6-class (WSM6) | WRF single-moment 6-class (WSM6) |
| 积云参数化方案 | Kain-Fritsch | Kain-Fritsch |
| 长波辐射方案 | RRTM | RRTM |
| 短波辐射方案 | RRTMG | RRTMG |
| 近地面层方案 | Revised MM5 | Revised MM5 |
| 陆面过程方案 | Noah | Noah |
| 边界层方案 | YSU | YSU |
3 降水过程诊断分析
3.1 降水实况
3.2 天气背景分析
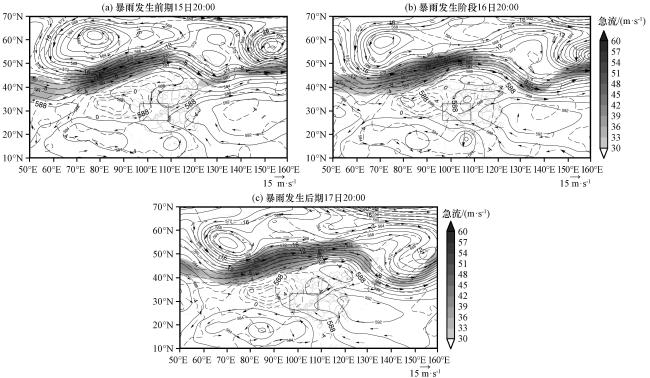
图2 2017年7月15 -17日500 hPa形势场和200 hPa高空急流黑色实线为500 hPa高度场(单位: dagpm); 黑色虚线为500 hPa温度场(单位: ℃); 黑色箭头为500 hPa风场(单位: m·s-1);灰色阴影为200 hPa高空急流(单位: m·s-1); 黑色长方形区域表示四川地区 Fig.2 The synoptic weather pattern at 500 hPa and upper jets at 200 hPa from 15 to 17 July 2017.The black solid line is the geopotential height at 500 hPa (unit: dagpm), the black dotted line is the temperature at 500 hPa (unit: ℃), the black arrow is the wind field at 500 hPa (unit: m·s-1), the grew shadow is the upper jets at 200 hPa (unit: m·s-1), the black rectangular area represents the Sichuan area |
3.3 水汽条件分析
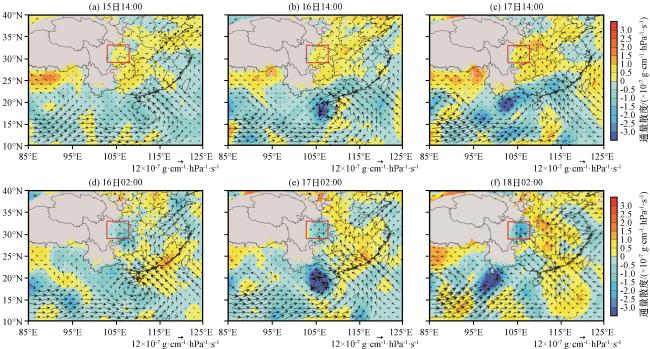
图3 2017年7月15 -18日850 hPa水汽通量(矢量, 单位: ×10-7 g·cm-1·hPa-1·s-1)和水汽通量散度(阴影, 单位: ×10-7 g·cm-2·hPa-1·s-1)分布红色长方形区域表示四川地区 Fig.3 The distribution moisture flux (vector, unit: ×10-7 g·cm-1·hPa-1·s-1) and the divergence of moisture flux (the shaded, unit: ×10-7 g·cm-2·hPa-1·s-1) at 850 hPa.The red rectangular area indicates Sichuan area |
4 数值模拟
4.1 模拟结果检验
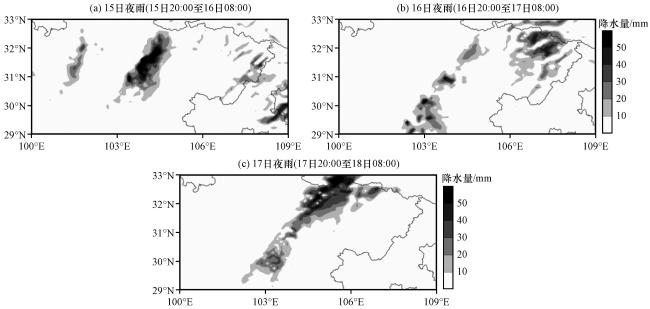
4.2 模拟结果分析
4.2.1 山谷风局地环流
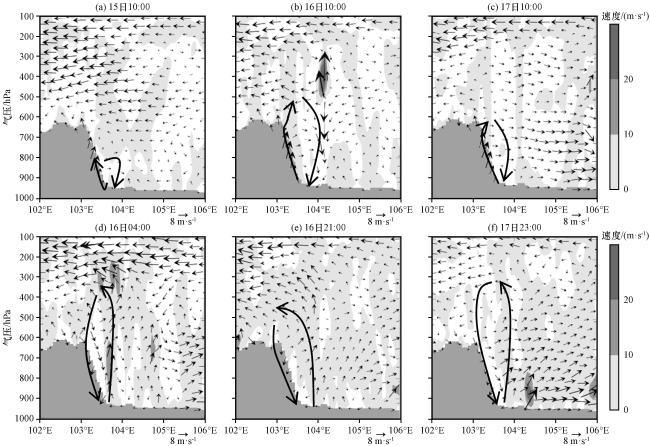
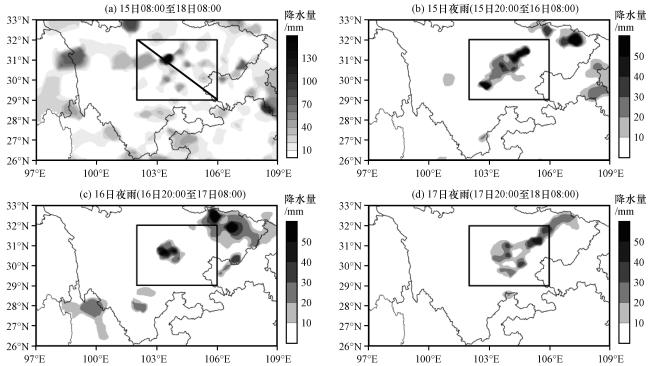
图5 2017年7月15 -17日沿着图1(a)强降水中心做垂直环流剖面矢量为剖面风场, 灰色阴影为垂直上升运动(单位: m·s-1) Fig.5 Make a section of vertical circulation along the heavy precipitation center in Fig.1(a) from 15 to 17 July 2017.The vector is the wind profile field, the grew shadow is the vertical ascending motion (unit: m·s-1) |
4.2.2 “山谷风”动力诊断分析
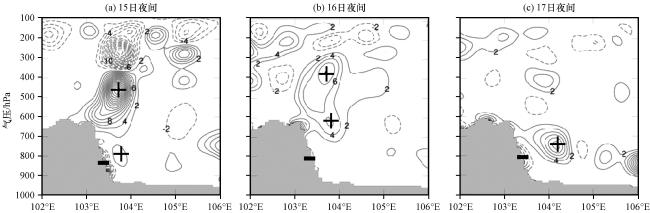
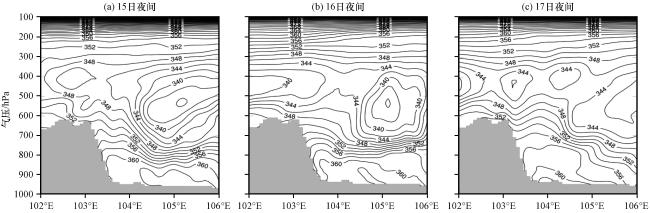
图 6 2017年7月15 -17日沿着图1(a)强降水中心做垂直螺旋度剖面(单位: ×10-7 kg-1·Pa·m3·s-2)实线为正值, 虚线为负值, 灰色阴影为地形 Fig.6 Make a section of vertical helicity along the heavy precipitation center in Figure 1(a) from 15 to 17 July 2017.Unit: ×10-7 kg-1·Pa·m3·s-2.The solid line is positive, the dotted line is negative and the gray shadow is terrain |
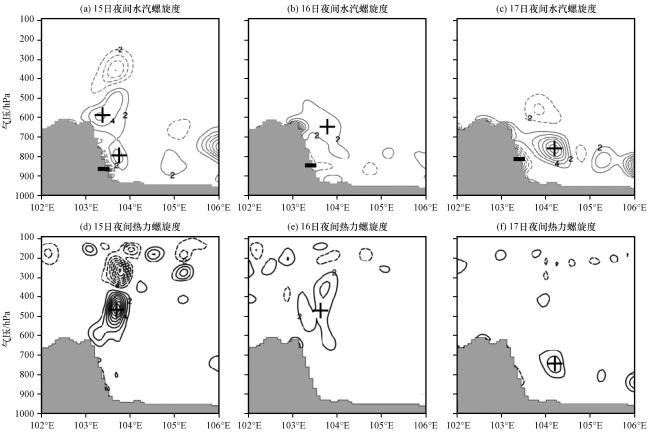
图7 2017年7月15 -17日沿着图1(a)强降水中心做水汽螺旋度(单位: ×10-9 kg-1·Pa·m3·s-2)和热力螺旋度(单位: ×10-2 K·kg-1·Pa·m3·s-2)垂直剖面实线为正值, 虚线为负值, 灰色阴影为地形 Fig.7 The vertical section of water vapor helicity (unit: ×10-9 kg-1·Pa·m3·s-2) and thermal helicity (unit: ×10-2 K·kg-1·Pa·m3·s-2) along the heavy precipitation center in Fig.1(a) from 15 to 17 July 2017.The solid line is positive, the dotted line is negative and the gray shadow is terrain |