

1 引言
2 资料来源和方法介绍
2.1 研究区域
2.2 资料来源
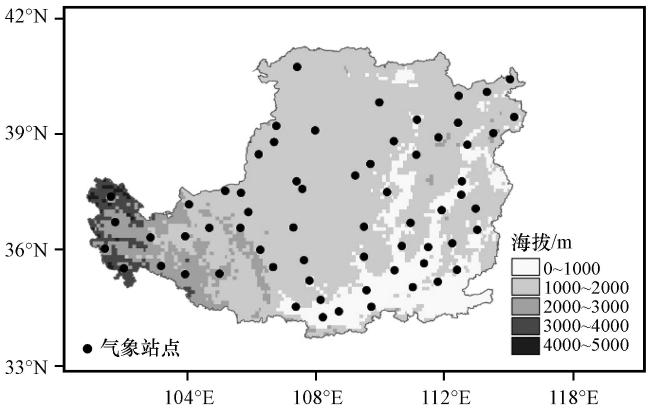
2.3 方法介绍
3 极端降水分布及变化特征
3.1 极端降水时空分布
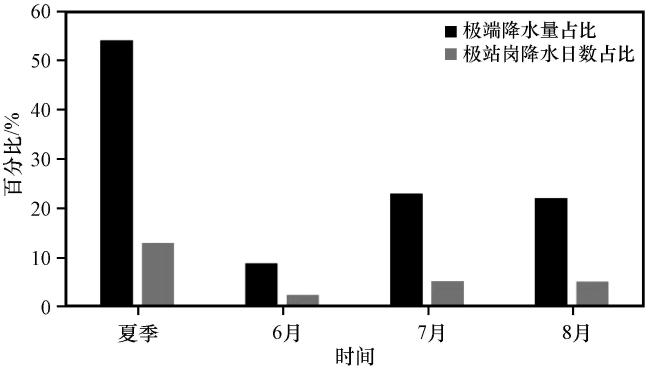
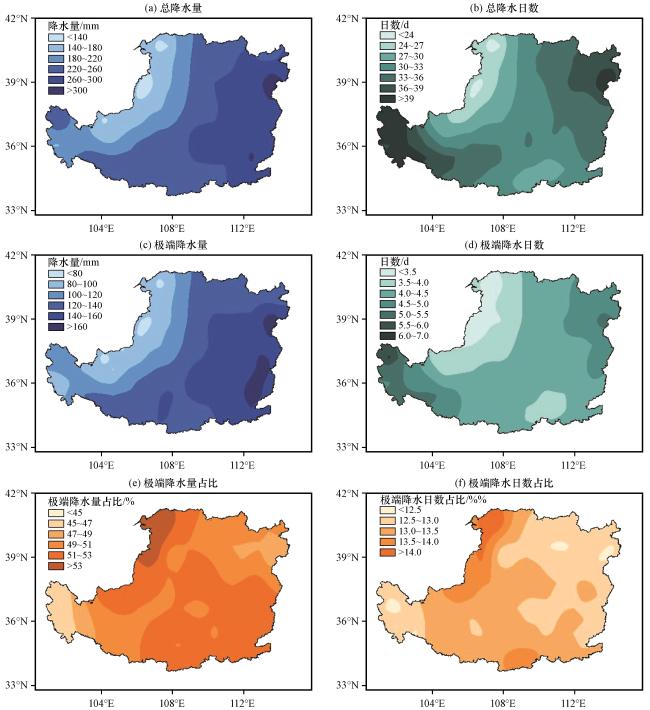
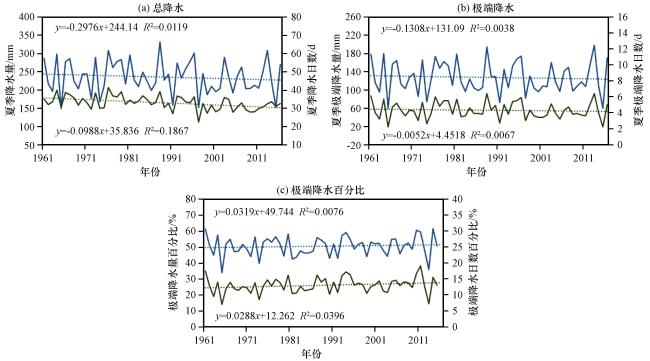
3.2 极端降水时空变化
4 极端降水环流形势对比分析
4.1 极端降水强弱年环流形势对比
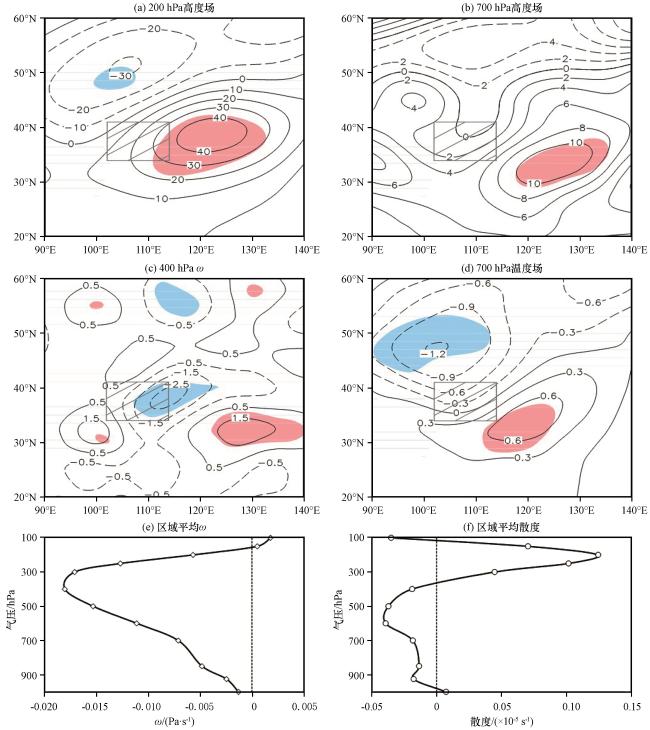
图6 极端降水事件强弱年合成差值场分布(a)~(d)中红色和蓝色阴影分别代表正、 负显著区, 灰色方框代表102°E -114°E, 34°N -41°N区域, 高度场、 温度场、 ω、 区域平均ω及平均散度的单位分别为gpm、 ℃、 (×10-2 Pa·s-1)、 Pa·s-1及(×10-5 s-1) Fig.6 Composite difference between strong and weak years of extreme precipitation.In Fig.6(a)~(d), red and blue shading indicate the positive and negative values passing the significant test, the grey box represents the area 102°E -114°E, 34°N -41°N.The unit of geopotential height, temperature field, omega, regional average omega and reginal average divergence of horizontal wind is gpm, ℃, (×10-2 Pa·s-1), Pa·s-1 and (×10-5 s-1), respectively |
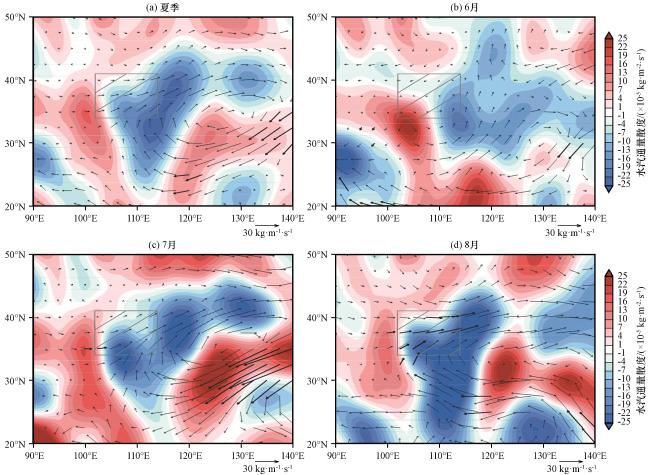
图7 极端降水事件强弱年夏季(a)和6 -8月(b~d)整层水汽通量(矢量, 单位: kg·m-1·s-1)及水汽通量散度(彩色区, 单位: ×10-5 kg·m-2·s-1)合成差值场粗风矢表示通过0.05水平的显著性检验; 灰色方框代表102°E -114°E, 34°N -41°N区域 Fig.7 Composite difference of integrated vapor flux (vector, unit: kg·m-1·s-1) and their convergence (color area, unit: ×10-5 kg·m-2·s-1) in summer (a) and June to August (b~d) between strong and weak years of extreme precipitation.Bold vector denote values passing the significance level of 0.05.The grey box represents the area 102°E -114°E, 34°N -41°N |
表1 极端降水强弱年夏季整层水汽通量的区域收支Table 1 Composite difference of regionally integrated vapor flux in summer between strong and weak years of extreme precipitation |
| 强弱年差 | 水汽通量的区域收支/(×106 kg·s-1) | |||
|---|---|---|---|---|
| 夏季 | 6月 | 7月 | 8月 | |
| 北边界 | -0.1318 | 0.0863 | -0.1833 | -0.0348 |
| 南边界 | 1.3992 | 0.0264 | 0.6416 | 0.7312 |
| 西边界 | 0.7775* | -0.0100 | 0.2752 | 0.5123 |
| 东边界 | -1.7247* | -0.0356 | -0.6169 | -1.0722 |
| 净收入差 | 0.3202 | 0.0672 | 0.1165 | 0.1365 |
*表示通过0.05的显著性水平检验。 |
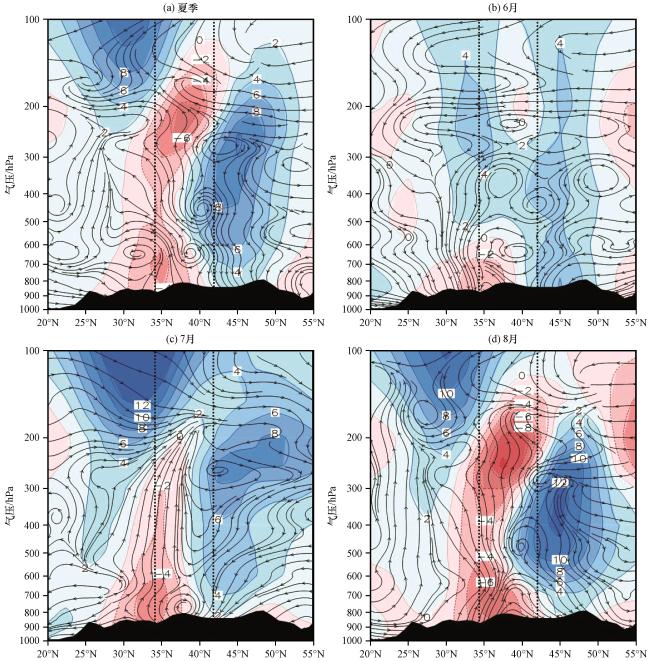
图8 强弱年夏季(a)和6 -8月(b~d)温度平流(彩色区及等值线, 单位: ×10-6 ℃·s-1)及垂直环流[流线, 风场和垂直速度ω×(-100)的合成]差值沿108°E的垂直剖面Fig.8 Composite difference of temperature advection (color area and contour, unit: ×10-6 ℃·s-1) and vertical circulation [streamline, wind field and vertical velocity ω×(-100) synthetic] along 108°E in summer (a) and June to August (b~d) between strong and weak years of extreme precipitation |
4.2 极端降水年代际环流形势对比
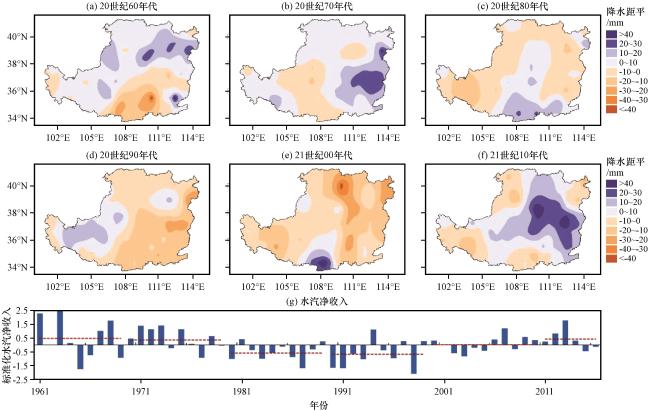
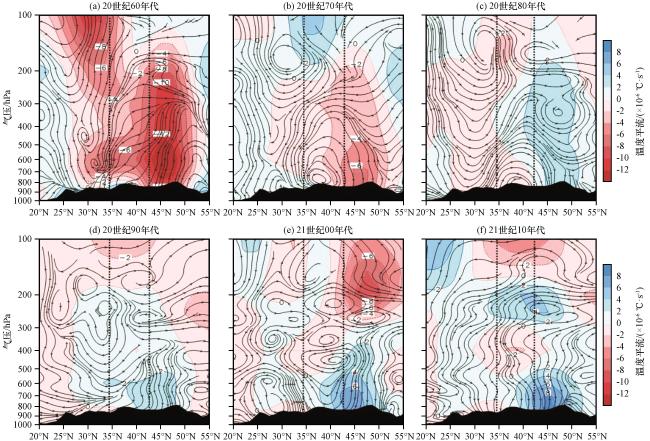


图10 年代际夏季温度平流(彩色区及等值线, 单位: ×10-6 ℃·s-1)及垂直环流[流线, 风场和垂直速度ω×(-100)的合成]沿108°E的垂直剖面Fig.10 The decadal vertical section of temperature advection (color area and contour, unit: ×10-6 ℃·s-1) and vertical circulation [streamline, wind field and vertical velocity ×(-100) synthetic] along 108°E in summer |