1 引言
2 资料来源与方法介绍
2.1 数据来源与处理
2.2 研究方法
3 结果与分析
3.1 三江源气温多年变化特征
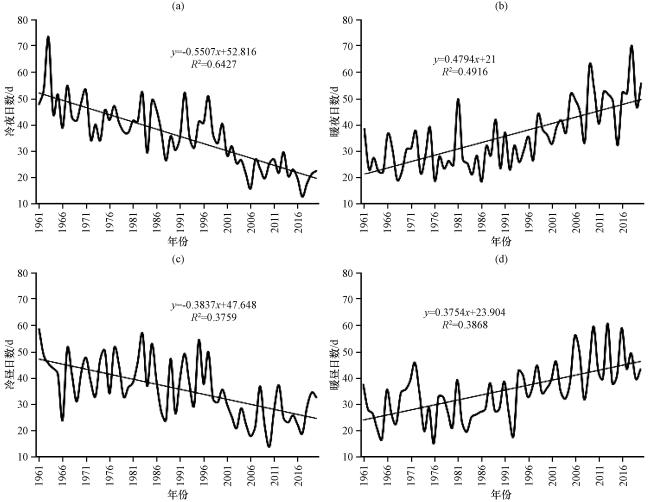
表1 极端气候指数定义Table 1 The definition of extreme climate indices |
| 指数 | 定义 |
|---|---|
| 冷夜日数 | 日最低气温小于10%分位值的日数 |
| 冷昼日数 | 日最高气温小于10%分位值的日数 |
| 暖夜日数 | 日最低气温大于90%分位值的日数 |
| 暖昼日数 | 日最高气温大于90%分位值的日数 |
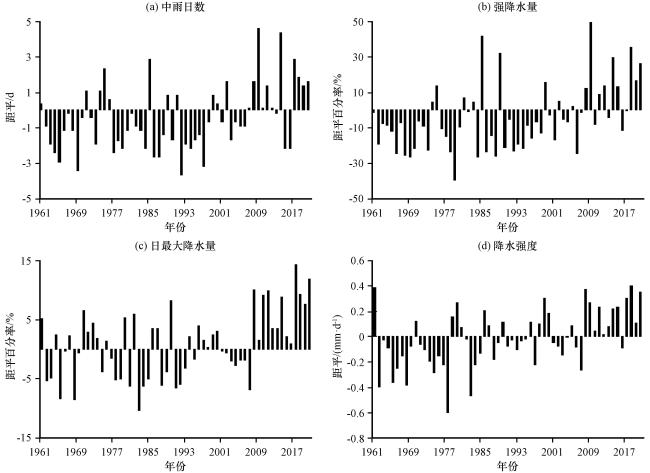
| 中雨日数 | 日降水量大于等于10 mm的日数 |
| 强降水量 | 日降水量大于95%分位值的年累计降水量 |
| 1日最大降水量 | 每年1日最大降水量 |
| 降水强度 | 年降水总量与湿日日数(日降水量大于等于1.0 mm)的比值 |
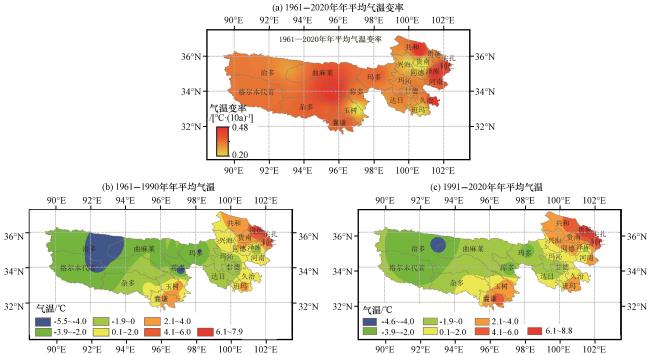
图2 1961 -2020年三江源年平均气温变率[a, 单位: ℃·(10a)-1]、 1961 -1990年(b)和1991 -2020年(c)年平均气温分布(单位: ℃)Fig.2 The distribution of annual average temperature variability from 1961 to 2020 [a, unit: ℃·(10a)-1], the annual average temperature (unit: ℃) from 1961 to 1990 (b) and from 1991 to 2020 (c) in the Three-River Regions |
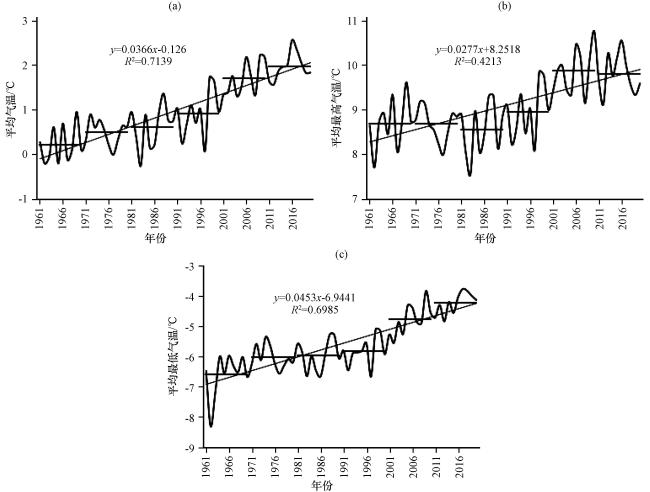
图3 1961 -2020年三江源年平均气温(a)、 年平均最高气温(b)和年平均最低气温(c)变化Fig.3 The change of annual average temperature (a), maximum temperature (b) and minimum temperature (c) in the Three-River Regions from 1961 to 2020 |
表2 三江源年平均气温、 年平均最高气温、 年平均最低气温平均值Table 2 The definition of extreme climate indices |
| 时段 | 年平均 气温/℃ | 与上一时段 差值/℃ | 年平均最高 气温/℃ | 与上一时段 差值/℃ | 年平均最低 气温/℃ | 与上一时段 差值/℃ |
|---|---|---|---|---|---|---|
| 1961 -1970年 | 0.22 | 8.69 | -6.59 | |||
| 1971 -1980年 | 0.50 | 0.28 | 8.68 | -0.01 | -6.02 | 0.57 |
| 1981 -1990年 | 0.62 | 0.12 | 8.56 | -0.12 | -5.96 | 0.06 |
| 1991 -2000年 | 0.92 | 0.3 | 8.95 | 0.39 | -5.81 | 0.15 |
| 2001 -2010年 | 1.71 | 0.79 | 9.88 | 0.93 | -4.77 | 1.04 |
| 2011 -2020年 | 1.98 | 0.27 | 9.81 | -0.07 | -4.23 | 0.54 |
3.2 三江源气温概率分布特征对比
表3 不同时段年平均、 最高和最低气温分布特征值Table 3 The characteristic value of annual average temperature, maximum temperature, and minimum temperature in different period |
| 特征值 | T avg | T max | T min | |||
|---|---|---|---|---|---|---|
| 1961 -1990年 | 1991 -2000年 | 1961 -1990年 | 1991 -2000年 | 1961 -1990年 | 1991 -2000年 | |
| 偏度 | 0.10 | -1.39 | -0.56 | -0.79 | -2.79 | -0.77 |
| 峰度 | -0.96 | -0.11 | -0.60 | -0.40 | 3.64 | -0.93 |
| 分布型 | 正态 | 正态 | 正态 | 正态 | 正态 | 非正态 |
| 均值 | 0.44 | 1.54 | 8.64 | 9.55 | -6.19 | -4.94 |
| 标准差 | 0.42 | 0.60 | 0.50 | 0.66 | 0.59 | 0.79 |
| 10%分位值 | -0.20 | 0.67 | 7.99 | 8.48 | -6.67 | -5.91 |
| 90%分位值 | 0.96 | 2.23 | 9.32 | 10.47 | -5.34 | -3.82 |
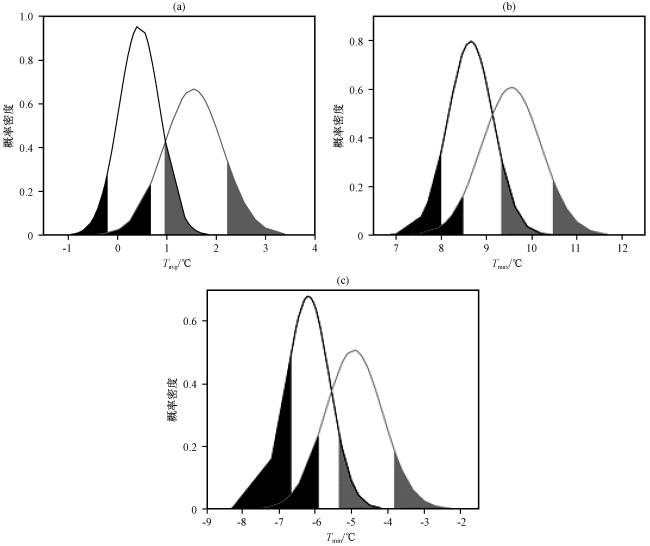
图4 1961 -1990年(黑线)和1991 -2020年(灰线)三江源区年平均气温(a)、 年平均最高气温(b)、 年平均最低气温(c)概率密度分布黑色区域表示≤10%分位值, 灰色区域表示≥90%分位值 Fig.4 The PDF of T avg (a), T max (b), T min (c) in the Three-River Regions from 1961 to 1990 (black lines) and from 1991 to 2020 (gray lines).The value of black and gray area represents ≤10th percentile and ≥90th percentile, respectively |