
1 引言
2 资料来源与方法介绍
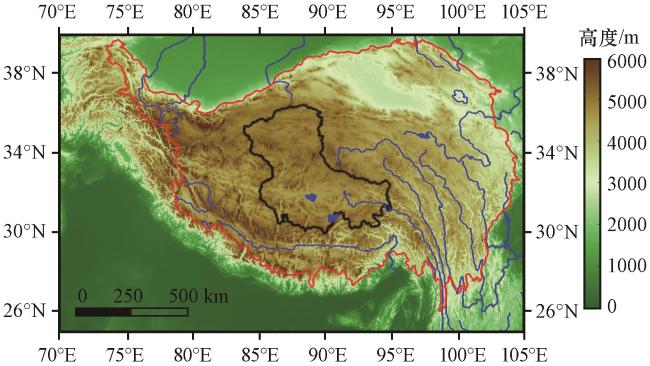
2.1 研究区域与数据来源
2.2 水汽源区的识别与定量贡献
2.3 FLEXPART后向轨迹模拟方案
3 结果分析
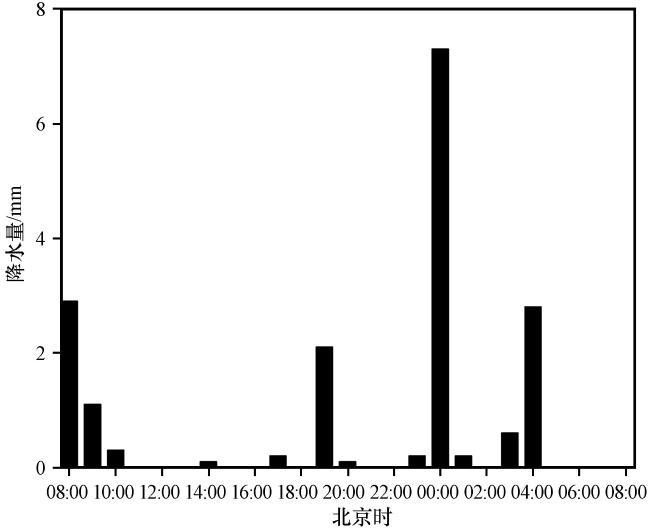
3.1 降水概况及环流场特征
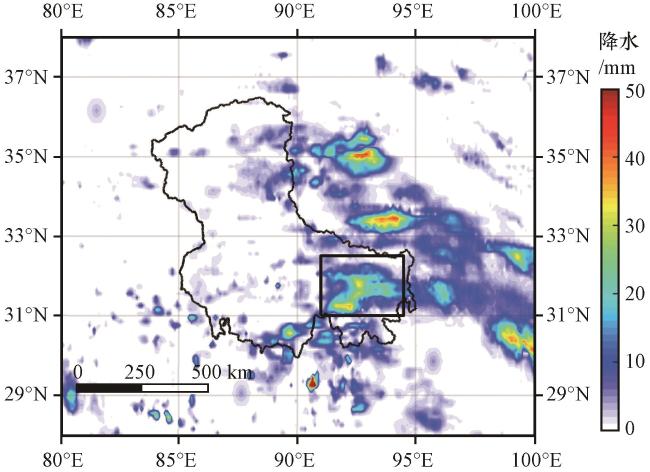
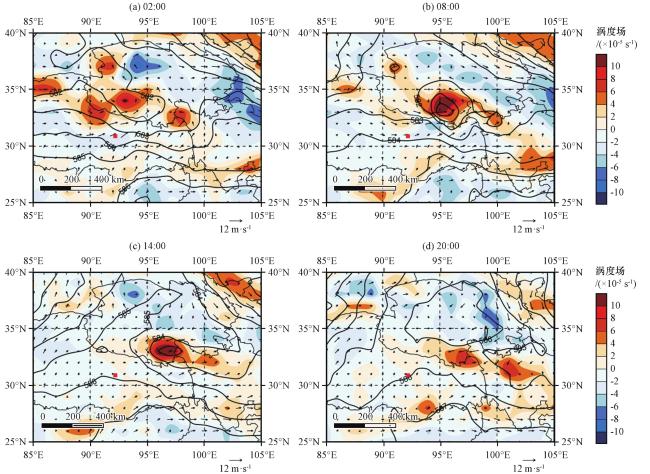
图3 2014年8月17日500 hPa高度场(等值线, 单位: dagpm)、 风场(矢量, 单位: )和相对涡度场(彩色区, 单位: ×10-5 s-1)红色小方块代表那曲站 Fig.3 The 500 hPa height field (contour, unit: dagpm), wind field (vector, unit: ) and relative vorticity field (color area, unit: ×10-5 s-1) on 17 August 2014.Red squares represent Naqu station |
3.2 动力条件
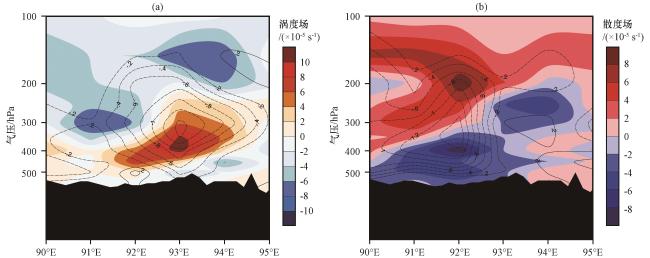
图4 2014年8月16日14:00沿31.29°N, 90°E -95°E绘制的垂直速度(等值线, 单位: Pa·s-1)和涡度场(彩色区, 单位: ×10-5 s-1)(a)以及20:00的垂直速度(等值线, 单位: Pa·s-1)和散度场(彩色区, 单位: ×10-5 s-1) (b)纬向剖面Fig.4 Zonal profile of the vertical velocity (contour, unit: Pa·s-1) and vorticity field (color area, unit: ×10-5 s-1) at 14:00 (a) and the vertical velocity (contour, unit: Pa·s-1) and divergence field (color area, unit: ×10-5 s-1) at 20:00 (b) on 16 August 2014 |
3.3 水汽条件
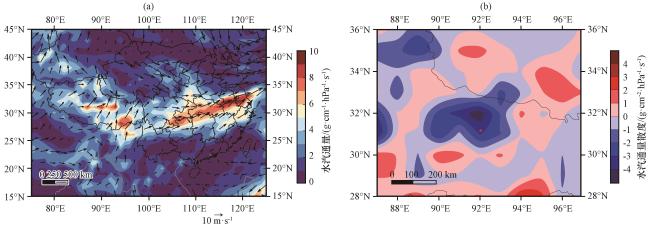
图5 2014年8月16日08:00 500 hPa水汽通量场(彩色区, 单位: g·cm-1·hPa-1·s-1)、 风场(矢量, 单位: m·s-1)(a)及水汽通量散度场(b, 彩色区, 单位: g·cm-2·hPa-1·s-1)分布红色小方块代表那曲站 Fig.5 Distribution of water vapor flux field (color area, unit: g·cm-1·hPa-1·s-1), wind field (vector, unit: m·s-1) (a) and water vapor flux divergence field (b, color area, unit: g·cm-2·hPa-1·s-1).Red squares represent Naqu station |
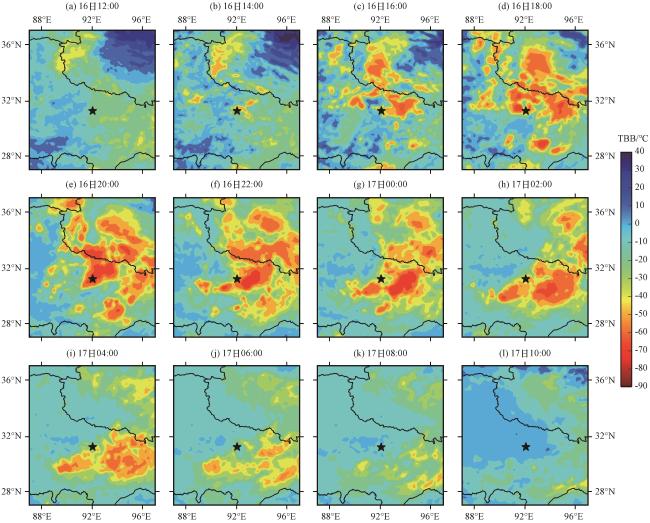
3.4 强对流云团
3.5 云垂直结构
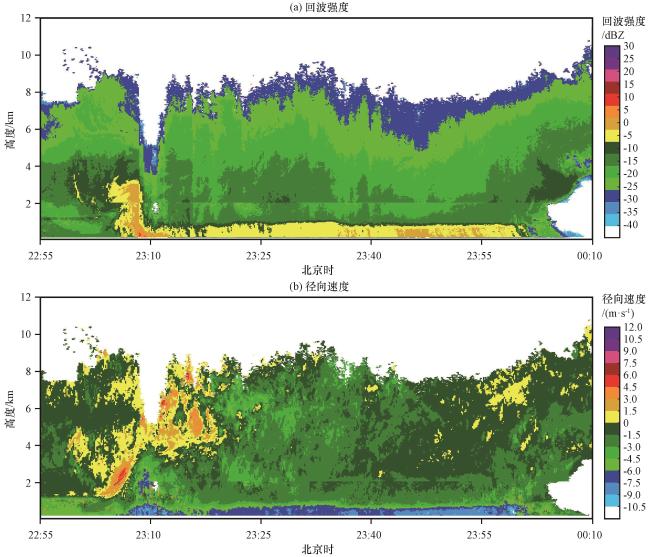
图7 Ka波段毫米波云雷达观测地2014年8月16日22:55至17日00:10那曲站对流云回波强度(a, 彩色区, 单位: dBZ)和径向速度(b, 彩色区, 单位: m·s-1)Fig.7 The echo intensity (a, color area, unit: dBZ) and the radial velocity (b, color area, unit: m·s-1) of the convective cloud at Naqu station observed by Ka-band millimeter-wave cloud radar from 22:55 on 16 to 00:10 on 17 August 2014 |
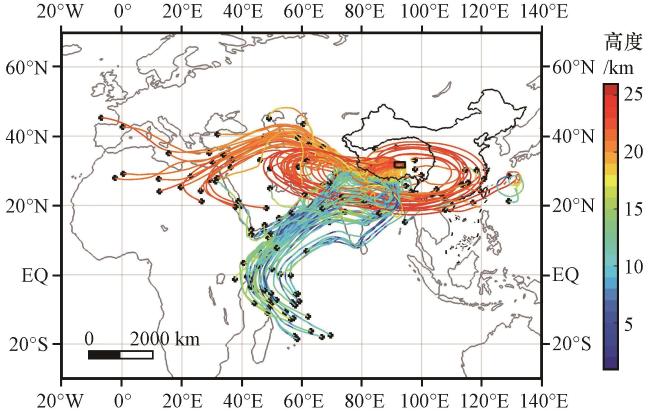
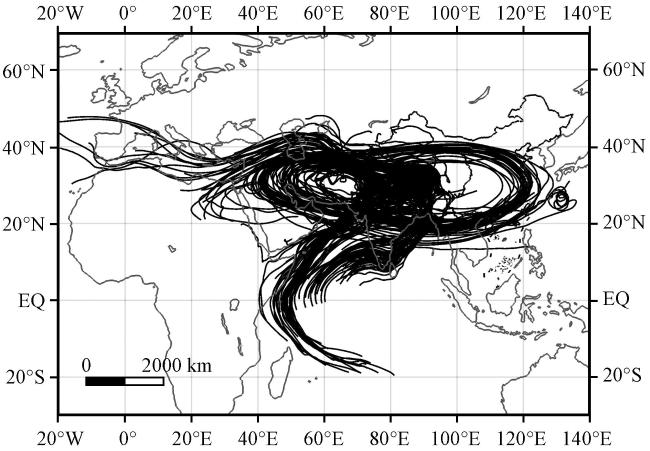
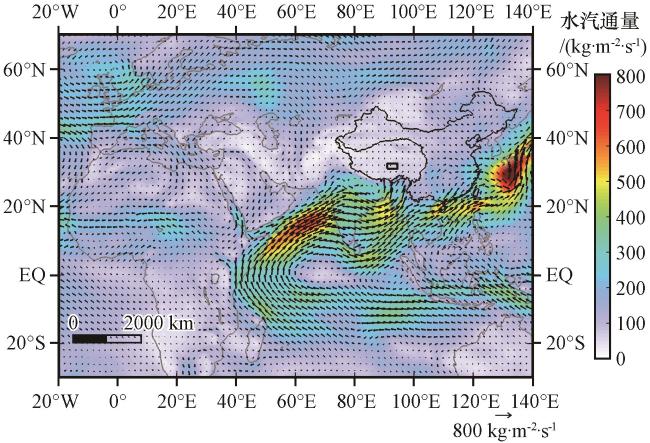
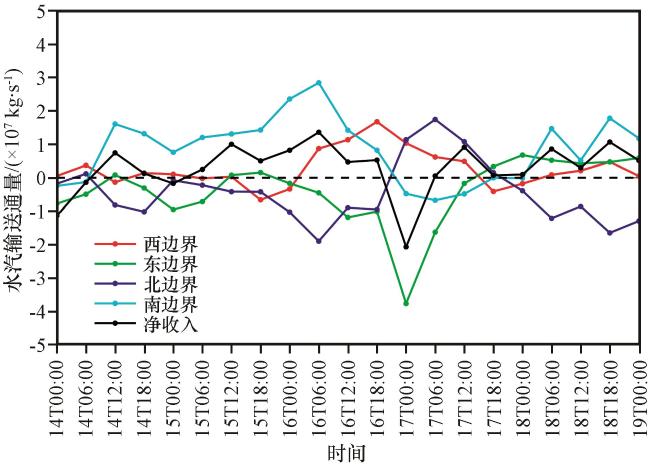
3.6 水汽追踪
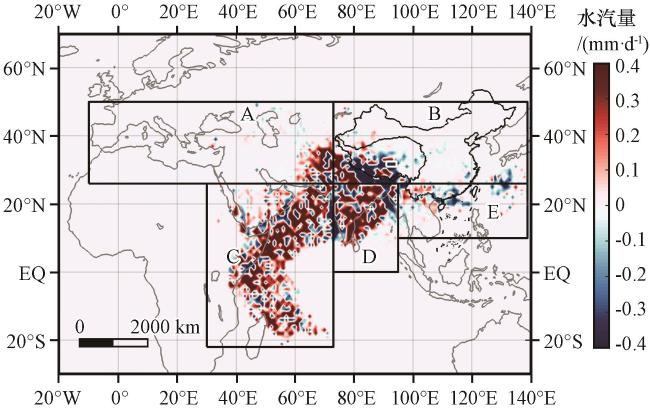
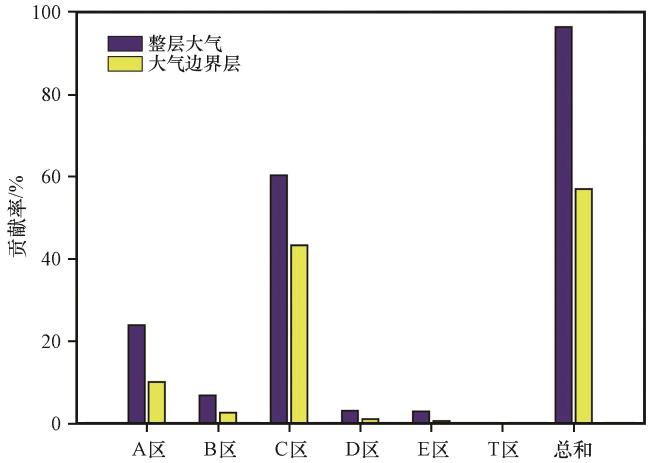
3.7 水汽源区的识别和贡献的定量计算
图14 考察的水汽源区在整层大气内和大气边界层内对研究区域降水的水汽贡献率及各源区总的贡献率Fig.14 The water vapor contribution rate of the investigated water vapor source area in the entire atmosphere and the atmospheric boundary layer to the precipitation in the study area, and the total contribution rate of each source area |